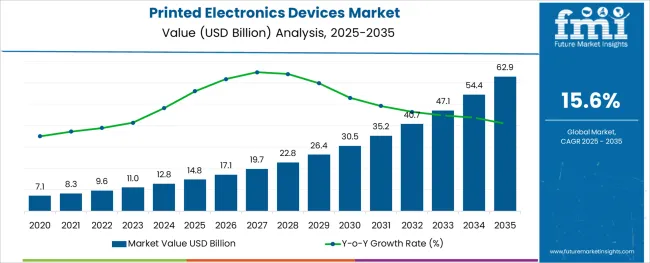
The Printed Electronics Devices Market is estimated to be valued at USD 14.8 billion in 2025 and is projected to reach USD 62.9 billion by 2035, registering a compound annual growth rate (CAGR) of 15.6% over the forecast period.

The printed electronics devices market is experiencing dynamic growth due to increasing demand for flexible, lightweight, and low-cost electronic components across consumer electronics, healthcare, and automotive sectors. The trend toward wearable devices, smart packaging, and IoT integration has accelerated adoption of printed electronics as they enable novel form factors and scalable production.
Technological advancements in materials science and printing precision have enhanced device performance, durability, and conductivity, encouraging broader industrial use. Environmental benefits associated with reduced material waste and energy consumption in printed manufacturing align with sustainability goals.
Ongoing collaborations between material suppliers, device manufacturers, and end users are fostering innovation and standardization. As demand rises for rapid prototyping and mass customization, printed electronics are positioned to disrupt traditional rigid electronics manufacturing, opening significant opportunities for market expansion in both developed and emerging economies.
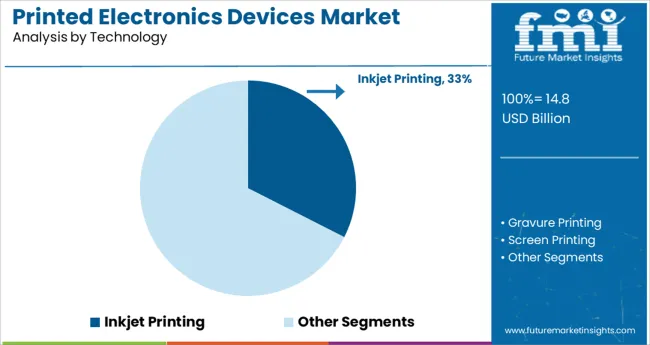
The market is segmented by Technology and region. By Technology, the market is divided into Inkjet Printing, Gravure Printing, Screen Printing, Flexographic Printing, and Others. Regionally, the market is classified into North America, Latin America, Western Europe, Eastern Europe, Balkan & Baltic Countries, Russia & Belarus, Central Asia, East Asia, South Asia & Pacific, and the Middle East & Africa.

Inkjet printing technology is expected to hold approximately 32.5% of the total revenue share in the printed electronics devices market by 2025, making it the leading printing technology segment. This leadership is explained by inkjet printing’s ability to deliver high resolution, precise deposition of functional inks, and compatibility with a wide range of substrates including flexible plastics and textiles.
Its digital and maskless process allows rapid customization, low material waste, and reduced production costs compared to traditional printing methods. Additionally, inkjet printing supports multiple functional materials such as conductive inks, semiconductors, and insulators, enabling diverse applications from sensors to displays.
Continuous improvements in printhead technology and ink formulations have expanded throughput and reliability, reinforcing inkjet printing’s position as the preferred choice for commercial-scale printed electronics manufacturing.
The growing adoption of IoT is opening up new growth opportunities and expanding the scope of printed electronics device applications across the industry.
The rising demand for sophisticated OLED displays and printed RFID devices are paving the way for further technological adoption of printed electronic devices due to their low production cost, improved efficiency, and low power consumption.
Printed electronic devices have become a key research area for emerging companies, with a focus on ongoing upgrades and improvisations to improve existing capabilities.
Over the last few decades, increased Research and Development investments by various associations, companies, and manufacturers have resulted in several new innovations and developments in the printed electronics devices market. Consumer electronics manufacturers, such as IoT devices, smartphones, display devices, and other communication devices, are among the end-product manufacturers.
When it comes to emerging technologies, cost reduction is frequently a driving force behind Research and Development initiatives. The expense of new materials and equipment for printed electronics devices research, on the other hand, is very costly. As a result, these factors are anticipated to restrain the printed electronics devices market growth during the forecast period.
Printed electronics device manufacturers must consequently place a high priority on Research and Development in order to produce value that goes beyond cost reduction, such as thinner, lighter, more resilient, and flexible products.
Material qualities are likely to influence investment decisions in particular technologies. The development of new technologies necessitates the use of precision machinery and trained employees, which adds to the overall printed electronics devices market expenditures. As a result, the high investment required is a constraint anticipated to diminish the demand for printed electronic devices through 2035.
Smart packaging is gaining popularity and is predicted to quickly replace traditional packaging as it allows for shipping monitoring and quality control of packaged goods. Packaging with built-in electronics creates new communication routes between the physical and digital worlds. This factor is anticipated to boost the sales of printed electronic devices during the projected period.
This is likely to assist companies in the printed electronics devices market in focusing on individual clients and personalizing customer service delivery. Printed sensors are used in the smart packaging application to analyze, secure, and measure the temperature of packaged products, as well as to provide real-time information on the origin, transportation, and condition of products.
In 2024, the Asia Pacific region dominated the global market, accounting for more than 46 percent of total revenue. The significant share in the printed electronics devices market can be attributable mostly to the growing use of printed electronics technology in consumer electronics applications.
The rise in the sales of printed electronics devices can be linked to the region's fast-expanding electronics manufacturing sector. Emerging markets such as China, South Korea, and Japan contribute significantly to the target market. Furthermore, the Asia Pacific region, particularly China, is a manufacturing hub for printed electronic devices.

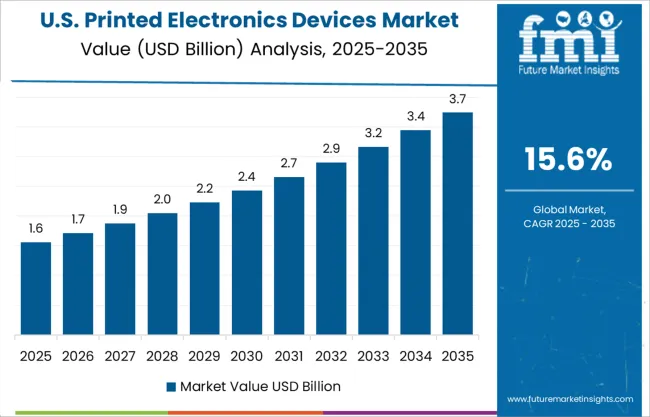
North America is witnessing significant growth in the printed electronics devices market, with an anticipated share of 24.2% in 2025.
The North American printed electronics market is expected to earn significant revenue in 2025, as well as the quickest growth between 2025 and 2035. This is due to the increasing demand for flexible and resilient substrates for printed electronic circuits, as well as the increasing penetration of IoT technologies. Furthermore, the low manufacturing cost and rapid evolution of digital printing technology are adding to the region's market growth.

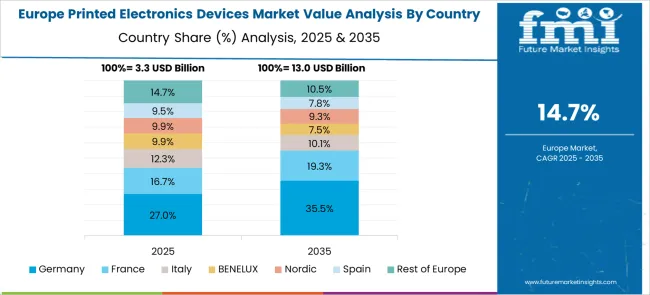
The demand for printed electronics devices is expected to gain pace in Europe due to increased Research and Development spending and expanding acceptance of the technology in a variety of industrial applications such as photovoltaic, lighting, and RFID devices. During the predicted period, the region is expected to capture 26.2% of the overall market share.
The increasing acceptance of novel technologies in the European region, as well as the expanding popularity of electronics items, are contributing considerably to the expansion of the printed electronics devices market in Europe.
Startups in the printed electronics devices market are incorporating technology into diverse items based on rising demand for printed electronic devices and then delivering them to distributors or retailers for sale.
To gain a foothold in expanding regional markets such as Asia Pacific, these companies are focused on mergers and acquisitions or distribution partnerships. For example, Thin Film Electronics ASA (USA) has struck a distribution arrangement with CymMetrik, a Chinese company.
Some of the key market participants in the printed electronics devices market are BASF SE, E Ink Holdings, Inc, DuPont, Enfucell Oy, GSI Technologies, Blue Spark Technologies, IMPRINT ENERGY, and BrightVolt.
Companies are focusing on expanding their operations across multiple locations in order to meet rising consumer demand and are trying to extend their consumer base in emerging markets through partnerships and acquisitions.
The printed electronics devices market is witnessing intense competition among key companies for market understanding and dominance through rigorous Research and Development, novel product releases, and printing capability advancements.
Some of the recent developments in printed electronic devices are:
| Report Attribute | Details |
|---|---|
| Growth Rate | CAGR of 15.6% from 2025 to 2035 |
| Base Year for Estimation | 2025 |
| Historical Data | 2020 to 2024 |
| Forecast Period | 2025 to 2035 |
| Quantitative Units | Revenue in million and CAGR from 2025 to 2035 |
| Report Coverage | Revenue forecast, volume forecast, company ranking, competitive landscape, growth factors, and trends, Pricing Analysis, |
| Segments Covered |
Technology, Region |
| Regions Covered |
North America; Latin America; Western Europe; Eastern Europe; The Asia Pacific excluding Japan; Japan; The Middle East and Africa |
| Key Countries Profiled | United States of America, Canada, Brazil, Argentina, Germany, United Kingdom, France, Spain, Italy, Nordics, BENELUX, Australia & New Zealand, China, India, GCC Countries, South Africa |
| Key Companies Profiled | BASF SE, E Ink Holdings, Inc, DuPont, Enfucell Oy, GSI Technologies, Blue Spark Technologies, IMPRINT ENERGY, and BrightVolt. |
| Customization | Available Upon Request |
The global printed electronics devices market is estimated to be valued at USD 14.8 billion in 2025.
It is projected to reach USD 62.9 billion by 2035.
The market is expected to grow at a 15.6% CAGR between 2025 and 2035.
The key product types are inkjet printing, gravure printing, screen printing, flexographic printing and others.
segment is expected to dominate with a 0.0% industry share in 2025.


Our Research Products

The "Full Research Suite" delivers actionable market intel, deep dives on markets or technologies, so clients act faster, cut risk, and unlock growth.

The Leaderboard benchmarks and ranks top vendors, classifying them as Established Leaders, Leading Challengers, or Disruptors & Challengers.

Locates where complements amplify value and substitutes erode it, forecasting net impact by horizon

We deliver granular, decision-grade intel: market sizing, 5-year forecasts, pricing, adoption, usage, revenue, and operational KPIs—plus competitor tracking, regulation, and value chains—across 60 countries broadly.

Spot the shifts before they hit your P&L. We track inflection points, adoption curves, pricing moves, and ecosystem plays to show where demand is heading, why it is changing, and what to do next across high-growth markets and disruptive tech

Real-time reads of user behavior. We track shifting priorities, perceptions of today’s and next-gen services, and provider experience, then pace how fast tech moves from trial to adoption, blending buyer, consumer, and channel inputs with social signals (#WhySwitch, #UX).

Partner with our analyst team to build a custom report designed around your business priorities. From analysing market trends to assessing competitors or crafting bespoke datasets, we tailor insights to your needs.
Supplier Intelligence
Discovery & Profiling
Capacity & Footprint
Performance & Risk
Compliance & Governance
Commercial Readiness
Who Supplies Whom
Scorecards & Shortlists
Playbooks & Docs
Category Intelligence
Definition & Scope
Demand & Use Cases
Cost Drivers
Market Structure
Supply Chain Map
Trade & Policy
Operating Norms
Deliverables
Buyer Intelligence
Account Basics
Spend & Scope
Procurement Model
Vendor Requirements
Terms & Policies
Entry Strategy
Pain Points & Triggers
Outputs
Pricing Analysis
Benchmarks
Trends
Should-Cost
Indexation
Landed Cost
Commercial Terms
Deliverables
Brand Analysis
Positioning & Value Prop
Share & Presence
Customer Evidence
Go-to-Market
Digital & Reputation
Compliance & Trust
KPIs & Gaps
Outputs
Full Research Suite comprises of:
Market outlook & trends analysis
Interviews & case studies
Strategic recommendations
Vendor profiles & capabilities analysis
5-year forecasts
8 regions and 60+ country-level data splits
Market segment data splits
12 months of continuous data updates
DELIVERED AS:
PDF EXCEL ONLINE
Printed Labels Market Size and Share Forecast Outlook 2025 to 2035
Printed Chipless RFID Radio Frequency Identification Market Size and Share Forecast Outlook 2025 to 2035
Printed Sensors Market Size and Share Forecast Outlook 2025 to 2035
Printed Circuit Board (PCB) Assembly Market Size and Share Forecast Outlook 2025 to 2035
Printed Tape Market Size and Share Forecast Outlook 2025 to 2035
Printed Antenna Market Size and Share Forecast Outlook 2025 to 2035
Printed Aluminium Foil Packaging Market Size and Share Forecast Outlook 2025 to 2035
Printed and Flexible Sensors Market Report - Growth & Demand 2025 to 2035
Printed Circuit Boards (PCB) Market Trends - Demand & Forecast 2025 to 2035
Printed Plastic Films Market Insights - Growth & Forecast 2025 to 2035
Printed Boxes Market Analysis – Trends, Demand & Forecast 2025 to 2035
Industry Share & Competitive Positioning in Printed Aluminium Foil Packaging
Market Share Distribution Among Printed Carton Manufacturers
Printed Electronics Market Size and Share Forecast Outlook 2025 to 2035
3D Printed Dental Brace Market Size and Share Forecast Outlook 2025 to 2035
3D-Printed Prosthetic Implants Market Size and Share Forecast Outlook 2025 to 2035
3D Printed Maxillofacial Implants Market Size and Share Forecast Outlook 2025 to 2035
3D-Printed Personalized Masks Market Size and Share Forecast Outlook 2025 to 2035
3D Printed Packaging Market Size and Share Forecast Outlook 2025 to 2035
3D Printed Clear Dental Aligners Market Size and Share Forecast Outlook 2025 to 2035

Thank you!
You will receive an email from our Business Development Manager. Please be sure to check your SPAM/JUNK folder too.
Chat With
MaRIA