Printed Sensors Market Outlook (2023 to 2033)

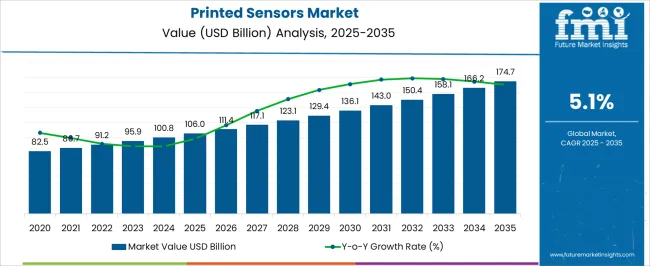
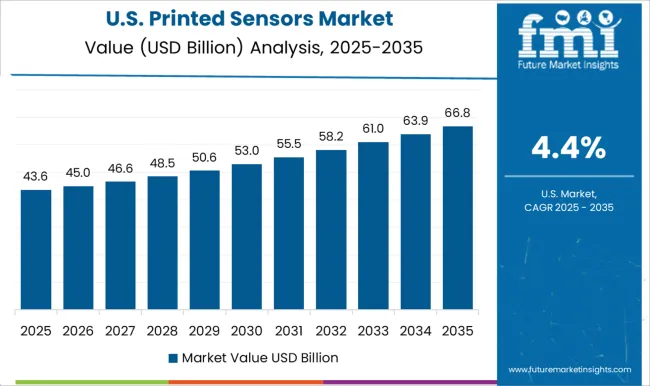
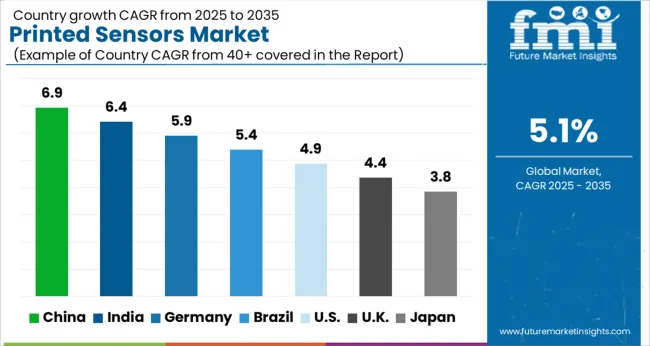
The global printed sensors market is forecasted to be appraised at US$ 161,882.6 million by 2033, up from US$ 95,374.8 million in 2023. The printed sensors industry is projected to witness a CAGR of 5.4% during the forecast period.

The sales of printed sensors are on a significant rise due to their high mechanical flexibility. These sensors can efficiently detect various stimuli related to specific biological and environmental species. Hence, they have been gaining widespread attention and consequently, the demand for printed sensors is being bolstered in the global market.

Printed sensors are gaining power in recent times due to their application in multiple sectors like automobiles, aviation, healthcare, environmental monitoring, and more, facilitating the availability of printed sensors in numerous verticals.

Printed sensors are eco-friendly in nature and are flexible, with the ability to fit on various small-shaped electronic devices. Therefore, it is anticipated that the printed sensors industry is likely to witness significant growth during the forecast period.

Attributes Details
Printed Sensors Market Value (2023) US$ 95,374.8 million
Printed Sensors Market Anticipated Value (2033) US$ 161,882.6 million
Printed Sensors Market Projected Growth Rate (2023 to 2033) 5.4%

Don't pay for what you don't need

Customize your report by selecting specific countries or regions and save 30%!

What are the Drivers for the Printed Sensors Market?

It is anticipated that the growing application of printed sensors in wearable medical devices and consumer electronics is a key driver in the market. In recent years, printed sensors have gained huge attention from researchers, owing to their significant potential for wearable electronics and IoT applications. Further, the adoption of printed sensors in device-engineering technologies has resulted in the creation of foldable, light, and flexible sensors.

Printed sensors are widely gaining adoption as they eliminate the use of silicon and metal oxides that are harmful in nature. Instead, with the help of innovative printing technologies, the printed sensors are manufactured over various flexible substrates like paper, plastic, rubber-like polymers, and foils, which render printed sensors to be thin and light with high flexibility for mechanical purposes. This factor is highly driving the printed sensors industry.

The introduction of printed sensors has governed the portability of the product, which has resulted in increased sales of printed sensors in the medical sector. Moreover, it is also projected that some significant opportunities in the future for printed sensors are the growing trends for touch-enabled electronic devices and IoT, augmenting the sales of printed sensors globally.

An important factor driving the sales of printed sensors is the declining prices as printed sensors are becoming compatible with diversified application areas such as packaging, consumer electronics, and more, leveraging printed sensors technology at a low cost. Additionally, the rising demand for printed electronic devices corresponds to the growth of the printed sensors industry as well.

What are the Several Challenges in the Printed Sensors Market?

It is anticipated that certain prevailing factors might hinder the demand for printed sensors in the upcoming years, besides the numerous growth factors. Further, the printed sensors have a very complex manufacturing process, and this acts as a key restraint for small and medium-sized companies, limiting the research and development capabilities of these firms.

There are also challenges involved with conductive ink printing and insufficient technological accessibility, such as organic light-emitting diode displays. In addition to that, another challenge faced by the printed sensors industry is that it is still in its development stage.

Enabling technologies like ultra-thin chip technology is expected to address the existing bottlenecks in microelectronics, such as 3D integration, which in turn can open up new opportunities for the growth of the demand for printed sensors in the market.
Sudip Saha
Sudip Saha

Principal Consultant

Talk to Analyst

Find your sweet spots for generating winning opportunities in this market.

Regional Analysis

How is the Performance of North America’s Printed Sensors Market?

Region North America
Market Share % (2022) 30.4%

The North America region is anticipated to lead the printed sensors industry share in the upcoming years. Currently, this region is accountable for more than 30.4% of the total market printed sensors share.

The market demand for printed sensors is getting augmented by a wide margin, owing to the high technological advancement and adoption in the North American region. In addition, the populace is getting indulged in healthcare spending, which is bolstering the sales of printed sensors as well. With notable growth in the economy and growing demand for consumer electronics, the printed sensors industry share is likely to witness a notable expansion during the forecast period.
What is the Growth Outlook for Europe’s Printed Sensors Market?

Region Europe
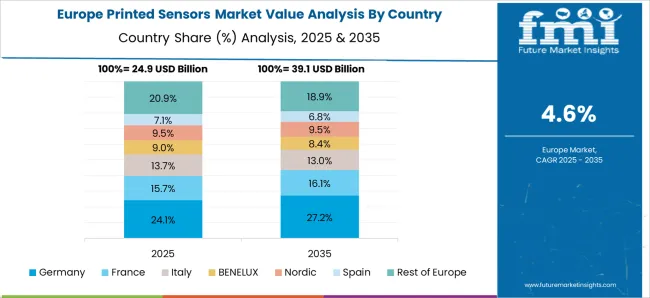
Market Share % (2022) 23.1%

At present, Europe holds 23.1% of the total printed sensors industry share. The Europe region is expected to have significant growth in sales of printed sensors in the coming years. Due to support provided by the government, and grants received for manufacturing, this region is expected to have an increased demand for printed sensors in the coming years.

Start-up Ecosystem

How are New Entrants Revolutionizing the Printed Sensors Market?

The start-up ecosystem in the printed sensors industry is intense with frequent innovations being made. Moreover, Startups in the printed sensors industry are focusing on improvising the devices for maximized implications in medical and electronic devices, creating further demand for printed sensors in these sectors. For example,
  • Forciot is a provider of IoT-based flexible pressure sensor components for multiple industries. It develops IoT-based flexible pressure sensors that can be employed in wearable and industrial applications. Their sensors can be integrated to monitor parameters like force distribution, load balance, and motion, among others.
  • Canatu is a developer and manufacturer of 3D formable and bendable transparent conductive films and touch sensors. These are based on a type of carbon nanomaterial, also known as NanoBud and a single-step manufacturing process that combines an aerosol synthesis of the former material and roll-to-roll deposition by direct dry printing.

Get the data you need at a Fraction of the cost

Personalize your report by choosing insights you need
and save 40%!

Competitive Landscape

Who are the Key Market Players for the Printed Sensors?

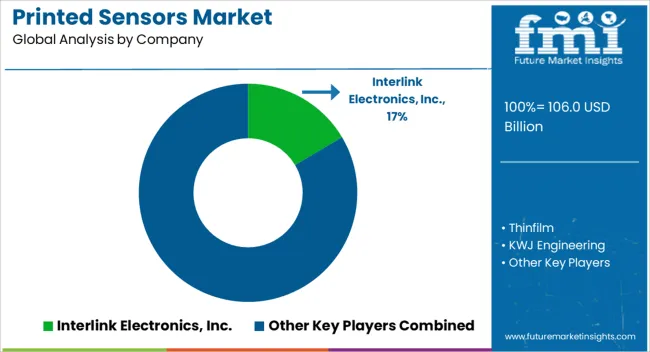
Some of the leading printed sensors global players include Interlink Electronics, Inc., Thinfilm, KWJ Engineering, Peratech Holdco Limited, ISORG, Integrated Device Technology, Inc., Tekscan, Inc., FUJIFILM Holdings America Corporation, GSI Technologies, LLC, and PST sensors.

The key players in the industry are continuously collaborating, upgrading, and making efforts to expand the printed sensors industry. Further modifications of the sensors to enhance the end-user experience further bolster the adoption of printed sensors in maximum industry verticals.

Recent Developments in the Market:

  • FlexEnable obtained Merck’s supreme-quality, high-performing Organic Thin-Film Transistor (OTFT) materials in November 2019. These materials include highly-patented dielectrics and organic semiconductors. The acquisition comprises 300 patents, including processes, materials, and devices. After the purchase, the overall number of organic electronics patents exceeded 1,000.
  • Isorg and Sumitomo Chemical, a leading producer and provider of OPD materials, signed a contract to develop novel OPD materials in July 2019. The deal ensured that new OPD products are compatible with hybrid organic-CMOS image sensors and smartphone fingerprint sensors.

Report Scope

Report Attributes Details
Growth Rate CAGR of 5.4% from 2023 to 2033
Base Year for Estimation 2022
Historical Data 2018 to 2022
Forecast Period 2023 to 2033
Quantitative Units Revenue in US$ million and CAGR from 2023 to 2033
Report Coverage Revenue Forecast, Volume Forecast, Company Ranking, Competitive Landscape, Growth Factors, Trends, and Pricing Analysis
Segments Covered
  • Type
  • Application
  • Printing Technology
  • Region
Regions Covered
  • North America
  • Latin America
  • Europe
  • East Asia
  • South Asia
  • Oceania
  • The Middle East and Africa
Key Countries Profiled
  • The United States
  • Canada
  • Brazil
  • Argentina
  • Germany
  • The United Kingdom
  • France
  • Spain
  • Italy
  • Nordics
  • BENELUX
  • Australia & New Zealand
  • China
  • India
  • ASIAN
  • GCC
  • South Africa
Key Companies Profiled
  • Interlink Electronics, Inc.
  • Thinfilm,
  • KWJ Engineering
  • Peratech Holdco Limited
  • ISORG
  • Integrated Device Technology, Inc.
  • Tekscan, Inc.
  • FUJIFILM Holdings America Corporation
  • GSI Technologies
  • LLC
  • PST sensors
Customization Available Upon Request

Key Segments in the Printed Sensors Market

By Type:

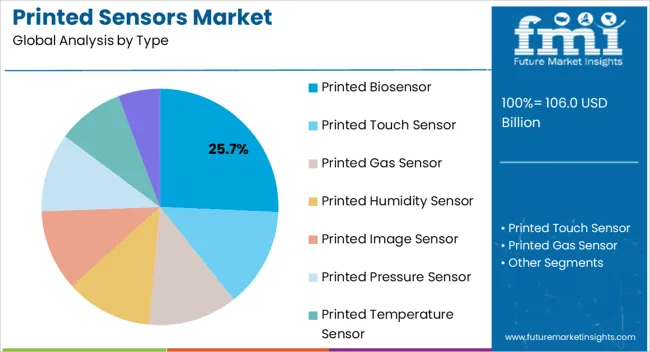
  • Printed Biosensor
  • Printed Touch Sensor
  • Printed Gas Sensor
  • Printed Humidity Sensor
  • Printed Image Sensor
  • Printed Pressure Sensor
  • Printed Temperature Sensor
  • Printed Proximity Sensor

By Printing Technology:

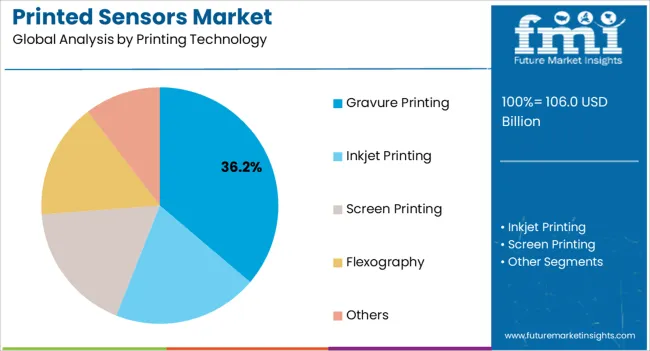
  • Gravure Printing
  • Inkjet Printing
  • Screen Printing
  • Flexography
  • Others

By Application:

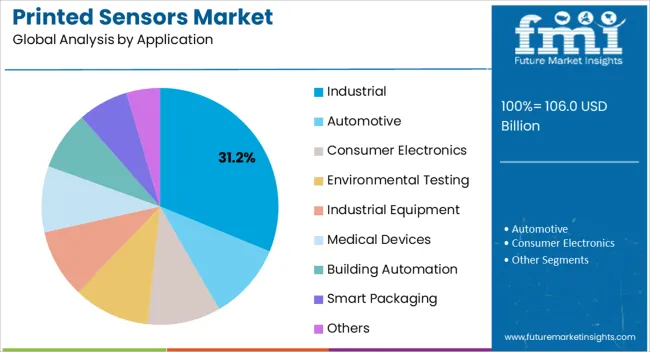
  • Industrial
  • Automotive
  • Consumer Electronics
    • Smartphones
    • Wearable Devices
    • Others
  • Environmental Testing
  • Industrial Equipment
  • Medical Devices
  • Building Automation
  • Smart Packaging
  • Others

By Region:

  • North America
  • Latin America
  • The Middle East and Africa
  • Europe
  • Asia Pacific

Frequently Asked Questions

How is the Present Market Valuation?

This market is estimated to reach US$ 161,882.6 million by 2033.

Which Region is Dominating the Global Market?

North America dominates the global market.

What are the Key Challenges of the Market?

Complex printed sensor manufacturing limits the research & development of SMEs.

Which is the Top Trend in the Market?

Printed sensors revolutionize flexible device technologies.

Which Country is Expected to Account for a Significant Market Share?

The United States accounts for a significant market share.

Table of Content
1. Executive Summary
    1.1. Global Market Outlook
    1.2. Demand-side Trends
    1.3. Supply-side Trends
    1.4. Technology Roadmap Analysis
    1.5. Analysis and Recommendations
2. Market Overview
    2.1. Market Coverage / Taxonomy
    2.2. Market Definition / Scope / Limitations
3. Market Background
    3.1. Market Dynamics
        3.1.1. Drivers
        3.1.2. Restraints
        3.1.3. Opportunity
        3.1.4. Trends
    3.2. Scenario Forecast
        3.2.1. Demand in Optimistic Scenario
        3.2.2. Demand in Likely Scenario
        3.2.3. Demand in Conservative Scenario
    3.3. Opportunity Map Analysis
    3.4. Product Life Cycle Analysis
    3.5. Supply Chain Analysis
        3.5.1. Supply Side Participants and their Roles
            3.5.1.1. Producers
            3.5.1.2. Mid-Level Participants (Traders/ Agents/ Brokers)
            3.5.1.3. Wholesalers and Distributors
        3.5.2. Value Added and Value Created at Node in the Supply Chain
        3.5.3. List of Raw Material Suppliers
        3.5.4. List of Existing and Potential Buyer’s
    3.6. Investment Feasibility Matrix
    3.7. Value Chain Analysis
        3.7.1. Profit Margin Analysis
        3.7.2. Wholesalers and Distributors
        3.7.3. Retailers
    3.8. PESTLE and Porter’s Analysis
    3.9. Regulatory Landscape
        3.9.1. By Key Regions
        3.9.2. By Key Countries
    3.10. Regional Parent Market Outlook
    3.11. Production and Consumption Statistics
    3.12. Import and Export Statistics
4. Global Market Analysis 2018 to 2022 and Forecast, 2023 to 2033
    4.1. Historical Market Size Value (US$ Million) & Volume (Units) Analysis, 2018 to 2022
    4.2. Current and Future Market Size Value (US$ Million) & Volume (Units) Projections, 2023 to 2033
        4.2.1. Y-o-Y Growth Trend Analysis
        4.2.2. Absolute $ Opportunity Analysis
5. Global Market Analysis 2018 to 2022 and Forecast 2023 to 2033, By Type
    5.1. Introduction / Key Findings
    5.2. Historical Market Size Value (US$ Million) & Volume (Units) Analysis By Type, 2018 to 2022
    5.3. Current and Future Market Size Value (US$ Million) & Volume (Units) Analysis and Forecast By Type, 2023 to 2033
        5.3.1. Printed Biosensor
        5.3.2. Printed Touch Sensor
        5.3.3. Printed Gas Sensor
        5.3.4. Printed Humidity Sensor
        5.3.5. Printed Image Sensor
        5.3.6. Printed Pressure Sensor
        5.3.7. Printed Temperature Sensor
        5.3.8. Printed Proximity Sensor
    5.4. Y-o-Y Growth Trend Analysis By Type, 2018 to 2022
    5.5. Absolute $ Opportunity Analysis By Type, 2023 to 2033
6. Global Market Analysis 2018 to 2022 and Forecast 2023 to 2033, By Printing Technology
    6.1. Introduction / Key Findings
    6.2. Historical Market Size Value (US$ Million) & Volume (Units) Analysis By Printing Technology, 2018 to 2022
    6.3. Current and Future Market Size Value (US$ Million) & Volume (Units) Analysis and Forecast By Printing Technology, 2023 to 2033
        6.3.1. Gravure Printing
        6.3.2. Inkjet Printing
        6.3.3. Screen Printing
        6.3.4. Flexography
        6.3.5. Others
    6.4. Y-o-Y Growth Trend Analysis By Printing Technology, 2018 to 2022
    6.5. Absolute $ Opportunity Analysis By Printing Technology, 2023 to 2033
7. Global Market Analysis 2018 to 2022 and Forecast 2023 to 2033, By Application
    7.1. Introduction / Key Findings
    7.2. Historical Market Size Value (US$ Million) & Volume (Units) Analysis By Application, 2018 to 2022
    7.3. Current and Future Market Size Value (US$ Million) & Volume (Units) Analysis and Forecast By Application, 2023 to 2033
        7.3.1. Industrial
        7.3.2. Automotive
        7.3.3. Consumer Electronics
            7.3.3.1. Smartphones
            7.3.3.2. Wearable Devices
            7.3.3.3. Others
        7.3.4. Environmental Testing
        7.3.5. Industrial Equipment
        7.3.6. Medical Devices
        7.3.7. Building Automation
        7.3.8. Smart Packaging
        7.3.9. Others
    7.4. Y-o-Y Growth Trend Analysis By Application, 2018 to 2022
    7.5. Absolute $ Opportunity Analysis By Application, 2023 to 2033
8. Global Market Analysis 2018 to 2022 and Forecast 2023 to 2033, By Region
    8.1. Introduction
    8.2. Historical Market Size Value (US$ Million) & Volume (Units) Analysis By Region, 2018 to 2022
    8.3. Current Market Size Value (US$ Million) & Volume (Units) Analysis and Forecast By Region, 2023 to 2033
        8.3.1. North America
        8.3.2. Latin America
        8.3.3. Western Europe
        8.3.4. Eastern Europe
        8.3.5. South Asia and Pacific
        8.3.6. East Asia
        8.3.7. Middle East and Africa
    8.4. Market Attractiveness Analysis By Region
9. North America Market Analysis 2018 to 2022 and Forecast 2023 to 2033, By Country
    9.1. Historical Market Size Value (US$ Million) & Volume (Units) Trend Analysis By Market Taxonomy, 2018 to 2022
    9.2. Market Size Value (US$ Million) & Volume (Units) Forecast By Market Taxonomy, 2023 to 2033
        9.2.1. By Country
            9.2.1.1. U.S.
            9.2.1.2. Canada
        9.2.2. By Type
        9.2.3. By Printing Technology
        9.2.4. By Application
    9.3. Market Attractiveness Analysis
        9.3.1. By Country
        9.3.2. By Type
        9.3.3. By Printing Technology
        9.3.4. By Application
    9.4. Key Takeaways
10. Latin America Market Analysis 2018 to 2022 and Forecast 2023 to 2033, By Country
    10.1. Historical Market Size Value (US$ Million) & Volume (Units) Trend Analysis By Market Taxonomy, 2018 to 2022
    10.2. Market Size Value (US$ Million) & Volume (Units) Forecast By Market Taxonomy, 2023 to 2033
        10.2.1. By Country
            10.2.1.1. Brazil
            10.2.1.2. Mexico
            10.2.1.3. Rest of Latin America
        10.2.2. By Type
        10.2.3. By Printing Technology
        10.2.4. By Application
    10.3. Market Attractiveness Analysis
        10.3.1. By Country
        10.3.2. By Type
        10.3.3. By Printing Technology
        10.3.4. By Application
    10.4. Key Takeaways
11. Western Europe Market Analysis 2018 to 2022 and Forecast 2023 to 2033, By Country
    11.1. Historical Market Size Value (US$ Million) & Volume (Units) Trend Analysis By Market Taxonomy, 2018 to 2022
    11.2. Market Size Value (US$ Million) & Volume (Units) Forecast By Market Taxonomy, 2023 to 2033
        11.2.1. By Country
            11.2.1.1. Germany
            11.2.1.2. U.K.
            11.2.1.3. France
            11.2.1.4. Spain
            11.2.1.5. Italy
            11.2.1.6. Rest of Western Europe
        11.2.2. By Type
        11.2.3. By Printing Technology
        11.2.4. By Application
    11.3. Market Attractiveness Analysis
        11.3.1. By Country
        11.3.2. By Type
        11.3.3. By Printing Technology
        11.3.4. By Application
    11.4. Key Takeaways
12. Eastern Europe Market Analysis 2018 to 2022 and Forecast 2023 to 2033, By Country
    12.1. Historical Market Size Value (US$ Million) & Volume (Units) Trend Analysis By Market Taxonomy, 2018 to 2022
    12.2. Market Size Value (US$ Million) & Volume (Units) Forecast By Market Taxonomy, 2023 to 2033
        12.2.1. By Country
            12.2.1.1. Poland
            12.2.1.2. Russia
            12.2.1.3. Czech Republic
            12.2.1.4. Romania
            12.2.1.5. Rest of Eastern Europe
        12.2.2. By Type
        12.2.3. By Printing Technology
        12.2.4. By Application
    12.3. Market Attractiveness Analysis
        12.3.1. By Country
        12.3.2. By Type
        12.3.3. By Printing Technology
        12.3.4. By Application
    12.4. Key Takeaways
13. South Asia and Pacific Market Analysis 2018 to 2022 and Forecast 2023 to 2033, By Country
    13.1. Historical Market Size Value (US$ Million) & Volume (Units) Trend Analysis By Market Taxonomy, 2018 to 2022
    13.2. Market Size Value (US$ Million) & Volume (Units) Forecast By Market Taxonomy, 2023 to 2033
        13.2.1. By Country
            13.2.1.1. India
            13.2.1.2. Bangladesh
            13.2.1.3. Australia
            13.2.1.4. New Zealand
            13.2.1.5. Rest of South Asia and Pacific
        13.2.2. By Type
        13.2.3. By Printing Technology
        13.2.4. By Application
    13.3. Market Attractiveness Analysis
        13.3.1. By Country
        13.3.2. By Type
        13.3.3. By Printing Technology
        13.3.4. By Application
    13.4. Key Takeaways
14. East Asia Market Analysis 2018 to 2022 and Forecast 2023 to 2033, By Country
    14.1. Historical Market Size Value (US$ Million) & Volume (Units) Trend Analysis By Market Taxonomy, 2018 to 2022
    14.2. Market Size Value (US$ Million) & Volume (Units) Forecast By Market Taxonomy, 2023 to 2033
        14.2.1. By Country
            14.2.1.1. China
            14.2.1.2. Japan
            14.2.1.3. South Korea
        14.2.2. By Type
        14.2.3. By Printing Technology
        14.2.4. By Application
    14.3. Market Attractiveness Analysis
        14.3.1. By Country
        14.3.2. By Type
        14.3.3. By Printing Technology
        14.3.4. By Application
    14.4. Key Takeaways
15. Middle East and Africa Market Analysis 2018 to 2022 and Forecast 2023 to 2033, By Country
    15.1. Historical Market Size Value (US$ Million) & Volume (Units) Trend Analysis By Market Taxonomy, 2018 to 2022
    15.2. Market Size Value (US$ Million) & Volume (Units) Forecast By Market Taxonomy, 2023 to 2033
        15.2.1. By Country
            15.2.1.1. GCC Countries
            15.2.1.2. South Africa
            15.2.1.3. Israel
            15.2.1.4. Rest of MEA
        15.2.2. By Type
        15.2.3. By Printing Technology
        15.2.4. By Application
    15.3. Market Attractiveness Analysis
        15.3.1. By Country
        15.3.2. By Type
        15.3.3. By Printing Technology
        15.3.4. By Application
    15.4. Key Takeaways
16. Key Countries Market Analysis
    16.1. U.S.
        16.1.1. Pricing Analysis
        16.1.2. Market Share Analysis, 2022
            16.1.2.1. By Type
            16.1.2.2. By Printing Technology
            16.1.2.3. By Application
    16.2. Canada
        16.2.1. Pricing Analysis
        16.2.2. Market Share Analysis, 2022
            16.2.2.1. By Type
            16.2.2.2. By Printing Technology
            16.2.2.3. By Application
    16.3. Brazil
        16.3.1. Pricing Analysis
        16.3.2. Market Share Analysis, 2022
            16.3.2.1. By Type
            16.3.2.2. By Printing Technology
            16.3.2.3. By Application
    16.4. Mexico
        16.4.1. Pricing Analysis
        16.4.2. Market Share Analysis, 2022
            16.4.2.1. By Type
            16.4.2.2. By Printing Technology
            16.4.2.3. By Application
    16.5. Germany
        16.5.1. Pricing Analysis
        16.5.2. Market Share Analysis, 2022
            16.5.2.1. By Type
            16.5.2.2. By Printing Technology
            16.5.2.3. By Application
    16.6. U.K.
        16.6.1. Pricing Analysis
        16.6.2. Market Share Analysis, 2022
            16.6.2.1. By Type
            16.6.2.2. By Printing Technology
            16.6.2.3. By Application
    16.7. France
        16.7.1. Pricing Analysis
        16.7.2. Market Share Analysis, 2022
            16.7.2.1. By Type
            16.7.2.2. By Printing Technology
            16.7.2.3. By Application
    16.8. Spain
        16.8.1. Pricing Analysis
        16.8.2. Market Share Analysis, 2022
            16.8.2.1. By Type
            16.8.2.2. By Printing Technology
            16.8.2.3. By Application
    16.9. Italy
        16.9.1. Pricing Analysis
        16.9.2. Market Share Analysis, 2022
            16.9.2.1. By Type
            16.9.2.2. By Printing Technology
            16.9.2.3. By Application
    16.10. Poland
        16.10.1. Pricing Analysis
        16.10.2. Market Share Analysis, 2022
            16.10.2.1. By Type
            16.10.2.2. By Printing Technology
            16.10.2.3. By Application
    16.11. Russia
        16.11.1. Pricing Analysis
        16.11.2. Market Share Analysis, 2022
            16.11.2.1. By Type
            16.11.2.2. By Printing Technology
            16.11.2.3. By Application
    16.12. Czech Republic
        16.12.1. Pricing Analysis
        16.12.2. Market Share Analysis, 2022
            16.12.2.1. By Type
            16.12.2.2. By Printing Technology
            16.12.2.3. By Application
    16.13. Romania
        16.13.1. Pricing Analysis
        16.13.2. Market Share Analysis, 2022
            16.13.2.1. By Type
            16.13.2.2. By Printing Technology
            16.13.2.3. By Application
    16.14. India
        16.14.1. Pricing Analysis
        16.14.2. Market Share Analysis, 2022
            16.14.2.1. By Type
            16.14.2.2. By Printing Technology
            16.14.2.3. By Application
    16.15. Bangladesh
        16.15.1. Pricing Analysis
        16.15.2. Market Share Analysis, 2022
            16.15.2.1. By Type
            16.15.2.2. By Printing Technology
            16.15.2.3. By Application
    16.16. Australia
        16.16.1. Pricing Analysis
        16.16.2. Market Share Analysis, 2022
            16.16.2.1. By Type
            16.16.2.2. By Printing Technology
            16.16.2.3. By Application
    16.17. New Zealand
        16.17.1. Pricing Analysis
        16.17.2. Market Share Analysis, 2022
            16.17.2.1. By Type
            16.17.2.2. By Printing Technology
            16.17.2.3. By Application
    16.18. China
        16.18.1. Pricing Analysis
        16.18.2. Market Share Analysis, 2022
            16.18.2.1. By Type
            16.18.2.2. By Printing Technology
            16.18.2.3. By Application
    16.19. Japan
        16.19.1. Pricing Analysis
        16.19.2. Market Share Analysis, 2022
            16.19.2.1. By Type
            16.19.2.2. By Printing Technology
            16.19.2.3. By Application
    16.20. South Korea
        16.20.1. Pricing Analysis
        16.20.2. Market Share Analysis, 2022
            16.20.2.1. By Type
            16.20.2.2. By Printing Technology
            16.20.2.3. By Application
    16.21. GCC Countries
        16.21.1. Pricing Analysis
        16.21.2. Market Share Analysis, 2022
            16.21.2.1. By Type
            16.21.2.2. By Printing Technology
            16.21.2.3. By Application
    16.22. South Africa
        16.22.1. Pricing Analysis
        16.22.2. Market Share Analysis, 2022
            16.22.2.1. By Type
            16.22.2.2. By Printing Technology
            16.22.2.3. By Application
    16.23. Israel
        16.23.1. Pricing Analysis
        16.23.2. Market Share Analysis, 2022
            16.23.2.1. By Type
            16.23.2.2. By Printing Technology
            16.23.2.3. By Application
17. Market Structure Analysis
    17.1. Competition Dashboard
    17.2. Competition Benchmarking
    17.3. Market Share Analysis of Top Players
        17.3.1. By Regional
        17.3.2. By Type
        17.3.3. By Printing Technology
        17.3.4. By Application
18. Competition Analysis
    18.1. Competition Deep Dive
        18.1.1. Interlink Electronics, Inc.
            18.1.1.1. Overview
            18.1.1.2. Product Portfolio
            18.1.1.3. Profitability by Market Segments
            18.1.1.4. Sales Footprint
            18.1.1.5. Strategy Overview
                18.1.1.5.1. Marketing Strategy
                18.1.1.5.2. Product Strategy
                18.1.1.5.3. Channel Strategy
        18.1.2. Thinfilm,
            18.1.2.1. Overview
            18.1.2.2. Product Portfolio
            18.1.2.3. Profitability by Market Segments
            18.1.2.4. Sales Footprint
            18.1.2.5. Strategy Overview
                18.1.2.5.1. Marketing Strategy
                18.1.2.5.2. Product Strategy
                18.1.2.5.3. Channel Strategy
        18.1.3. KWJ Engineering
            18.1.3.1. Overview
            18.1.3.2. Product Portfolio
            18.1.3.3. Profitability by Market Segments
            18.1.3.4. Sales Footprint
            18.1.3.5. Strategy Overview
                18.1.3.5.1. Marketing Strategy
                18.1.3.5.2. Product Strategy
                18.1.3.5.3. Channel Strategy
        18.1.4. Peratech Holdco Limited
            18.1.4.1. Overview
            18.1.4.2. Product Portfolio
            18.1.4.3. Profitability by Market Segments
            18.1.4.4. Sales Footprint
            18.1.4.5. Strategy Overview
                18.1.4.5.1. Marketing Strategy
                18.1.4.5.2. Product Strategy
                18.1.4.5.3. Channel Strategy
        18.1.5. ISORG
            18.1.5.1. Overview
            18.1.5.2. Product Portfolio
            18.1.5.3. Profitability by Market Segments
            18.1.5.4. Sales Footprint
            18.1.5.5. Strategy Overview
                18.1.5.5.1. Marketing Strategy
                18.1.5.5.2. Product Strategy
                18.1.5.5.3. Channel Strategy
        18.1.6. Integrated Device Technology, Inc.
            18.1.6.1. Overview
            18.1.6.2. Product Portfolio
            18.1.6.3. Profitability by Market Segments
            18.1.6.4. Sales Footprint
            18.1.6.5. Strategy Overview
                18.1.6.5.1. Marketing Strategy
                18.1.6.5.2. Product Strategy
                18.1.6.5.3. Channel Strategy
        18.1.7. Tekscan, Inc.
            18.1.7.1. Overview
            18.1.7.2. Product Portfolio
            18.1.7.3. Profitability by Market Segments
            18.1.7.4. Sales Footprint
            18.1.7.5. Strategy Overview
                18.1.7.5.1. Marketing Strategy
                18.1.7.5.2. Product Strategy
                18.1.7.5.3. Channel Strategy
        18.1.8. FUJIFILM Holdings America Corporation
            18.1.8.1. Overview
            18.1.8.2. Product Portfolio
            18.1.8.3. Profitability by Market Segments
            18.1.8.4. Sales Footprint
            18.1.8.5. Strategy Overview
                18.1.8.5.1. Marketing Strategy
                18.1.8.5.2. Product Strategy
                18.1.8.5.3. Channel Strategy
        18.1.9. GSI Technologies
            18.1.9.1. Overview
            18.1.9.2. Product Portfolio
            18.1.9.3. Profitability by Market Segments
            18.1.9.4. Sales Footprint
            18.1.9.5. Strategy Overview
                18.1.9.5.1. Marketing Strategy
                18.1.9.5.2. Product Strategy
                18.1.9.5.3. Channel Strategy
        18.1.10. PST sensors
            18.1.10.1. Overview
            18.1.10.2. Product Portfolio
            18.1.10.3. Profitability by Market Segments
            18.1.10.4. Sales Footprint
            18.1.10.5. Strategy Overview
                18.1.10.5.1. Marketing Strategy
                18.1.10.5.2. Product Strategy
                18.1.10.5.3. Channel Strategy
19. Assumptions & Acronyms Used
20. Research Methodology
Recommendations

Technology

Sensors Market

June 2023

REP-GB-272

315 pages

Explore Technology Insights

View Reports
Future Market Insights

Printed Sensors Market

Schedule a Call