Reports

- Global Locations -

Headquarters

Future Market Insights, Inc.

Christiana Corporate, 200
Continental Drive, Suite 401,
Newark, Delaware - 19713,
United States

T: +1-845-579-5705

Americas

Future Market Insights, Inc.

616 Corporate Way, Suite 2-9018,
Valley Cottage, NY 10989, United States

T: +1-347-918-3531

MEA

Future Market Insights

1602-6 Jumeirah Bay X2 Tower, Plot No: JLT-PH2-X2A,
Jumeirah Lakes Towers, Dubai,
United Arab Emirates

Europe

Future Market Insights

3rd Floor, 207 Regent Street,
W1B 3HH London
United Kingdom

T: + 44 (0) 20 8123 9659
D: +44 (0) 20 3287 4268

Asia Pacific

Future Market Insights

IndiaLand Global Tech Park, Unit UG-1, Behind Grand HighStreet, Phase 1, Hinjawadi, MH, Pune – 411057, India

Tibial Neuromodulation Devices Market Outlook (2022 to 2032)

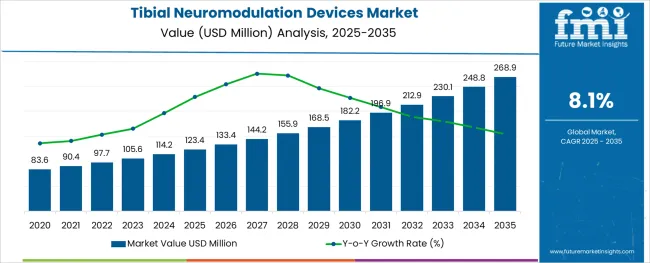
The sales of tibial neuromodulation devices are projected to rise at a CAGR of 8.1% during the forecast period 2022 to 2032. The global tibial neuromodulation devices market size is anticipated to be valued at US$ 97.7 Million in 2022 and is projected to surpass US$ 230.7 Million by 2032.

Rising urological illness incidence, increased demand for minimally invasive procedures, and outpatient usage are the factors driving tibial neuromodulation devices' market expansion over the projection period. The use of tibial neuromodulator devices is becoming more widespread, providing surgeons with the power, precision, and control required for soft or hard tissue, bone modulation.

High treatment costs and a lack of understanding about the devices and other treatment options available in the market are some of the factors affecting the demand for tibial neuromodulation devices.

Attribute Details
Tibial Neuromodulation Devices Market Value (2022) US$ 97.7 Million
Tibial Neuromodulation Devices Market Anticipated Value (2032) US$ 230.7 Million
Tibial Neuromodulation Devices Projected Growth Rate (2022 to 2032) 8.1%

Tibial neuromodulation devices work either by actively stimulating the neurons to cause a biological reaction or by directly applying for targeted pharmacological medicines in modest dosages to the area of action. Electrodes are applied to the spinal cord, brain, or peripheral nerves by neurostimulation devices.

The growing number of people suffering from ailments such as urine incontinence, Parkinson's disease, spinal cord damage, migraine, and epilepsy is driving the sales of tibial neuromodulation devices. The tibial neuromodulation devices market is also projected to benefit from increased awareness of neurodegenerative and neurological illnesses, as well as expanded application areas.

Growth opportunities in the tibial neuromodulation devices market include expanding market share through mergers and acquisitions and investing in new economies, as well as technological advancements in percutaneous tibial neuromodulation devices, which are driving the tibial neuromodulation devices market growth.

Don't pay for what you don't need

Customize your report by selecting specific countries or regions and save 30%!

What are the Growth Drivers for the Tibial Neuromodulation Devices Market?

The rising frequency of chronic conditions, combined with the limits of pharmaceutical medications in effectively treating these diseases, has propelled the demand for tibial neuromodulation devices. The functional capabilities of various nerves in the human body, as well as the consequences of electrical stimulation of these nerves for the therapy of various illnesses, have been continuously explored. As a result, new strategies and gadgets for addressing and treating chronic illnesses have emerged, boosting the tibial neuromodulation devices market growth.

These treatments range from spinal cord stimulation for pain relief to vagus nerve stimulation for epilepsy and other diseases. The tibial neuromodulation devices market is characterized by the introduction of specialized devices and methodologies to treat specific illnesses, as well as ongoing improvements in neurostimulation techniques.

A considerable proportion of patients suffering from chronic diseases such as chronic back pain, depression, epilepsy, and sleep apnea, among others, are resistant to treatment and drugs. Resistance is seen in the treatment's slow progression and delayed or limited consequences. As a result, healthcare professionals are moving their focus to neurostimulation approaches for chronic disease treatment, which is driving the sales of neuromodulation devices during the forecast period.

According to the Centers for Disease Control and Prevention (CDC), an estimated 50 million people in the United States suffer from chronic pain each year, with an additional 19 million suffering from severe chronic pain. Epilepsy, treatment-resistant depression, and other chronic illnesses impose a significant financial burden on countries. As a result, the tibial neuromodulation devices market share is anticipated to rise significantly during the forecast period.

What are the Driving Challenges in the Tibial Neuromodulation Devices Market?

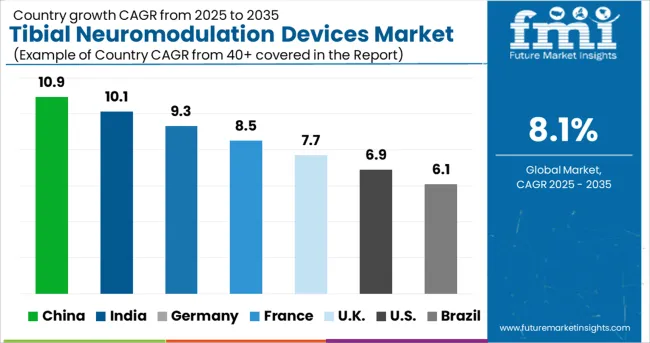
In growing countries such as China, Brazil, and India, the prevalence of neurological diseases such as epilepsy, depression, and others is increasing at a rapid pace. Despite a higher frequency, lower diagnostic rates in developing nations limit the number of individuals who require treatment. As a result of this, the sales of tibial neuromodulation devices are anticipated to decline over the forecast period.

Lower diagnosis rates in these nations are caused by a variety of causes, including a general lack of awareness and limited access to diagnostic facilities due to inadequate healthcare infrastructure. This is exacerbated by the fact that a percentage of the diagnosed population does not receive treatment for a variety of reasons. These are some of the primary factors restricting the number of patients receiving treatment, hence limiting the tibial neuromodulation devices market growth.
Sabyasachi Ghosh
Sabyasachi Ghosh

Principal Consultant

Talk to Analyst

Find your sweet spots for generating winning opportunities in this market.

Regional Analysis

How is the Performance of the North America Tibial Neuromodulation Devices Market?

North America is projected to hold 34.1% of the tibial neuromodulation devices market share during the forecast period. The primary reasons for the high demand for tibial neuromodulation devices in the region include higher rates of diagnosis and treatment among the patient population, as well as increased adoption of neuromodulation devices for the treatment of chronic illnesses. This is exacerbated by the larger prevalence of chronic illnesses in the United States, as well as suitable reimbursement regulations for these devices in the country.

What is the Growth Outlook for the Europe Tibial Neuromodulation Devices Market?

Europe is projected to dominate the tibial neuromodulation devices market with a share of 40.1% during the forecast period. Major factors propelling the tibial neuromodulation devices market share in Europe include a well-developed healthcare infrastructure, combined with an increase in non-invasive device approvals in the region. As a result of these factors, the sales of tibial neuromodulation devices are projected to grow rapidly from 2022 to 2032.

From 2022 to 2032, new entrants and regional players are projected to get their CE mark approvals for their non-invasive devices which is further expected to boost the tibial neuromodulation devices market growth in Europe.

Start-up Ecosystem

How are New Entrants Revolutionizing the Tibial Neuromodulation Devices Market?

The start-up ecosystem in the tibial neuromodulation devices market is moderate with a few startups conducting clinical trials to determine the therapeutic efficacy of their products. Deep Brain Innovations LLC, Scion NeuroStim, and ALEVA NEUROTHERAPEUTICS SA are some of the startups in the tibial neuromodulation devices market.
Get the data you need at a Fraction of the cost

Personalize your report by choosing insights you need
and save 40%!

Competitive Landscape

Who are some of the Key Market Players in the Tibial Neuromodulation Devices Market?

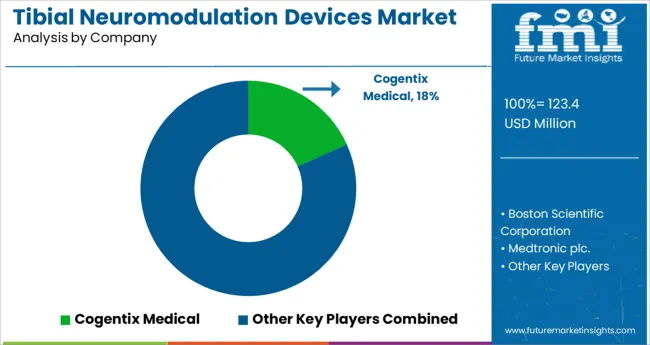
The neuromodulation devices market is consolidated, with the top four firms accounting for more than 90% of the market in 2022. Medtronic's extensive portfolio, along with strong brand awareness, widespread regional presence, and a solid distribution network, is responsible for propelling the business to market leadership in 2022.

The key market players profiled in the report include Cogentix Medical, Palex Medical SA, and Medtronic plc. Rainbow Medical Group. The key players in this market adopted product launch, partnership, and expansion as their key strategies to meet the changing consumer demands.

Recent Developments in the Tibial Neuromodulation Devices Market:

  • ElectroCore Inc., a commercial-stage medical device startup, acquired US FDA approval for their gammaCore non-invasive vagus nerve stimulation (nVNS) device in November 2018. In the United States, the device was approved as an additional therapy for the treatment of cluster headaches.
  • SenTiva, a vagus nerve stimulation device from LivaNova PLC, was approved by the US Food and Drug Administration in October 2017 for the treatment of epilepsy. The gadget is approved for drug-resistant epilepsy patients over the age of four.

Report Scope

Report Attribute Details
Growth Rate CAGR of 8.1% from 2022 to 2032
Base Year for Estimation 2022
Historical Data 2016 to 2021
Forecast Period 2022 to 2032
Quantitative Units Revenue in US$ million and CAGR from 2022 to 2032
Report Coverage Revenue Forecast, Volume Forecast, Company Ranking, Competitive Landscape, Growth Factors, Trends, and Pricing Analysis
Segments Covered
  • Application
  • End-User
  • Region
Regions Covered
  • North America
  • Latin America
  • Europe
  • East Asia
  • South Asia
  • Oceania
  • Middle East and Africa
Key Countries Profiled
  • United States of America
  • Canada
  • Brazil
  • Argentina
  • Germany
  • United Kingdom
  • France
  • Spain
  • Italy
  • Nordics
  • BENELUX
  • Australia & New Zealand
  • China
  • India
  • ASIAN
  • GCC Countries
  • South Africa
Key Companies Profiled Cogentix Medical, Palex Medical SA, Medtronic plc. Rainbow Medical Group.
Customization Available Upon Request

Key Market Segments in the Tibial Neuromodulation Devices Market

By Application:

  • Faecal Incontinence
  • Overactive Bladder

By End User:

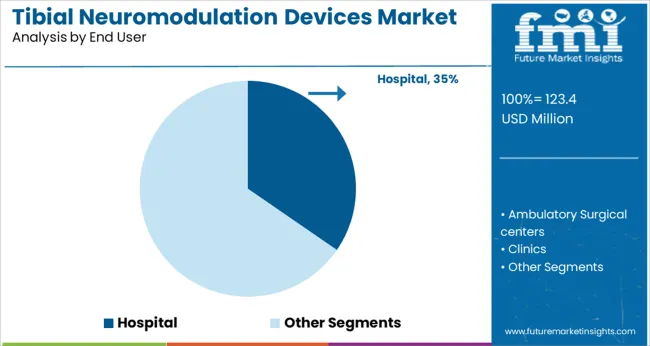
  • Hospital
  • Ambulatory Surgical centers
  • Clinics
  • Specialty Care Unit
  • Others

By Region:

  • North America
  • Latin America
  • Asia Pacific
  • Middle East and Africa (MEA)
  • Europe

Frequently Asked Questions

What is the Growth Outlook for the Tibial Neuromodulation Devices Market?

The tibial neuromodulation devices market is predicted to register a CAGR of 8.1 % from 2022 to 2032.

Which Region Leads the Tibial Neuromodulation Devices Market?

Europe region is anticipated to lead the tibial neuromodulation devices market during the forecast period.

How much Growth Potential does the Tibial Neuromodulation Devices Market hold?

The tibial neuromodulation devices market is likely to hold a valuation of US$ 230.7 Million by 2032.

Which Application Segment dominates the Tibial Neuromodulation Devices Market?

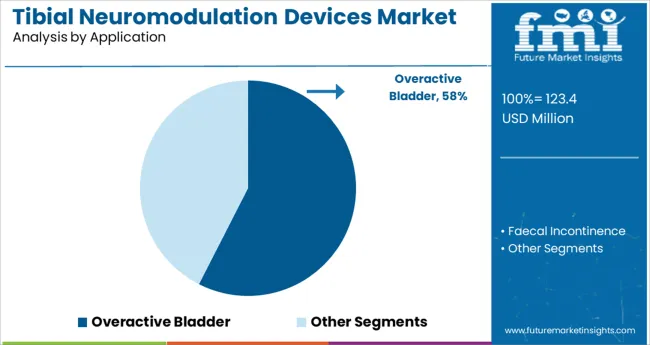
Based on application, the overactive bladder segment dominates the tibial neuromodulation devices market.

Table of Content

1. Executive Summary | Tibial Neuromodulation Devices Market

    1.1. Global Market Outlook

    1.2. Demand-side Trends

    1.3. Supply-side Trends

    1.4. Technology Roadmap Analysis

    1.5. Analysis and Recommendations

2. Market Overview

    2.1. Market Coverage / Taxonomy

    2.2. Market Definition / Scope / Limitations

3. Market Background

    3.1. Market Dynamics

        3.1.1. Drivers

        3.1.2. Restraints

        3.1.3. Opportunity

        3.1.4. Trends

    3.2. Scenario Forecast

        3.2.1. Demand in Optimistic Scenario

        3.2.2. Demand in Likely Scenario

        3.2.3. Demand in Conservative Scenario

    3.3. Opportunity Map Analysis

    3.4. Investment Feasibility Matrix

    3.5. PESTLE and Porter’s Analysis

    3.6. Regulatory Landscape

        3.6.1. By Key Regions

        3.6.2. By Key Countries

    3.7. Regional Parent Market Outlook

4. Global Market Analysis 2017 to 2021 and Forecast, 2022 to 2032

    4.1. Historical Market Size Value (US$ Million) Analysis, 2017 to 2021

    4.2. Current and Future Market Size Value (US$ Million) Projections, 2022 to 2032

        4.2.1. Y-o-Y Growth Trend Analysis

        4.2.2. Absolute $ Opportunity Analysis

5. Global Market Analysis 2017 to 2021 and Forecast 2022 to 2032, By Application

    5.1. Introduction / Key Findings

    5.2. Historical Market Size Value (US$ Million) Analysis By Application, 2017 to 2021

    5.3. Current and Future Market Size Value (US$ Million) Analysis and Forecast By Application, 2022 to 2032

        5.3.1. Faecal Incontinence

        5.3.2. Overactive Bladder

    5.4. Y-o-Y Growth Trend Analysis By Application, 2017 to 2021

    5.5. Absolute $ Opportunity Analysis By Application, 2022 to 2032

6. Global Market Analysis 2017 to 2021 and Forecast 2022 to 2032, By End User

    6.1. Introduction / Key Findings

    6.2. Historical Market Size Value (US$ Million) Analysis By End User, 2017 to 2021

    6.3. Current and Future Market Size Value (US$ Million) Analysis and Forecast By End User, 2022 to 2032

        6.3.1. Hospital

        6.3.2. Ambulatory Surgical Centers

        6.3.3. Clinics

        6.3.4. Specialty Care Value (US$ Million)

    6.4. Y-o-Y Growth Trend Analysis By End User, 2017 to 2021

    6.5. Absolute $ Opportunity Analysis By End User, 2022 to 2032

7. Global Market Analysis 2017 to 2021 and Forecast 2022 to 2032, By Region

    7.1. Introduction

    7.2. Historical Market Size Value (US$ Million) Analysis By Region, 2017 to 2021

    7.3. Current Market Size Value (US$ Million) Analysis and Forecast By Region, 2022 to 2032

        7.3.1. North America

        7.3.2. Latin America

        7.3.3. Europe

        7.3.4. Asia Pacific

        7.3.5. Middle East and Africa

    7.4. Market Attractiveness Analysis By Region

8. North America Market Analysis 2017 to 2021 and Forecast 2022 to 2032, By Country

    8.1. Historical Market Size Value (US$ Million) Trend Analysis By Market Taxonomy, 2017 to 2021

    8.2. Market Size Value (US$ Million) Forecast By Market Taxonomy, 2022 to 2032

        8.2.1. By Country

            8.2.1.1. United States of America

            8.2.1.2. Canada

        8.2.2. By Application

        8.2.3. By End User

    8.3. Market Attractiveness Analysis

        8.3.1. By Country

        8.3.2. By Application

        8.3.3. By End User

    8.4. Key Takeaways

9. Latin America Market Analysis 2017 to 2021 and Forecast 2022 to 2032, By Country

    9.1. Historical Market Size Value (US$ Million) Trend Analysis By Market Taxonomy, 2017 to 2021

    9.2. Market Size Value (US$ Million) Forecast By Market Taxonomy, 2022 to 2032

        9.2.1. By Country

            9.2.1.1. Brazil

            9.2.1.2. Mexico

            9.2.1.3. Rest of Latin America

        9.2.2. By Application

        9.2.3. By End User

    9.3. Market Attractiveness Analysis

        9.3.1. By Country

        9.3.2. By Application

        9.3.3. By End User

    9.4. Key Takeaways

10. Europe Market Analysis 2017 to 2021 and Forecast 2022 to 2032, By Country

    10.1. Historical Market Size Value (US$ Million) Trend Analysis By Market Taxonomy, 2017 to 2021

    10.2. Market Size Value (US$ Million) Forecast By Market Taxonomy, 2022 to 2032

        10.2.1. By Country

            10.2.1.1. Germany

            10.2.1.2. United Kingdom

            10.2.1.3. France

            10.2.1.4. Spain

            10.2.1.5. Italy

            10.2.1.6. Rest of Europe

        10.2.2. By Application

        10.2.3. By End User

    10.3. Market Attractiveness Analysis

        10.3.1. By Country

        10.3.2. By Application

        10.3.3. By End User

    10.4. Key Takeaways

11. Asia Pacific Market Analysis 2017 to 2021 and Forecast 2022 to 2032, By Country

    11.1. Historical Market Size Value (US$ Million) Trend Analysis By Market Taxonomy, 2017 to 2021

    11.2. Market Size Value (US$ Million) Forecast By Market Taxonomy, 2022 to 2032

        11.2.1. By Country

            11.2.1.1. China

            11.2.1.2. Japan

            11.2.1.3. South Korea

            11.2.1.4. India

            11.2.1.5. Malaysia

            11.2.1.6. Singapore

            11.2.1.7. Australia

            11.2.1.8. New Zealand

            11.2.1.9. Rest of United States of America

        11.2.2. By Application

        11.2.3. By End User

    11.3. Market Attractiveness Analysis

        11.3.1. By Country

        11.3.2. By Application

        11.3.3. By End User

    11.4. Key Takeaways

12. Middle East and Africa Market Analysis 2017 to 2021 and Forecast 2022 to 2032, By Country

    12.1. Historical Market Size Value (US$ Million) Trend Analysis By Market Taxonomy, 2017 to 2021

    12.2. Market Size Value (US$ Million) Forecast By Market Taxonomy, 2022 to 2032

        12.2.1. By Country

            12.2.1.1. GCC Countries

            12.2.1.2. South Africa

            12.2.1.3. Israel

            12.2.1.4. Rest of Middle East and Africa

        12.2.2. By Application

        12.2.3. By End User

    12.3. Market Attractiveness Analysis

        12.3.1. By Country

        12.3.2. By Application

        12.3.3. By End User

    12.4. Key Takeaways

13. Key Countries Market Analysis

    13.1. United States of America

        13.1.1. Pricing Analysis

        13.1.2. Market Share Analysis, 2021

            13.1.2.1. By Application

            13.1.2.2. By End User

    13.2. Canada

        13.2.1. Pricing Analysis

        13.2.2. Market Share Analysis, 2021

            13.2.2.1. By Application

            13.2.2.2. By End User

    13.3. Brazil

        13.3.1. Pricing Analysis

        13.3.2. Market Share Analysis, 2021

            13.3.2.1. By Application

            13.3.2.2. By End User

    13.4. Mexico

        13.4.1. Pricing Analysis

        13.4.2. Market Share Analysis, 2021

            13.4.2.1. By Application

            13.4.2.2. By End User

    13.5. Germany

        13.5.1. Pricing Analysis

        13.5.2. Market Share Analysis, 2021

            13.5.2.1. By Application

            13.5.2.2. By End User

    13.6. United Kingdom

        13.6.1. Pricing Analysis

        13.6.2. Market Share Analysis, 2021

            13.6.2.1. By Application

            13.6.2.2. By End User

    13.7. France

        13.7.1. Pricing Analysis

        13.7.2. Market Share Analysis, 2021

            13.7.2.1. By Application

            13.7.2.2. By End User

    13.8. Spain

        13.8.1. Pricing Analysis

        13.8.2. Market Share Analysis, 2021

            13.8.2.1. By Application

            13.8.2.2. By End User

    13.9. Italy

        13.9.1. Pricing Analysis

        13.9.2. Market Share Analysis, 2021

            13.9.2.1. By Application

            13.9.2.2. By End User

    13.10. China

        13.10.1. Pricing Analysis

        13.10.2. Market Share Analysis, 2021

            13.10.2.1. By Application

            13.10.2.2. By End User

    13.11. Japan

        13.11.1. Pricing Analysis

        13.11.2. Market Share Analysis, 2021

            13.11.2.1. By Application

            13.11.2.2. By End User

    13.12. South Korea

        13.12.1. Pricing Analysis

        13.12.2. Market Share Analysis, 2021

            13.12.2.1. By Application

            13.12.2.2. By End User

    13.13. Malaysia

        13.13.1. Pricing Analysis

        13.13.2. Market Share Analysis, 2021

            13.13.2.1. By Application

            13.13.2.2. By End User

    13.14. Singapore

        13.14.1. Pricing Analysis

        13.14.2. Market Share Analysis, 2021

            13.14.2.1. By Application

            13.14.2.2. By End User

    13.15. Australia

        13.15.1. Pricing Analysis

        13.15.2. Market Share Analysis, 2021

            13.15.2.1. By Application

            13.15.2.2. By End User

    13.16. New Zealand

        13.16.1. Pricing Analysis

        13.16.2. Market Share Analysis, 2021

            13.16.2.1. By Application

            13.16.2.2. By End User

    13.17. GCC Countries

        13.17.1. Pricing Analysis

        13.17.2. Market Share Analysis, 2021

            13.17.2.1. By Application

            13.17.2.2. By End User

    13.18. South Africa

        13.18.1. Pricing Analysis

        13.18.2. Market Share Analysis, 2021

            13.18.2.1. By Application

            13.18.2.2. By End User

    13.19. Israel

        13.19.1. Pricing Analysis

        13.19.2. Market Share Analysis, 2021

            13.19.2.1. By Application

            13.19.2.2. By End User

14. Market Structure Analysis

    14.1. Competition Dashboard

    14.2. Competition Benchmarking

    14.3. Market Share Analysis of Top Players

        14.3.1. By Regional

        14.3.2. By Application

        14.3.3. By End User

15. Competition Analysis

    15.1. Competition Deep Dive

        15.1.1. Cogentix Medical

            15.1.1.1. Overview

            15.1.1.2. Product Portfolio

            15.1.1.3. Profitability by Market Segments

            15.1.1.4. Sales Footprint

            15.1.1.5. Strategy Overview

                15.1.1.5.1. Marketing Strategy

        15.1.2. Palex Medical SA

            15.1.2.1. Overview

            15.1.2.2. Product Portfolio

            15.1.2.3. Profitability by Market Segments

            15.1.2.4. Sales Footprint

            15.1.2.5. Strategy Overview

                15.1.2.5.1. Marketing Strategy

        15.1.3. Medtronic plc.

            15.1.3.1. Overview

            15.1.3.2. Product Portfolio

            15.1.3.3. Profitability by Market Segments

            15.1.3.4. Sales Footprint

            15.1.3.5. Strategy Overview

                15.1.3.5.1. Marketing Strategy

        15.1.4. Rainbow Medical Group

            15.1.4.1. Overview

            15.1.4.2. Product Portfolio

            15.1.4.3. Profitability by Market Segments

            15.1.4.4. Sales Footprint

            15.1.4.5. Strategy Overview

                15.1.4.5.1. Marketing Strategy

        15.1.5. Boston Scientific Corporation

            15.1.5.1. Overview

            15.1.5.2. Product Portfolio

            15.1.5.3. Profitability by Market Segments

            15.1.5.4. Sales Footprint

            15.1.5.5. Strategy Overview

                15.1.5.5.1. Marketing Strategy

        15.1.6. Synapse Biomedical, Inc.

            15.1.6.1. Overview

            15.1.6.2. Product Portfolio

            15.1.6.3. Profitability by Market Segments

            15.1.6.4. Sales Footprint

            15.1.6.5. Strategy Overview

                15.1.6.5.1. Marketing Strategy

        15.1.7. NeuroSigma

            15.1.7.1. Overview

            15.1.7.2. Product Portfolio

            15.1.7.3. Profitability by Market Segments

            15.1.7.4. Sales Footprint

            15.1.7.5. Strategy Overview

                15.1.7.5.1. Marketing Strategy

        15.1.8. Nevro Corporation

            15.1.8.1. Overview

            15.1.8.2. Product Portfolio

            15.1.8.3. Profitability by Market Segments

            15.1.8.4. Sales Footprint

            15.1.8.5. Strategy Overview

                15.1.8.5.1. Marketing Strategy

        15.1.9. Neuronetics

            15.1.9.1. Overview

            15.1.9.2. Product Portfolio

            15.1.9.3. Profitability by Market Segments

            15.1.9.4. Sales Footprint

            15.1.9.5. Strategy Overview

                15.1.9.5.1. Marketing Strategy

16. Assumptions & Acronyms Used

17. Research Methodology

Don't pay for what you don't need

Customize your report by selecting specific countries or regions and save 30%!

List of Tables

Table 1: Global Market Value (US$ Million) Forecast by Region, 2017 to 2032

Table 2: Global Market Value (US$ Million) Forecast by Application, 2017 to 2032

Table 3: Global Market Value (US$ Million) Forecast by End User, 2017 to 2032

Table 4: North America Market Value (US$ Million) Forecast by Country, 2017 to 2032

Table 5: North America Market Value (US$ Million) Forecast by Application, 2017 to 2032

Table 6: North America Market Value (US$ Million) Forecast by End User, 2017 to 2032

Table 7: Latin America Market Value (US$ Million) Forecast by Country, 2017 to 2032

Table 8: Latin America Market Value (US$ Million) Forecast by Application, 2017 to 2032

Table 9: Latin America Market Value (US$ Million) Forecast by End User, 2017 to 2032

Table 10: Europe Market Value (US$ Million) Forecast by Country, 2017 to 2032

Table 11: Europe Market Value (US$ Million) Forecast by Application, 2017 to 2032

Table 12: Europe Market Value (US$ Million) Forecast by End User, 2017 to 2032

Table 13: Asia Pacific Market Value (US$ Million) Forecast by Country, 2017 to 2032

Table 14: Asia Pacific Market Value (US$ Million) Forecast by Application, 2017 to 2032

Table 15: Asia Pacific Market Value (US$ Million) Forecast by End User, 2017 to 2032

Table 16: Middle East and Africa Market Value (US$ Million) Forecast by Country, 2017 to 2032

Table 17: Middle East and Africa Market Value (US$ Million) Forecast by Application, 2017 to 2032

Table 18: Middle East and Africa Market Value (US$ Million) Forecast by End User, 2017 to 2032
Sabyasachi Ghosh
Sabyasachi Ghosh

Principal Consultant

Talk to Analyst

Find your sweet spots for generating winning opportunities in this market.

List of Charts

Figure 1: Global Market Value (US$ Million) by Application, 2022 to 2032

Figure 2: Global Market Value (US$ Million) by End User, 2022 to 2032

Figure 3: Global Market Value (US$ Million) by Region, 2022 to 2032

Figure 4: Global Market Value (US$ Million) Analysis by Region, 2017 to 2032

Figure 5: Global Market Value Share (%) and BPS Analysis by Region, 2022 to 2032

Figure 6: Global Market Y-o-Y Growth (%) Projections by Region, 2022 to 2032

Figure 7: Global Market Value (US$ Million) Analysis by Application, 2017 to 2032

Figure 8: Global Market Value Share (%) and BPS Analysis by Application, 2022 to 2032

Figure 9: Global Market Y-o-Y Growth (%) Projections by Application, 2022 to 2032

Figure 10: Global Market Value (US$ Million) Analysis by End User, 2017 to 2032

Figure 11: Global Market Value Share (%) and BPS Analysis by End User, 2022 to 2032

Figure 12: Global Market Y-o-Y Growth (%) Projections by End User, 2022 to 2032

Figure 13: Global Market Attractiveness by Application, 2022 to 2032

Figure 14: Global Market Attractiveness by End User, 2022 to 2032

Figure 15: Global Market Attractiveness by Region, 2022 to 2032

Figure 16: North America Market Value (US$ Million) by Application, 2022 to 2032

Figure 17: North America Market Value (US$ Million) by End User, 2022 to 2032

Figure 18: North America Market Value (US$ Million) by Country, 2022 to 2032

Figure 19: North America Market Value (US$ Million) Analysis by Country, 2017 to 2032

Figure 20: North America Market Value Share (%) and BPS Analysis by Country, 2022 to 2032

Figure 21: North America Market Y-o-Y Growth (%) Projections by Country, 2022 to 2032

Figure 22: North America Market Value (US$ Million) Analysis by Application, 2017 to 2032

Figure 23: North America Market Value Share (%) and BPS Analysis by Application, 2022 to 2032

Figure 24: North America Market Y-o-Y Growth (%) Projections by Application, 2022 to 2032

Figure 25: North America Market Value (US$ Million) Analysis by End User, 2017 to 2032

Figure 26: North America Market Value Share (%) and BPS Analysis by End User, 2022 to 2032

Figure 27: North America Market Y-o-Y Growth (%) Projections by End User, 2022 to 2032

Figure 28: North America Market Attractiveness by Application, 2022 to 2032

Figure 29: North America Market Attractiveness by End User, 2022 to 2032

Figure 30: North America Market Attractiveness by Country, 2022 to 2032

Figure 31: Latin America Market Value (US$ Million) by Application, 2022 to 2032

Figure 32: Latin America Market Value (US$ Million) by End User, 2022 to 2032

Figure 33: Latin America Market Value (US$ Million) by Country, 2022 to 2032

Figure 34: Latin America Market Value (US$ Million) Analysis by Country, 2017 to 2032

Figure 35: Latin America Market Value Share (%) and BPS Analysis by Country, 2022 to 2032

Figure 36: Latin America Market Y-o-Y Growth (%) Projections by Country, 2022 to 2032

Figure 37: Latin America Market Value (US$ Million) Analysis by Application, 2017 to 2032

Figure 38: Latin America Market Value Share (%) and BPS Analysis by Application, 2022 to 2032

Figure 39: Latin America Market Y-o-Y Growth (%) Projections by Application, 2022 to 2032

Figure 40: Latin America Market Value (US$ Million) Analysis by End User, 2017 to 2032

Figure 41: Latin America Market Value Share (%) and BPS Analysis by End User, 2022 to 2032

Figure 42: Latin America Market Y-o-Y Growth (%) Projections by End User, 2022 to 2032

Figure 43: Latin America Market Attractiveness by Application, 2022 to 2032

Figure 44: Latin America Market Attractiveness by End User, 2022 to 2032

Figure 45: Latin America Market Attractiveness by Country, 2022 to 2032

Figure 46: Europe Market Value (US$ Million) by Application, 2022 to 2032

Figure 47: Europe Market Value (US$ Million) by End User, 2022 to 2032

Figure 48: Europe Market Value (US$ Million) by Country, 2022 to 2032

Figure 49: Europe Market Value (US$ Million) Analysis by Country, 2017 to 2032

Figure 50: Europe Market Value Share (%) and BPS Analysis by Country, 2022 to 2032

Figure 51: Europe Market Y-o-Y Growth (%) Projections by Country, 2022 to 2032

Figure 52: Europe Market Value (US$ Million) Analysis by Application, 2017 to 2032

Figure 53: Europe Market Value Share (%) and BPS Analysis by Application, 2022 to 2032

Figure 54: Europe Market Y-o-Y Growth (%) Projections by Application, 2022 to 2032

Figure 55: Europe Market Value (US$ Million) Analysis by End User, 2017 to 2032

Figure 56: Europe Market Value Share (%) and BPS Analysis by End User, 2022 to 2032

Figure 57: Europe Market Y-o-Y Growth (%) Projections by End User, 2022 to 2032

Figure 58: Europe Market Attractiveness by Application, 2022 to 2032

Figure 59: Europe Market Attractiveness by End User, 2022 to 2032

Figure 60: Europe Market Attractiveness by Country, 2022 to 2032

Figure 61: Asia Pacific Market Value (US$ Million) by Application, 2022 to 2032

Figure 62: Asia Pacific Market Value (US$ Million) by End User, 2022 to 2032

Figure 63: Asia Pacific Market Value (US$ Million) by Country, 2022 to 2032

Figure 64: Asia Pacific Market Value (US$ Million) Analysis by Country, 2017 to 2032

Figure 65: Asia Pacific Market Value Share (%) and BPS Analysis by Country, 2022 to 2032

Figure 66: Asia Pacific Market Y-o-Y Growth (%) Projections by Country, 2022 to 2032

Figure 67: Asia Pacific Market Value (US$ Million) Analysis by Application, 2017 to 2032

Figure 68: Asia Pacific Market Value Share (%) and BPS Analysis by Application, 2022 to 2032

Figure 69: Asia Pacific Market Y-o-Y Growth (%) Projections by Application, 2022 to 2032

Figure 70: Asia Pacific Market Value (US$ Million) Analysis by End User, 2017 to 2032

Figure 71: Asia Pacific Market Value Share (%) and BPS Analysis by End User, 2022 to 2032

Figure 72: Asia Pacific Market Y-o-Y Growth (%) Projections by End User, 2022 to 2032

Figure 73: Asia Pacific Market Attractiveness by Application, 2022 to 2032

Figure 74: Asia Pacific Market Attractiveness by End User, 2022 to 2032

Figure 75: Asia Pacific Market Attractiveness by Country, 2022 to 2032

Figure 76: Middle East and Africa Market Value (US$ Million) by Application, 2022 to 2032

Figure 77: Middle East and Africa Market Value (US$ Million) by End User, 2022 to 2032

Figure 78: Middle East and Africa Market Value (US$ Million) by Country, 2022 to 2032

Figure 79: Middle East and Africa Market Value (US$ Million) Analysis by Country, 2017 to 2032

Figure 80: Middle East and Africa Market Value Share (%) and BPS Analysis by Country, 2022 to 2032

Figure 81: Middle East and Africa Market Y-o-Y Growth (%) Projections by Country, 2022 to 2032

Figure 82: Middle East and Africa Market Value (US$ Million) Analysis by Application, 2017 to 2032

Figure 83: Middle East and Africa Market Value Share (%) and BPS Analysis by Application, 2022 to 2032

Figure 84: Middle East and Africa Market Y-o-Y Growth (%) Projections by Application, 2022 to 2032

Figure 85: Middle East and Africa Market Value (US$ Million) Analysis by End User, 2017 to 2032

Figure 86: Middle East and Africa Market Value Share (%) and BPS Analysis by End User, 2022 to 2032

Figure 87: Middle East and Africa Market Y-o-Y Growth (%) Projections by End User, 2022 to 2032

Figure 88: Middle East and Africa Market Attractiveness by Application, 2022 to 2032

Figure 89: Middle East and Africa Market Attractiveness by End User, 2022 to 2032

Figure 90: Middle East and Africa Market Attractiveness by Country, 2022 to 2032

Recommendations

Healthcare

Osteotomy Plates Market

Published : July 2023

Healthcare

Osteonecrosis Treatment Market

Published : July 2023

Healthcare

High Tibial Osteotomy (HTO) Plates Market

Published : April 2023

Explore Healthcare Insights

View Reports

Tibial Neuromodulation Devices Market