Reports
- Global Locations -
Headquarters
Future Market Insights, Inc.
Christiana Corporate, 200
Continental Drive, Suite 401,
Newark, Delaware - 19713,
United States
Americas
Future Market Insights, Inc.
616 Corporate Way, Suite 2-9018,
Valley Cottage, NY 10989, United States
MEA
Future Market Insights
1602-6 Jumeirah Bay X2 Tower, Plot No: JLT-PH2-X2A,
Jumeirah Lakes Towers, Dubai,
United Arab Emirates
Europe
Future Market Insights
3rd Floor, 207 Regent Street,
W1B 3HH London
United Kingdom
Asia Pacific
Future Market Insights
Office No. 401-A, 4th Floor,
VANTAGE 9, S.No. 36/1/1,
Baner, Pune 411045, India
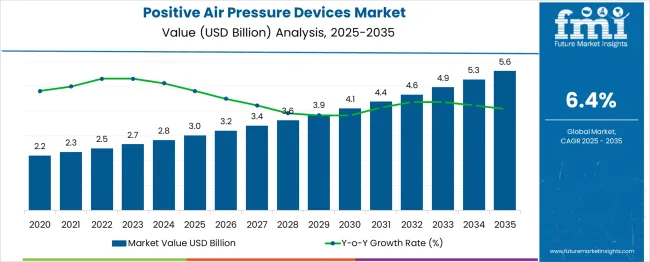
[215 Pages Report] The global positive air pressure devices market size reached US$ 2.3 Billion in 2021 and is expected to enjoy a valuation of US$ 2.5 Billion by the end of 2022. Furthermore, with rising usage for treating medical conditions like sleep apnea and respiratory failures, the overall demand for positive air pressure devices is poised to grow at a CAGR of 6.4% between 2022 and 2032, surpassing a market valuation of US$ 4.7 Billion by 2032.
Based on product, the continuous positive airways pressure devices (CPAP) segment dominated the global positive air pressure devices market with a share of about 71.4% in 2021 and it is likely to retain its dominance even during the forecast period.
Attribute | Key Statistics |
---|---|
Positive Air Pressure Devices Market Base Value (2021) | US$ 2.3 Billion |
Estimated Market Value (2022) | US$ 2.5 Billion |
Projected Market Value (2032) | US$ 4.7 Billion |
Value-based CAGR (2022 to 2032) | 6.4% |
Market Share of Top 5 Countries | 55.5% |
A mechanical ventilator is a device that assists a patient in breathing (ventilating) during surgery or when they are unable to do so due to a serious disease. Until patients recover enough to no longer require it, a mechanical ventilator is used to reduce the work of breathing. The device guarantees that the body gets enough oxygen and that carbon dioxide is expelled. When some conditions or airway obstructions make it impossible to breathe normally, the usage of mechanical ventilation devices like positive air pressure devices becomes necessary.
A machine is used in positive airway pressure (PAP) treatment to drive air into the lungs' airways under pressure. This keeps the upper airway open while you're sleeping. People with sleep apnea and other breathing difficulties are protected against bouts of airway collapse by the forceful air given by continuous positive airway pressure.
The main elements that support the use of mechanical ventilators include technological breakthroughs such as significant advancement in the field of positive airway pressure (PAP) systems and improvements in the battery life of transportation and portable devices.
Similarly, the rising prevalence of sleep apnea and other breathing disorders across the globe is expected to act as a catalyst triggering growth in the global positive air pressure devices market during the forecast period.
Positive air pressure devices are being extensively used in the treatment of sleep apnea, critically ill patients in hospitals with respiratory failure, and newborn infants, and for the prevention and treatment of atelectasis in patients with difficulty taking deep breaths.
The overall positive air pressure devices market formed approximately 42.1% value share of the global mechanical ventilation market which stood at ~US$ 5.6 Billion in 2021.
Don't pay for what you don't need
Customize your report by selecting specific countries or regions and save 30%!
The global sales of positive air pressure devices are poised to grow at 6.4% CAGR between 2022 and 2032, in comparison to the 5.7% CAGR registered during the historical period from 2012 to 2021. Increasing demand for positive air pressure devices due to the rising prevalence of sleep disorders and breathing failures including obstructive sleep apnea and COPD is a key factor driving the global market.
The positive airway pressure (PAP) devices market is expanding primarily due to the steadily rising number of patients with obesity, respiratory illnesses, and sleep difficulties. There is significant data, especially from demographics in Western nations, that suggests that average sleep length is declining and that insomnia and other sleep disruptions are becoming more and more common.
Insomnia affects more than 20% of adults overall in Canada and the USA, according to data from National Surveys, and it is predicted that this percentage will rise over the coming decades. These percentages are in line with the prevalence rates of short sleep duration revealed in population-based research conducted over the previous three decades in several Western countries.
Similarly, according to the National Library of Medicine, obstructive sleep apnea affects around 1 billion persons worldwide. This is acting as a catalyst triggering the growth of the global positive air pressure devices market.
In addition to this, the growing popularity of home healthcare and increasing health awareness will create lucrative growth opportunities for positive air pressure device manufacturers during the assessment period.
Rising Prevalence of Sleep Disorders and Respiratory Diseases to foster Growth of Positive Air Pressure Devices Market
The global positive air pressure devices market is anticipated to grow at a healthy pace during the projected period, owing to the rising prevalence of various sleep disorders and respiratory diseases across the world.
Chronic obstructive pulmonary disease (COPD), which claimed 3.23 million lives in 2019, is the third most common cause of death globally, according to the World Health Organization. In low- and middle-income nations, COPD fatalities in people under 70 years of age account for about 90% of all mortality.
According to the National Center for Biotechnology Information, undertaking positive airway pressure therapy was linked to a decrease in hospitalization among patients with chronic obstructive pulmonary disease. Thus, the growing usage of positive airway pressure therapy for treating patients suffering from COPD will continue to boost sales of positive air pressure devices in the market.
Similarly, numerous studies conducted around the world have revealed that 10%-30% of people suffer from insomnia, with some estimates reaching 50%-60%. Reduced social functioning and a lower quality of life, neurocognitive impairment, an elevated incidence of traffic accidents, cerebral, cardiac, and metabolic morbidity, as well as a higher death rate, are all long-term effects of Obstructive sleep apnea syndrome.
The use of continuous positive airway pressure (CPAP) therapy for middle-aged individuals with moderate to severe OSA syndrome has been proven to be both effective and affordable. The prevalence of apnea syndrome is higher in older adults (over 60), and the effects can be confused with the functional decline associated with aging. Therefore, correcting the OSA syndrome element of any functional impairment should boost independence and lower healthcare expenses in aging populations.
Most people with obstructive sleep apnea continue to receive treatment with positive airway pressure (PAP). For patients with uncomplicated OSA sleep disorders, CPAP, APAP, and BPAP are all acceptable treatments that can be utilized across the severity continuum of the condition. Driven by this, demand for positive air pressure devices is likely to rise at a strong pace over the next ten years.
Also, the constant introduction of new features created to adapt to the requirements of diverse patients is supposed to drive the market for positive air pressure devices in the forecast period.
There are some side effects of CPAP treatment, such as congestion, runny nose, and dry mouth; humidification can frequently help with these symptoms. Many patients initially find the mask inconvenient, claustrophobic, or embarrassing. Masks have the potential to irritate or cause the skin to become red.
Even though CPAP therapy has several advantages, compliance is still a significant issue both in the inpatient and outpatient settings.
Since these devices are also available on an online and at-home basis, a decrease in diagnostic and therapeutic procedures at sleep clinics can directly impact the number of sleep apnea tests, which can limit the development of a positive air pressure equipment market.
Also, these operations may have a major impact on the transmission rate of diseases, which can delay elective procedures, disrupt the supply chain for services, and can limit the ability of healthcare facilities to generate income.
Increasing Incidence of Sleep Apnea Pushing Demand in the USA
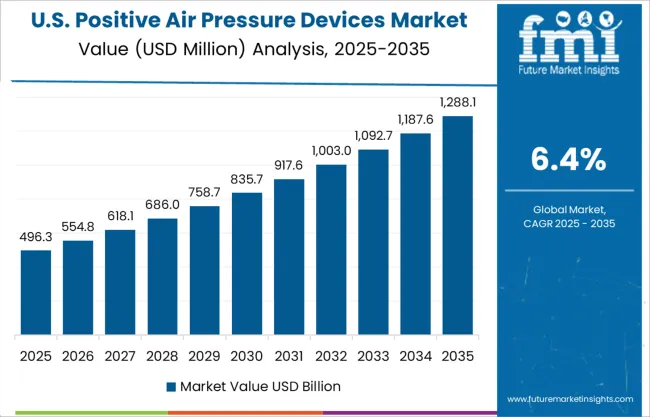
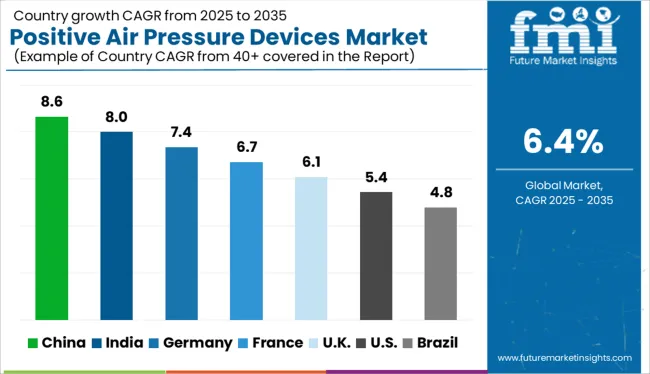
As per FMI, the USA will continue to dominate the global positive air pressure devices market during the forecast period, accounting for the largest market share of around 24.8% in 2022. Growth in the USA positive air pressure devices market is driven by the rising prevalence of sleep apnea and breathing disorders, high levels of healthcare awareness among people, and the growing popularity of home healthcare.
Similarly, the presence of leading medical device manufacturers, favorable reimbursement policies, and increased demand for positive air pressure machines are expected to boost the market in the country during the forecast period.
Over the years, there has been a sharp rise in the cases of sleep apnea across the USA which has generated enormous demand for medical devices like positive air pressure devices and the trend is likely to continue during the forecast period. For instance, as per the American Sleep Apnea Foundation, around 25 million Americans suffer from sleep apnea and the number is expected to further rise during the upcoming years.
Availability of Advanced Products Driving Market in Germany
Germany is estimated to hold a market share of 8.1% in the global positive air pressure devices market in 2022 and is further expected to grow at a healthy pace during the next ten years. Growth in the positive air pressure devices market in Germany is expanding as a result of well-defined regulatory rules and rising investments in research and development for new devices.
Similarly, the increasing prevalence of respiratory failures, flourishing medical tourism, and easy availability of advanced portable mechanical ventilation devices are expected to boost the market in the country during the forecast period.
Growing Adoption of Positive Air Pressure Devices in Home Care Settings Boosting Market in China
China will contribute nearly 8.0% revenue share to the global positive air pressure devices market in 2022, making it one of the leading markets across East Asia.
The high prevalence of long-term sleep problems and rising patient awareness are expected to increase the demand for Positive air pressure devices in China, which will in turn fuel the expansion of the local market.
Additionally, home care settings are expanding quickly due to the region's high prevalence and frequency of long-term respiratory disorders and the utilization of the equipment.
Get the data you need at a Fraction of the cost
Personalize your report by choosing insights you need
and save 40%!
Continuous Positive Airway Pressure Devices Remain Highly Sought-After Products
As per FMI, continuous positive airways pressure devices (CPAP) will continue to dominate the global positive air pressure devices market, accounting for the highest market share of 70.7% in 2022. This can be attributed to the rising adoption of these devices across various end-user sectors.
Continuous positive airway pressure (CPAP) devices have become the gold standard treatment for obstructive sleep apnea. These continuous positive airway pressure devices provide a constant level of pressure greater than atmospheric pressure to the upper respiratory tract of a person.
However, the bi-level positive airway pressure (BiPAP)/ variable positive airway pressure (VPAP) segment will grow at a higher CAGR of about 9.9% during the forecast period. This is because post-COVID-19 pandemic, these devices are increasing in their demand due to their easy portability and use in the product's market.
Obstructive Sleep Apnea Segment to Generate Highest Revenue Share
As per FMI, the obstructive sleep apnea segment is estimated to dominate the global positive air pressure devices market with a revenue share of around 64.5% in 2022 and is further expected to display a growth rate of 5.9% over the forecast period.
The growth of this segment can be attributed to the rising prevalence of obstructive sleep apnea worldwide and the increasing adoption of positive air pressure devices for treating this medical condition.
However, amid the rising incidence of chronic respiratory failure, the respiratory failures segment is likely to grow at the highest CAGR of about 7.5% during the forecast period of 2022 and 2032.
The usage of Positive Air Pressure Remains High in Hospitals
Based on end users, the hospital segment will hold the highest market share value of 57.9% in 2022. This is because most of these devices had been used under a hospital setup only. Similarly, the rising number of hospitals and the growing preference of patients to opt for treatments at hospitals will further accelerate the growth of this segment.
However, with the growing popularity of home healthcare and the availability of portable devices, the home care settings segment is expected to grow at the fastest CAGR of about 8.6% during the forecast period.
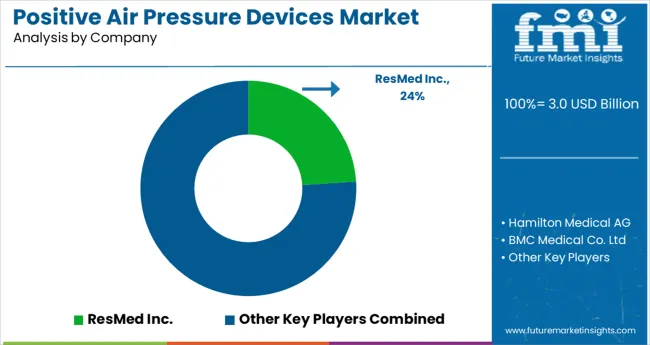
With several competitors in the positive air pressure device manufacturing sphere, the overall market is highly fragmented. To meet consumer demand and expand their customer base, leading companies are implementing strategic approaches such as mergers and acquisitions, partnerships and collaborations, and new product launches.
Instances of key developmental strategies by the industry players in the positive air pressure devices market are given below:
Attribute | Details |
---|---|
Estimated Market Size (2022) | US$ 2.5 Billion |
Projected Market Size (2032) | US$ 4.7 Billion |
Anticipated Growth Rate (2022 to 2032) | 6.4% |
Forecast Period | 2012 to 2021 |
Historical Data Available for | 2022 to 2032 |
Market Analysis | US$ Million for Value and Absolute Units for Volume |
Key Regions Covered | North America, Latin America, Europe, South Asia, East Asia, Oceania, and Middle East & Africa |
Key Countries Covered | USA, Canada, Brazil, Mexico, Argentina, UK, Germany, Italy, Russia, Spain, France, BENELUX, India, Thailand, Indonesia, Malaysia, Japan, China, South Korea, Australia, New Zealand, Turkey, GCC Countries, South Africa |
Key Market Segments Covered | Product, Application End User, and Region |
Key Companies Profiled |
|
Report Coverage | Market Forecast, Company Share Analysis, Competition Intelligence, Drivers, Restraints, Opportunities and Threats Analysis, Market Dynamics and Challenges, and Strategic Growth Initiatives |
1. Executive Summary | Positive Air Pressure Devices Market 1.1. Global Market Outlook 1.2. Demand Side Trends 1.3. Supply Side Trends 1.4. Analysis and Recommendations 2. Market Overview 2.1. Market Coverage / Taxonomy 2.2. Market Definition / Scope / Limitations 2.3. Inclusions and Exclusions 3. Key Market Trends 3.1. Key Trends Impacting the Market 3.2. Product Development and Innovation Trends 4. Key Success Factors 4.1. Product USPs/features 4.2. Product Adoption Analysis by Region 4.3. Regulatory Landscape 4.4. Reimbursement Scenario 4.5. Key Promotional Strategies 4.6. Technology Assessment 4.7. PORTER Analysis 4.8. PESTLE Analysis 4.9. Value Chain Analysis 5. Market Background 5.1. Macro-Economic Factors 5.1.1. Global GDP Growth Outlook 5.1.2. Global Healthcare Expenditure Outlook 5.1.3. Global Mechanical Ventilator Market Outlook 5.2. Forecast Factors - Relevance & Impact 5.2.1. Global Increase in Healthcare Expenditure 5.2.2. Global increase in Research and Development expenditure in Biotechnology 5.2.3. Rising Incidences of Sleep Disorders 5.2.4. Adoption of At-Home Devices 5.2.5. Increasing Geriatric Population 5.2.6. Increase in Risk of Cardiovascular Disorders 5.2.7. Increasing Prevalence of Sleep Apnea 5.3. Market Dynamics 5.3.1. Drivers 5.3.2. Restraints 5.3.3. Opportunity Analysis 6. COVID-19 Crisis - Impact Assessment 6.1. COVID-19 and Impact Analysis 6.1.1. By Product 6.1.2. By Application Type 6.1.3. By End User 6.1.4. By Country 7. Global Market Demand (in Volume) Analysis 2012 to 2021 and Forecast, 2022 to 2032 7.1. Historical Market Volume (Units) Analysis, 2012 to 2021 7.2. Current and Future Market Volume (Units) Projections, 2022 to 2032 7.2.1. Y-o-Y Growth Trend Analysis 8. Global Market - Pricing Analysis 8.1. Region-wise Analysis By Product 8.2. Pricing Break-up 8.2.1. Manufacturer-Level Pricing 8.2.2. Distributor Level Pricing 8.3. Global Average Pricing Analysis Benchmark 8.4. Pricing Assumptions 9. Global Market Demand (in Value or Size in US$ (Million) Analysis 2012 to 2021 and Forecast, 2022 to 2032 9.1. Historical Market Value (US$ Million) Analysis, 2012 to 2021 9.2. Current and Future Market Value (US$ Million) Projections, 2022 to 2032 9.2.1. Y-o-Y Growth Trend Analysis 9.2.2. Absolute $ Opportunity Analysis 10. Global Market Analysis 2012 to 2021 and Forecast 2022 to 2032, By Product 10.1. Introduction / Key Findings 10.2. Historical Market Size (US$ Million) and Volume (Units) Analysis, By Product, 2012 to 2021 10.3. Current and Future Market Size (US$ Million) and Volume (Units) Analysis, By Product, 2022 to 2032 10.3.1. Continuous Positive Airways Pressure Devices (CPAP) 10.3.2. Bi-level Positive Airway Pressure (BiPAP)/ Variable Positive Airway Pressure (VPAP) 10.3.3. Automatic Positive Airway Pressure Devices (APAP) 10.4. Market Attractiveness Analysis By Product 11. Global Market Analysis 2012 to 2021 and Forecast 2022 to 2032, By Application Type 11.1. Introduction / Key Findings 11.2. Historical Market Size (US$ Million) Analysis By Application Type, 2012 to 2021 11.3. Current and Future Market Size (US$ Million) Analysis By Application Type, 2022 to 2032 11.3.1. Obstructive sleep apnea 11.3.2. Respiratory failures 11.3.3. Others 11.4. Market Attractiveness Analysis By Application Type 12. Global Market Analysis 2012 to 2021 and Forecast 2022 to 2032, By End User 12.1. Introduction / Key Findings 12.2. Historical Market Size (US$ Million) Analysis, By End User, 2012 to 2021 12.3. Current and Future Market Size (US$ Million) Analysis By End User, 2022 to 2032 12.3.1. Hospitals 12.3.2. Clinics 12.3.3. Sleep Centers 12.3.4. Home care settings 12.4. Market Attractiveness Analysis By End User 13. Global Market Analysis 2012 to 2021 and Forecast 2022 to 2032, By Region 13.1. Introduction 13.2. Historical Market Size (US$ Million) and Volume (Units) Analysis By Region, 2012 to 2021 13.3. Current and Future Market Size (US$ Million) and Volume (Units) Analysis By Region, 2022 to 2032 13.3.1. North America 13.3.2. Latin America 13.3.3. Europe 13.3.4. East Asia 13.3.5. South Asia 13.3.6. Oceania 13.3.7. Middle East and Africa (MEA) 13.4. Market Attractiveness Analysis By Region 14. North America Market Analysis 2012 to 2021 and Forecast 2022 to 2032 14.1. Introduction 14.2. Historical Market Size (US$ Million) and Volume (Units) Analysis, By Market Taxonomy, 2012 to 2021 14.3. Current and Future Market Size (US$ Million) and Volume (Units) Analysis, By Market Taxonomy 2022 to 2032 14.3.1. By Country 14.3.1.1. United States of America 14.3.1.2. Canada 14.3.2. By Product 14.3.3. By Application Type 14.3.4. By End User 14.4. Market Attractiveness Analysis 14.4.1. By Country 14.4.2. By Product 14.4.3. By Application Type 14.4.4. By End User 14.5. Market Trends 14.6. Key Market Participants - Intensity Mapping 14.7. Drivers and Restraints - Impact Analysis 14.8. Country-Level Analysis & Forecast 14.8.1. USA Market Analysis 14.8.1.1. .Introduction 14.8.1.2. Market Analysis and Forecast by Market Taxonomy 14.8.1.2.1. By Product 14.8.1.2.2. By Application Type 14.8.1.2.3. By End User 14.8.2. Canada Market Analysis 14.8.2.1. Introduction 14.8.2.2. Market Analysis and Forecast by Market Taxonomy 14.8.2.2.1. By Product 14.8.2.2.2. By Application Type 14.8.2.2.3. By End User 15. Latin America Market Analysis 2012 to 2021 and Forecast 2022 to 2032 15.1. Introduction 15.2. Historical Market Size (US$ Million) and Volume (Units) Analysis By Market Taxonomy, 2012 to 2021 15.3. Current and Future Market Size (US$ Million) and Volume (Units) Analysis, By Market Taxonomy, 2022 to 2032 15.3.1. By Country 15.3.1.1. Mexico 15.3.1.2. Brazil 15.3.1.3. Argentina 15.3.1.4. Rest of Latin America 15.3.2. By Product 15.3.3. By Application Type 15.3.4. By End User 15.4. Market Attractiveness Analysis 15.4.1. By Country 15.4.2. By Product 15.4.3. By Application Type 15.4.4. By End User 15.5. Market Trends 15.6. Key Market Participants - Intensity Mapping 15.7. Drivers and Restraints - Impact Analysis 15.8. Country-Level Analysis & Forecast 15.8.1. Mexico Market Analysis 15.8.1.1. Introduction 15.8.1.2. Market Analysis and Forecast by Market Taxonomy 15.8.1.2.1. By Product 15.8.1.2.2. By Application Type 15.8.1.2.3. By End User 15.8.2. Brazil Market Analysis 15.8.2.1. Introduction 15.8.2.2. Market Analysis and Forecast by Market Taxonomy 15.8.2.2.1. By Product 15.8.2.2.2. By Application Type 15.8.2.2.3. By End User 15.8.3. Argentina Market Analysis 15.8.3.1. Introduction 15.8.3.2. Market Analysis and Forecast by Market Taxonomy 15.8.3.2.1. By Product 15.8.3.2.2. By Application Type 15.8.3.2.3. By End User 16. Europe Market Analysis 2012 to 2021 and Forecast 2022 to 2032 16.1. Introduction 16.2. Historical Market Size (US$ Million) and Volume (Units) Analysis, By Market Taxonomy, 2012 to 2021 16.3. Current and Future Market Size (US$ Million) and Volume (Units) Analysis, By Market Taxonomy, 2022 to 2032 16.3.1. By Country 16.3.1.1. Germany 16.3.1.2. Italy 16.3.1.3. France 16.3.1.4. United Kingdom 16.3.1.5. Spain 16.3.1.6. Benelux 16.3.1.7. Russia 16.3.1.8. Rest of Europe 16.3.2. By Product 16.3.3. By Application Type 16.3.4. By End User 16.4. Market Attractiveness Analysis 16.4.1. By Country 16.4.2. By Product 16.4.3. By Application Type 16.4.4. By End User 16.5. Market Trends 16.6. Key Market Participants - Intensity Mapping 16.7. Drivers and Restraints - Impact Analysis 16.8. Country-Level Analysis & Forecast 16.8.1. Germany Market Analysis 16.8.1.1. Introduction 16.8.1.2. Market Analysis and Forecast by Market Taxonomy 16.8.1.2.1. By Product 16.8.1.2.2. By Application Type 16.8.1.2.3. By End User 16.8.2. Italy Market Analysis 16.8.2.1. Introduction 16.8.2.2. Market Analysis and Forecast by Market Taxonomy 16.8.2.2.1. By Product 16.8.2.2.2. By Application Type 16.8.2.2.3. By End User 16.8.3. France Market Analysis 16.8.3.1. Introduction 16.8.3.2. Market Analysis and Forecast by Market Taxonomy 16.8.3.2.1. By Product 16.8.3.2.2. By Application Type 16.8.3.2.3. By End User 16.8.4. UK Market Analysis 16.8.4.1. Introduction 16.8.4.2. Market Analysis and Forecast by Market Taxonomy 16.8.4.2.1. By Product 16.8.4.2.2. By Application Type 16.8.4.2.3. By End User 16.8.5. Spain Market Analysis 16.8.5.1. Introduction 16.8.5.2. Market Analysis and Forecast by Market Taxonomy 16.8.5.2.1. By Product 16.8.5.2.2. By Application Type 16.8.5.2.3. By End User 16.8.6. Benelux Market Analysis 16.8.6.1. Introduction 16.8.6.2. Market Analysis and Forecast by Market Taxonomy 16.8.6.2.1. By Product 16.8.6.2.2. By Application Type 16.8.6.2.3. By End User 16.8.7. Russia Market Analysis 16.8.7.1. Introduction 16.8.7.2. Market Analysis and Forecast by Market Taxonomy 16.8.7.2.1. By Product 16.8.7.2.2. By Application Type 16.8.7.2.3. By End User 17. South Asia Market Analysis 2012 to 2021 and Forecast 2022 to 2032 17.1. Introduction 17.2. Historical Market Size (US$ Million) and Volume (Units) Analysis By Market Taxonomy, 2012 to 2021 17.3. Current and Future Market Size (US$ Million) and Volume (Units) Analysis, By Market Taxonomy, 2022 to 2032 17.3.1. By Country 17.3.1.1. India 17.3.1.2. Indonesia 17.3.1.3. Malaysia 17.3.1.4. Thailand 17.3.1.5. Rest of South Asia 17.3.2. By Product 17.3.3. By Application Type 17.3.4. By End User 17.4. Market Attractiveness Analysis 17.4.1. By Country 17.4.2. By Product 17.4.3. By Application Type 17.4.4. By End User 17.5. Market Trends 17.6. Key Market Participants - Intensity Mapping 17.7. Drivers and Restraints - Impact Analysis 17.8. Country-Level Analysis & Forecast 17.8.1. India Market Analysis 17.8.1.1. Introduction 17.8.1.2. Market Analysis and Forecast by Market Taxonomy 17.8.1.2.1. By Product 17.8.1.2.2. By Application Type 17.8.1.2.3. By End User 17.8.2. Indonesia Market Analysis 17.8.2.1. Introduction 17.8.2.2. Market Analysis and Forecast by Market Taxonomy 17.8.2.2.1. By Product 17.8.2.2.2. By Application Type 17.8.2.2.3. By End User 17.8.3. Malaysia Market Analysis 17.8.3.1. Introduction 17.8.3.2. Market Analysis and Forecast by Market Taxonomy 17.8.3.2.1. By Product 17.8.3.2.2. By Application Type 17.8.3.2.3. By End User 17.8.4. Thailand Market Analysis 17.8.4.1. Introduction 17.8.4.2. Market Analysis and Forecast by Market Taxonomy 17.8.4.2.1. By Product 17.8.4.2.2. By Application Type 17.8.4.2.3. By End User 18. East Asia Market Analysis 2012 to 2021 and Forecast 2022 to 2032 18.1. Introduction 18.2. Historical Market Size (US$ Million) and Volume (Units) Analysis By Market Taxonomy, 2012 to 2021 18.3. Current and Future Market Size (US$ Million) and Volume (Units) Analysis, By Market Taxonomy, 2022 to 2032 18.3.1. By Country 18.3.1.1. China 18.3.1.2. Japan 18.3.1.3. South Korea 18.3.2. By Product 18.3.3. By Application Type 18.3.4. By End User 18.4. Market Attractiveness Analysis 18.4.1. By Country 18.4.2. By Product 18.4.3. By Application Type 18.4.4. By End User 18.5. Market Trends 18.6. Key Market Participants - Intensity Mapping 18.7. Drivers and Restraints - Impact Analysis 18.8. Country-Level Analysis & Forecast 18.8.1. China Market Analysis 18.8.1.1. Introduction 18.8.1.2. Market Analysis and Forecast by Market Taxonomy 18.8.1.2.1. By Product 18.8.1.2.2. By Application Type 18.8.1.2.3. By End User 18.8.2. Japan Market Analysis 18.8.2.1. Introduction 18.8.2.2. Market Analysis and Forecast by Market Taxonomy 18.8.2.2.1. By Product 18.8.2.2.2. By Application Type 18.8.2.2.3. By End User 18.8.3. South Korea Market Analysis 18.8.3.1. Introduction 18.8.3.2. Market Analysis and Forecast by Market Taxonomy 18.8.3.2.1. By Product 18.8.3.2.2. By Application Type 18.8.3.2.3. By End User 19. Oceania Market 2012 to 2021 and Forecast 2022 to 2032 19.1. Introduction 19.2. Historical Market Size (US$ Million) and Volume (Units) Analysis By Market Taxonomy, 2012 to 2021 19.3. Current and Future Market Size (US$ Million) and Volume (Units) Analysis, By Market Taxonomy, 2022 to 2032 19.3.1. By Country 19.3.1.1. Australia 19.3.1.2. New Zealand 19.3.2. By Product 19.3.3. By Application Type 19.3.4. By End User 19.4. Market Attractiveness Analysis 19.4.1. By Country 19.4.2. By Product 19.4.3. By Application Type 19.4.4. By End User 19.5. Market Trends 19.6. Key Market Participants - Intensity Mapping 19.7. Drivers and Restraints - Impact Analysis 19.8. Country-Level Analysis & Forecast 19.8.1. Australia Market Analysis 19.8.1.1. Introduction 19.8.1.2. Market Analysis and Forecast by Market Taxonomy 19.8.1.2.1. By Product 19.8.1.2.2. By Application Type 19.8.1.2.3. By End User 19.8.2. New Zealand Market Analysis 19.8.2.1. Introduction 19.8.2.2. Market Analysis and Forecast by Market Taxonomy 19.8.2.2.1. By Product 19.8.2.2.2. By Application Type 19.8.2.2.3. By End User 20. Middle East and Africa (MEA) Market Analysis 2012 to 2021 and Forecast 2022 to 2032 20.1. Introduction 20.2. Historical Market Size (US$ Million) and Volume (Units) Analysis By Market Taxonomy, 2012 to 2021 20.3. Current and Future Market Size (US$ Million) and Volume (Units) Analysis, By Market Taxonomy, 2022 to 2032 20.3.1. By Country 20.3.1.1. GCC Countries 20.3.1.2. South Africa 20.3.1.3. Turkey 20.3.1.4. Rest of Middle East and Africa 20.3.2. By Product 20.3.3. By Application Type 20.3.4. By End User 20.4. Market Attractiveness Analysis 20.4.1. By Country 20.4.2. By Product 20.4.3. By Application Type 20.4.4. By End User 20.5. Market Trends 20.6. Key Market Participants - Intensity Mapping 20.7. Drivers and Restraints - Impact Analysis 20.8. Country-Level Analysis & Forecast 20.8.1. GCC Countries Market Analysis 20.8.1.1. Introduction 20.8.1.2. Market Analysis and Forecast by Market Taxonomy 20.8.1.2.1. By Product 20.8.1.2.2. By Application Type 20.8.1.2.3. By End User 20.8.2. Turkey Market Analysis 20.8.2.1. Introduction 20.8.2.2. Market Analysis and Forecast by Market Taxonomy 20.8.2.2.1. By Product 20.8.2.2.2. By Application Type 20.8.2.2.3. By End User 20.8.3. South Africa Market Analysis 20.8.3.1. Introduction 20.8.3.2. Market Analysis and Forecast by Market Taxonomy 20.8.3.2.1. By Product 20.8.3.2.2. By Application Type 20.8.3.2.3. By End User 21. Market Structure Analysis 21.1. Market Analysis by Tier of Companies 21.2. Market Share Analysis of Top Players 21.3. Market Presence Analysis 21.3.1. By Regional footprint of Players 21.3.2. Product footprint by Players 21.3.3. Channel Foot Print by Players 22. Competition Analysis 22.1. Competition Dashboard 22.2. Competition Benchmarking 22.3. Competition Deep Dive (Tentative List) 22.3.1. 3B Medical, Inc 22.3.1.1. Overview 22.3.1.2. Product Portfolio 22.3.1.3. Key Financials 22.3.1.4. SWOT Analysis 22.3.1.5. Sales Footprint 22.3.1.6. Key developments 22.3.1.7. Strategy Overview 22.3.1.7.1. Marketing Strategies 22.3.1.7.2. Channel Strategies 22.3.2. Hamilton Medical AG 22.3.2.1. Overview 22.3.2.2. Product Portfolio 22.3.2.3. Key Financials 22.3.2.4. SWOT Analysis 22.3.2.5. Sales Footprint 22.3.2.6. Key developments 22.3.2.7. Strategy Overview 22.3.2.7.1. Marketing Strategies 22.3.2.7.2. Channel Strategies 22.3.3. BMC Medical Co. Ltd 22.3.3.1. Overview 22.3.3.2. Product Portfolio 22.3.3.3. Key Financials 22.3.3.4. SWOT Analysis 22.3.3.5. Sales Footprint 22.3.3.6. Key developments 22.3.3.7. Strategy Overview 22.3.3.7.1. Marketing Strategies 22.3.3.7.2. Channel Strategies 22.3.4. Breas Medical AB 22.3.4.1. Overview 22.3.4.2. Product Portfolio 22.3.4.3. Key Financials 22.3.4.4. SWOT Analysis 22.3.4.5. Sales Footprint 22.3.4.6. Key developments 22.3.4.7. Strategy Overview 22.3.4.7.1. Marketing Strategies 22.3.4.7.2. Channel Strategies 22.3.5. Compumedics Limited 22.3.5.1. Overview 22.3.5.2. Product Portfolio 22.3.5.3. Key Financials 22.3.5.4. SWOT Analysis 22.3.5.5. Sales Footprint 22.3.5.6. Key developments 22.3.5.7. Strategy Overview 22.3.5.7.1. Marketing Strategies 22.3.5.7.2. Channel Strategies 22.3.6. Drive DeVilbiss Healthcare 22.3.6.1. Overview 22.3.6.2. Product Portfolio 22.3.6.3. Key Financials 22.3.6.4. SWOT Analysis 22.3.6.5. Sales Footprint 22.3.6.6. Key developments 22.3.6.7. Strategy Overview 22.3.6.7.1. Marketing Strategies 22.3.6.7.2. Channel Strategies 22.3.7. Elmaslar Group 22.3.7.1. Overview 22.3.7.2. Product Portfolio 22.3.7.3. Key Financials 22.3.7.4. SWOT Analysis 22.3.7.5. Sales Footprint 22.3.7.6. Key developments 22.3.7.7. Strategy Overview 22.3.7.7.1. Marketing Strategies 22.3.7.7.2. Channel Strategies 22.3.8. Fisher & Paykel Healthcare Corporation Limited 22.3.8.1. Overview 22.3.8.2. Product Portfolio 22.3.8.3. Key Financials 22.3.8.4. SWOT Analysis 22.3.8.5. Sales Footprint 22.3.8.6. Key developments 22.3.8.7. Strategy Overview 22.3.8.7.1. Marketing Strategies 22.3.8.7.2. Channel Strategies 22.3.9. Hebei Topson Medical Technology Co., Ltd. 22.3.9.1. Overview 22.3.9.2. Product Portfolio 22.3.9.3. Key Financials 22.3.9.4. SWOT Analysis 22.3.9.5. Sales Footprint 22.3.9.6. Key developments 22.3.9.7. Strategy Overview 22.3.9.7.1. Marketing Strategies 22.3.9.7.2. Channel Strategies 22.3.10. Kare Medical and Analytical Devices Ltd. Co 22.3.10.1. Overview 22.3.10.2. Product Portfolio 22.3.10.3. Key Financials 22.3.10.4. SWOT Analysis 22.3.10.5. Sales Footprint 22.3.10.6. Key developments 22.3.10.7. Strategy Overview 22.3.10.7.1. Marketing Strategies 22.3.10.7.2. Channel Strategies 22.3.11. Koninklijke Philips N.V 22.3.11.1. Overview 22.3.11.2. Product Portfolio 22.3.11.3. Key Financials 22.3.11.4. SWOT Analysis 22.3.11.5. Sales Footprint 22.3.11.6. Key developments 22.3.11.7. Strategy Overview 22.3.11.7.1. Marketing Strategies 22.3.11.7.2. Channel Strategies 22.3.12. Lowenstein Medical Technology GmbH 22.3.12.1. Overview 22.3.12.2. Product Portfolio 22.3.12.3. Key Financials 22.3.12.4. SWOT Analysis 22.3.12.5. Sales Footprint 22.3.12.6. Key developments 22.3.12.7. Strategy Overview 22.3.12.7.1. Marketing Strategies 22.3.12.7.2. Channel Strategies 22.3.13. Narang Medical Limited 22.3.13.1. Overview 22.3.13.2. Product Portfolio 22.3.13.3. Key Financials 22.3.13.4. SWOT Analysis 22.3.13.5. Sales Footprint 22.3.13.6. Key developments 22.3.13.7. Strategy Overview 22.3.13.7.1. Marketing Strategies 22.3.13.7.2. Channel Strategies 22.3.14. SoMillionetics International, Inc. 22.3.14.1. Overview 22.3.14.2. Product Portfolio 22.3.14.3. Key Financials 22.3.14.4. SWOT Analysis 22.3.14.5. Sales Footprint 22.3.14.6. Key developments 22.3.14.7. Strategy Overview 22.3.14.7.1. Marketing Strategies 22.3.14.7.2. Channel Strategies 22.3.15. Draegerwerk AG & Co. KGaA 22.3.15.1. Overview 22.3.15.2. Product Portfolio 22.3.15.3. Key Financials 22.3.15.4. SWOT Analysis 22.3.15.5. Sales Footprint 22.3.15.6. Key developments 22.3.15.7. Strategy Overview 22.3.15.7.1. Marketing Strategies 22.3.15.7.2. Channel Strategies 22.3.16. Apex Medical Corporation 22.3.16.1. Overview 22.3.16.2. Product Portfolio 22.3.16.3. Key Financials 22.3.16.4. SWOT Analysis 22.3.16.5. Sales Footprint 22.3.16.6. Key developments 22.3.16.7. Strategy Overview 22.3.16.7.1. Marketing Strategies 22.3.16.7.2. Channel Strategies 22.3.17. ResMed Inc. 22.3.17.1. Overview 22.3.17.2. Product Portfolio 22.3.17.3. Key Financials 22.3.17.4. SWOT Analysis 22.3.17.5. Sales Footprint 22.3.17.6. Key developments 22.3.17.7. Strategy Overview 22.3.17.7.1. Marketing Strategies 22.3.17.7.2. Channel Strategies 23. Assumptions and Acronyms Used 24. Research Methodology
Don't pay for what you don't need
Customize your report by selecting specific countries or regions and save 30%!
Table 01: Global Market Value (US$ Million) Analysis and Forecast 2012 to 2032, By Product Table 02: Global Market Volume (Units) Analysis and Forecast 2012 to 2032, By Product Table 03: Global Market Value (US$ Million) Analysis and Forecast 2012 to 2032, by Application Type Table 04: Global Market Value (US$ Million) Analysis and Forecast 2012 to 2032, by End User Table 05: Global Market Value (US$ Million) Analysis and Forecast 2012 to 2032, by Region Table 06: North America Market Value (US$ Million) Analysis 2012 to 2021 and Forecast 2022 to 2032, by Country Table 07: North America Market Value (US$ Million) Analysis and Forecast 2012 to 2032, By Product Table 08: North America Market Volume (Units) Analysis and Forecast 2012 to 2032, By Product Table 09: North America Market Value (US$ Million) Analysis and Forecast 2012 to 2032, by Application Type Table 10: North America Market Value (US$ Million) Analysis and Forecast 2012 to 2032, by End User Table 11: Latin America Market Value (US$ Million) Analysis 2012 to 2021 and Forecast 2022 to 2032, by Country Table 12: Latin America Market Value (US$ Million) Analysis and Forecast 2012 to 2032, By Product Table 13: Latin America Market Volume (Units) Analysis and Forecast 2012 to 2032, By Product Table 14: Latin America Market Value (US$ Million) Analysis and Forecast 2012 to 2032, by Application Type Table 15: Latin America Market Value (US$ Million) Analysis and Forecast 2012 to 2032, by End User Table 16: Europe Market Value (US$ Million) Analysis 2012 to 2021 and Forecast 2022 to 2032, by Country Table 17: Europe Market Value (US$ Million) Analysis and Forecast 2012 to 2032, By Product Table 18: Europe Market Volume (Units) Analysis and Forecast 2012 to 2032, By Product Table 19: Europe Market Value (US$ Million) Analysis and Forecast 2012 to 2032, by Application Type Table 20: Europe Market Value (US$ Million) Analysis and Forecast 2012 to 2032, by End User Table 21: South Asia Market Value (US$ Million) Analysis 2012 to 2021 and Forecast 2022 to 2032, by Country Table 22: South Asia Market Value (US$ Million) Analysis and Forecast 2012 to 2032, By Product Table 23: South Asia Market Volume (Units) Analysis and Forecast 2012 to 2032, By Product Table 24: South Asia Market Value (US$ Million) Analysis and Forecast 2012 to 2032, by Application Type Table 25: South Asia Market Value (US$ Million) Analysis and Forecast 2012 to 2032, by End User Table 26: East Asia Market Value (US$ Million) Analysis 2012 to 2021 and Forecast 2022 to 2032, by Country Table 27: East Asia Market Value (US$ Million) Analysis and Forecast 2012 to 2032, By Product Table 28: East Asia Market Volume (Units) Analysis and Forecast 2012 to 2032, By Product Table 29: East Asia Market Value (US$ Million) Analysis and Forecast 2012 to 2032, by Application Type Table 30: East Asia Market Value (US$ Million) Analysis and Forecast 2012 to 2032, by End User Table 31: Oceania Market Value (US$ Million) Analysis 2012 to 2021 and Forecast 2022 to 2032, by Country Table 32: Oceania Market Value (US$ Million) Analysis and Forecast 2012 to 2032, By Product Table 33: Oceania Market Volume (Units) Analysis and Forecast 2012 to 2032, By Product Table 34: Oceania Market Value (US$ Million) Analysis and Forecast 2012 to 2032, by Application Type Table 35: Oceania Market Value (US$ Million) Analysis and Forecast 2012 to 2032, by End User Table 36: MEA Market Value (US$ Million) Analysis 2012 to 2021 and Forecast 2022 to 2032, by Country Table 37: MEA Market Value (US$ Million) Analysis and Forecast 2012 to 2032, By Product Table 38: MEA Market Volume (Units) Analysis and Forecast 2012 to 2032, By Product Table 39: MEA Market Value (US$ Million) Analysis and Forecast 2012 to 2032, by Application Type Table 40: MEA Market Value (US$ Million) Analysis and Forecast 2012 to 2032, by segment 3
Figure 01: Global Market Volume (Units), 2012 to 2021 Figure 02: Global Market Volume (Units) & Y-o-Y Growth (%) Analysis, 2022 to 2032 Figure 03: ABC, Pricing Analysis per unit (US$), in 2022 Figure 04: ABC, Pricing Forecast per unit (US$), in 2032 Figure 05: Global Market Value Analysis (US$ Million), 2012 to 2021 Figure 06: Global Market Value Forecast (US$ Million), 2022 to 2032 Figure 07: Global Market Absolute $ Opportunity, 2022 to 2032 Figure 08: Global Market Share Analysis (%), By Product, 2022 to 2032 Figure 09: Global Market Y-o-Y Analysis (%), By Product, 2022 to 2032 Figure 10: Global Market Attractiveness Analysis By Product, 2022 to 2032 Figure 11: Global Market Share Analysis (%), by Application Type, 2022 to 2032 Figure 12: Global Market Y-o-Y Analysis (%), by Application Type, 2022 to 2032 Figure 13: Global Market Attractiveness Analysis by Application Type, 2022 to 2032 Figure 14: Global Market Share Analysis (%), by End User, 2022 to 2032 Figure 15: Global Market Y-o-Y Analysis (%), by End User, 2022 to 2032 Figure 16: Global Market Attractiveness Analysis by End User, 2022 to 2032 Figure 17: Global Market Share Analysis (%), by Region, 2022 to 2032 Figure 18: Global Market Y-o-Y Analysis (%), by Region, 2022 to 2032 Figure 19: Global Market Attractiveness Analysis by Region, 2022 to 2032 Figure 20: North America Market Value Share, By Product, 2022 (E) Figure 21: North America Market Value Share, by Application Type, 2022 (E) Figure 22: North America Market Value Share, by End User, 2022 (E) Figure 23: North America Market Value Share, by Country, 2022 (E) Figure 24: North America Market Value Analysis (US$ Million), 2012 to 2021 Figure 25: North America Market Value Forecast (US$ Million), 2022 to 2032 Figure 26: North America Market Attractiveness Analysis By Product, 2022 to 2032 Figure 27: North America Market Attractiveness Analysis, by Application Type 2022 to 2032 Figure 28: North America Market Attractiveness Analysis by End User, 2022 to 2032 Figure 29: North America Market Attractiveness Analysis by Country, 2022 to 2032 Figure 30: USA Market Share Analysis (%), By Product, 2022 to 2032 Figure 31: USA Market Share Analysis (%), by Application Type, 2022 to 2032 Figure 32: USA Market Share Analysis (%), by End User, 2022 to 2032 Figure 33: USA Market Value Analysis (US$ Million), 2022 to 2032 Figure 34: Canada Market Share Analysis (%), By Product, 2022 to 2032 Figure 35: Canada Market Share Analysis (%), by Application Type, 2022 to 2032 Figure 36: Canada Market Share Analysis (%), by End User, 2022 to 2032 Figure 37: Canada Market Value Analysis (US$ Million), 2022 to 2032 Figure 38: Latin America Market Value Share, By Product, 2022 (E) Figure 39: Latin America Market Value Share, by Application Type, 2022 (E) Figure 40: Latin America Market Value Share, by End User, 2022 (E) Figure 41: Latin America Market Value Share, by Country, 2022 (E) Figure 42: Latin America Market Value Analysis (US$ Million), 2012 to 2021 Figure 43: Latin America Market Value Forecast (US$ Million), 2022 to 2032 Figure 44: Latin America Market Attractiveness Analysis By Product, 2022 to 2032 Figure 45: Latin America Market Attractiveness Analysis by Application Type, 2022 to 2032 Figure 46: Latin America Market Attractiveness Analysis by End User, 2022 to 2032 Figure 47: Latin America Market Attractiveness Analysis by Country, 2022 to 2032 Figure 48: Brazil Market Share Analysis (%), By Product, 2022 to 2032 Figure 49: Brazil Market Share Analysis (%), by Application Type, 2022 to 2032 Figure 50: Brazil Market Share Analysis (%), by End User, 2022 to 2032 Figure 51: Brazil Market Value Analysis (US$ Million), 2022 to 2032 Figure 52: Mexico Market Share Analysis (%), By Product, 2022 to 2032 Figure 53: Mexico Market Share Analysis (%), by Application Type, 2022 to 2032 Figure 54: Mexico Market Share Analysis (%), by End User, 2022 to 2032 Figure 55: Mexico Market Value Analysis (US$ Million), 2022 to 2032 Figure 56: Argentina Market Share Analysis (%), By Product, 2022 to 2032 Figure 57: Argentina Market Share Analysis (%), by Application Type, 2022 to 2032 Figure 58: Argentina Market Share Analysis (%), by End User, 2022 to 2032 Figure 59: Argentina Market Value Analysis (US$ Million), 2022 to 2032 Figure 60: Europe Market Value Share, By Product, 2022 (E) Figure 61: Europe Market Value Share, by Application Type, 2022 (E) Figure 62: Europe Market Value Share, by End User, 2022 (E) Figure 63: Europe Market Value Share, by Country, 2022 (E) Figure 64: Europe Market Value Analysis (US$ Million), 2012 to 2021 Figure 65: Europe Market Value Forecast (US$ Million), 2022 to 2032 Figure 66: Europe Market Attractiveness Analysis By Product, 2022 to 2032 Figure 67: Europe Market Attractiveness Analysis by Application Type, 2022 to 2032 Figure 68: Europe Market Attractiveness Analysis by End User, 2022 to 2032 Figure 69: Europe Market Attractiveness Analysis by Country, 2022 to 2032 Figure 70: Germany Market Share Analysis (%), By Product, 2022 to 2032 Figure 71: Germany Market Share Analysis (%), by Application Type, 2022 to 2032 Figure 72: Germany Market Share Analysis (%), by End User, 2022 to 2032 Figure 73: Germany Market Value Analysis (US$ Million), 2022 to 2032 Figure 74: Italy Market Share Analysis (%), By Product, 2022 to 2032 Figure 75: Italy Market Share Analysis (%), by Application Type, 2022 to 2032 Figure 76: Italy Market Share Analysis (%), by End User, 2022 to 2032 Figure 77: Italy Market Value Analysis (US$ Million), 2022 to 2032 Figure 78: France Market Share Analysis (%), By Product, 2022 to 2032 Figure 79: France Market Share Analysis (%), by Application Type, 2022 to 2032 Figure 80: France Market Share Analysis (%), by End User, 2022 to 2032 Figure 81: France Market Value Analysis (US$ Million), 2022 to 2032 Figure 82: UK Market Share Analysis (%), By Product, 2022 to 2032 Figure 83: UK Market Share Analysis (%), by Application Type, 2022 to 2032 Figure 84: UK Market Share Analysis (%), by End User, 2022 to 2032 Figure 85: UK Market Value Analysis (US$ Million), 2022 to 2032 Figure 86: Spain Market Share Analysis (%), By Product, 2022 to 2032 Figure 87: Spain Market Share Analysis (%), by Application Type, 2022 to 2032 Figure 88: Spain Market Share Analysis (%), by End User, 2022 to 2032 Figure 89: Spain Market Value Analysis (US$ Million), 2022 to 2032 Figure 90: BENELUX Market Share Analysis (%), By Product, 2022 to 2032 Figure 91: BENELUX Market Share Analysis (%), by Application Type, 2022 to 2032 Figure 92: BENELUX Market Share Analysis (%), by End User, 2022 to 2032 Figure 93: BENELUX Market Value Analysis (US$ Million), 2022 to 2032 Figure 94: Russia Market Share Analysis (%), By Product, 2022 to 2032 Figure 95: Russia Market Share Analysis (%), by Application Type, 2022 to 2032 Figure 96: Russia Market Share Analysis (%), by End User, 2022 to 2032 Figure 97: Russia Market Value Analysis (US$ Million), 2022 to 2032 Figure 98: South Asia Market Value Share, By Product, 2022 (E) Figure 99: South Asia Market Value Share, by Application Type, 2022 (E) Figure 100: South Asia Market Value Share, by End User, 2022 (E) Figure 101: South Asia Market Value Share, by Country, 2022 (E) Figure 102: South Asia Market Value Analysis (US$ Million), 2012 to 2021 Figure 103: South Asia Market Value Forecast (US$ Million), 2022 to 2032 Figure 104: South Asia Market Attractiveness Analysis By Product, 2022 to 2032 Figure 105: South Asia Market Attractiveness Analysis by Application Type, 2022 to 2032 Figure 106: South Asia Market Attractiveness Analysis by End User, 2022 to 2032 Figure 107: South Asia Market Attractiveness Analysis by Country, 2022 to 2032 Figure 108: India Market Share Analysis (%), By Product, 2022 to 2032 Figure 109: India Market Share Analysis (%), by Application Type, 2022 to 2032 Figure 110: India Market Share Analysis (%), by End User, 2022 to 2032 Figure 111: India Market Value Analysis (US$ Million), 2022 to 2032 Figure 112: Indonesia Market Share Analysis (%), By Product, 2022 to 2032 Figure 113: Indonesia Market Share Analysis (%), by Application Type, 2022 to 2032 Figure 114: Indonesia Market Share Analysis (%), by End User, 2022 to 2032 Figure 115: Indonesia Market Value Analysis (US$ Million), 2022 to 2032 Figure 116: Thailand Market Share Analysis (%), By Product, 2022 to 2032 Figure 117: Thailand Market Share Analysis (%), by Application Type, 2022 to 2032 Figure 118: Thailand Market Share Analysis (%), by End User, 2022 to 2032 Figure 119: Thailand Market Value Analysis (US$ Million), 2022 to 2032 Figure 120: Malaysia Market Share Analysis (%), By Product, 2022 to 2032 Figure 121: Malaysia Market Share Analysis (%), by Application Type, 2022 to 2032 Figure 122: Malaysia Market Share Analysis (%), by End User, 2022 to 2032 Figure 123: Malaysia Market Value Analysis (US$ Million), 2022 to 2032 Figure 124: East Asia Market Value Share, By Product, 2022 (E) Figure 125: East Asia Market Value Share, by Application Type, 2022 (E) Figure 126: East Asia Market Value Share, by End User, 2022 (E) Figure 127: East Asia Market Value Share, by Country, 2022 (E) Figure 128: East Asia Market Value Analysis (US$ Million), 2012 to 2021 Figure 129: East Asia Market Value Forecast (US$ Million), 2022 to 2032 Figure 130: East Asia Market Attractiveness Analysis By Product, 2022 to 2032 Figure 131: East Asia Market Attractiveness Analysis by Application Type, 2022 to 2032 Figure 132: East Asia Market Attractiveness Analysis by End User, 2022 to 2032 Figure 133: East Asia Market Attractiveness Analysis by Country, 2022 to 2032 Figure 134: China Market Share Analysis (%), By Product, 2022 to 2032 Figure 135: China Market Share Analysis (%), by Application Type, 2022 to 2032 Figure 136: China Market Share Analysis (%), by End User, 2022 to 2032 Figure 137: China Market Value Analysis (US$ Million), 2022 to 2032 Figure 138: Japan Market Share Analysis (%), By Product, 2022 to 2032 Figure 139: Japan Market Share Analysis (%), by Application Type, 2022 to 2032 Figure 140: Japan Market Share Analysis (%), by End User, 2022 to 2032 Figure 141: Japan Market Value Analysis (US$ Million), 2022 to 2032 Figure 142: South Korea Market Share Analysis (%), By Product, 2022 to 2032 Figure 143: South Korea Market Share Analysis (%), by Application Type, 2022 to 2032 Figure 144: South Korea Market Share Analysis (%), by End User, 2022 to 2032 Figure 145: South Korea Market Value Analysis (US$ Million), 2022 to 2032 Figure 146: Oceania Market Value Share, By Product, 2022 (E) Figure 147: Oceania Market Value Share, by Application Type, 2022 (E) Figure 148: Oceania Market Value Share, by End User, 2022 (E) Figure 149: Oceania Market Value Share, by Country, 2022 (E) Figure 150: Oceania Market Value Analysis (US$ Million), 2012 to 2021 Figure 151: Oceania Market Value Forecast (US$ Million), 2022 to 2032 Figure 152: Oceania Market Attractiveness Analysis By Product, 2022 to 2032 Figure 153: Oceania Market Attractiveness Analysis by Application Type, 2022 to 2032 Figure 154: Oceania Market Attractiveness Analysis by End User, 2022 to 2032 Figure 155: Oceania Market Attractiveness Analysis by Country, 2022 to 2032 Figure 156: Australia Market Share Analysis (%), By Product, 2022 to 2032 Figure 157: Australia Market Share Analysis (%), by Application Type, 2022 to 2032 Figure 158: Australia Market Share Analysis (%), by End User, 2022 to 2032 Figure 159: Australia Market Value Analysis (US$ Million), 2022 to 2032 Figure 160: New Zealand Market Share Analysis (%), By Product, 2022 to 2032 Figure 161: New Zealand Market Share Analysis (%), by Application Type, 2022 to 2032 Figure 162: New Zealand Market Share Analysis (%), by End User, 2022 to 2032 Figure 163: New Zealand Market Value Analysis (US$ Million), 2022 to 2032 Figure 164: MEA Market Value Share, By Product, 2022 (E) Figure 165: MEA Market Value Share, by Application Type, 2022 (E) Figure 166: MEA Market Value Share, by End User, 2022 (E) Figure 167: MEA Market Value Share, by Country, 2022 (E) Figure 168: MEA Market Value Analysis (US$ Million), 2012 to 2021 Figure 169: MEA Market Value Forecast (US$ Million), 2022 to 2032 Figure 170: MEA Market Attractiveness Analysis By Product, 2022 to 2032 Figure 171: MEA Market Attractiveness Analysis by Application Type, 2022 to 2032 Figure 172: MEA Market Attractiveness Analysis by End User, 2022 to 2032 Figure 173: MEA Market Attractiveness Analysis by Country, 2022 to 2032 Figure 174: GCC Countries Market Share Analysis (%), By Product, 2022 to 2032 Figure 175: GCC Countries Market Share Analysis (%), by Application Type, 2022 to 2032 Figure 176: GCC Countries Market Share Analysis (%), by End User, 2022 to 2032 Figure 177: GCC Countries Market Value Analysis (US$ Million), 2022 to 2032 Figure 178: Turkey Market Share Analysis (%), By Product, 2022 to 2032 Figure 179: Turkey Market Share Analysis (%), by Application Type, 2022 to 2032 Figure 180: Turkey Market Share Analysis (%), by End User, 2022 to 2032 Figure 181: Turkey Market Value Analysis (US$ Million), 2022 to 2032 Figure 182: South Africa Market Share Analysis (%), By Product, 2022 to 2032 Figure 183: South Africa Market Share Analysis (%), by Application Type, 2022 to 2032 Figure 184: South Africa Market Share Analysis (%), by End User, 2022 to 2032 Figure 185: South Africa Market Value Analysis (US$ Million), 2022 to 2032
Recommendations
Explore Healthcare Insights
View Reports