Reports

- Global Locations -

Headquarters

Future Market Insights, Inc.

Christiana Corporate, 200
Continental Drive, Suite 401,
Newark, Delaware - 19713,
United States

T: +1-845-579-5705

Americas

Future Market Insights, Inc.

616 Corporate Way, Suite 2-9018,
Valley Cottage, NY 10989, United States

T: +1-347-918-3531

MEA

Future Market Insights

1602-6 Jumeirah Bay X2 Tower, Plot No: JLT-PH2-X2A,
Jumeirah Lakes Towers, Dubai,
United Arab Emirates

Europe

Future Market Insights

3rd Floor, 207 Regent Street,
W1B 3HH London
United Kingdom

T: + 44 (0) 20 8123 9659
D: +44 (0) 20 3287 4268

Asia Pacific

Future Market Insights

IndiaLand Global Tech Park, Unit UG-1, Behind Grand HighStreet, Phase 1, Hinjawadi, MH, Pune – 411057, India

Positive Displacement Sanitary Pumps Market Snapshot (2022-2032)

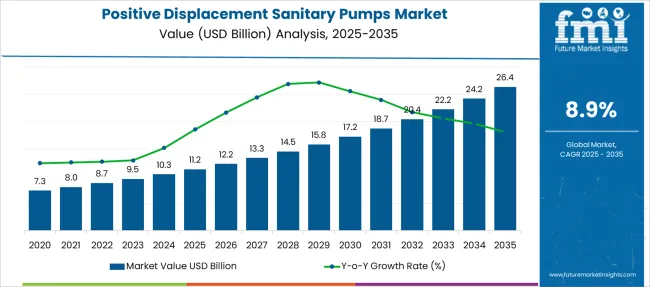
[250 Pages Report] Newly released Positive Displacement Sanitary Pumps Market analysis report by Future Market Insights shows that global sales of Positive Displacement Sanitary Pumps Market in 2021 was held at US$ 7.8 Billion. With 8.9% projected growth, the market is expected to reach a valuation of US$ 20.2 Billion by 2032. Rotary pumps segment is expected to be the highest revenue-generating category, projected to register a CAGR of 8.2% during 2022 to 2032.

Attributes Details
Global Positive Displacement Sanitary Pumps Market Size (2022) US$ 8.7 Billion
Global Positive Displacement Sanitary Pumps Market Size (2032) US$ 20.2 Billion
Global Positive Displacement Sanitary Pumps Market CAGR (2022 to 2032) 8.9%
USA Positive Displacement Sanitary Pumps Market Size (2032) 8.6%
Key Companies Profiled
  • IDEX Corporation
  • SPX Corporation
  • Fristam Pumps
  • Xylem, Inc.
  • PSG Dover
  • Alfa Laval AB
  • ITT Corporation
  • Ampco Pumps GmbH
  • KSB AG
  • Axiflow Technologies, Inc.
  • Sulzer Ltd.
  • Nakakin Co., Ltd.

Don't pay for what you don't need

Customize your report by selecting specific countries or regions and save 30%!

Revenue of Positive Displacement Sanitary Pumps Market from 2017 to 2021 Compared to Demand Outlook for 2022 to 2032

As per the Positive Displacement Sanitary Pumps Market research by Future Market Insights - a market research and competitive intelligence provider, historically, from 2017 to 2021, the market value of the Positive Displacement Sanitary Pumps Market increased at around 9.5% CAGR.

The changing lifestyles and swelled disposable income have increased demand for pre-packaged consumables, which has boosted the food and beverage industry. This has subsequently raised the need for sanitary pumps in the industry. Depending on the viscosity, fat content, and weight of the components, several types of pumps are used in the food and beverage industry to distribute products such as oils, liquids, smoothies, sauces, and dough.

The ability to move products around while they are being processed is required by the majority of medium and large-scale food and beverage industries. Furthermore, these pumps have become an unavoidable requirement in pharmaceutical and cosmetic manufacturing facilities. Chemical compounds, syrups, ointments, gels, and liquids are properly stored and packed using only entirely sterile sanitary pumps and piping systems, saving time and preventing any type of chemical reaction induced by air pollutants. Also, growing consumer awareness of food safety and medicine use has compelled key positive displacement sanitary pump manufacturers, notably in Europe and America, to adhere to sanitary and safety standards.

What Factors are Propelling Positive Displacement Sanitary Pumps Demand?

The key factor driving demand for positive displacement sanitary pumps is increased awareness of industries about the serious consequences of failing to adopt safety and sanitation measures during critical stages of food handling. This has also resulted in a greater emphasis on strict sanitary regulations in the food and beverage business.

In a range of operations, the key players in the pharmaceutical sector follow these severe sanitary regulations. In recent years, the regulatory framework that governs sanitary practices across the industry has become increasingly broad and strict in order to address safety and sanitation issues in a variety of sectors, including supply chain and fluid handling.

The growing trend of urbanization in the manufacturing and industrial sectors, particularly in emerging economies such as China and India is predicted to drive the demand for positive displacement sanitary pumps.

Furthermore, the growing adoption of intelligent or smart pump systems in the industrial sector, owing primarily to the growing demand for real-time feedback on tracking the location of a bug in the system or overall system performance, is expected to drive overall demand for the global market for positive displacement sanitary pumps.

Sudip Saha
Sudip Saha

Principal Consultant

Talk to Analyst

Find your sweet spots for generating winning opportunities in this market.

Region-wise Analysis

Which Region is projected to Offer the Largest Opportunity for Positive Displacement Sanitary Pumps Market?

Asia Pacific is the most lucrative region with the highest projected growth. APAC will account for over half of market growth. Due to their capacity to handle a wide range of fluids, positive displacement sanitary pumps are frequently used for hygienic applications in the food and beverage and pharmaceutical industries. New positive displacement sanitary pumps, including twin-screw pumps, are also helping the industry flourish.

Governments across Asia-Pacific have enacted stringent legislation and regulations to govern wastewater treatment in urban and industrial areas. To address water shortage issues, operators must construct water treatment systems in their facilities. As a consequence, the positive displacement pump market is expected to benefit significantly from sewage treatment in the near future.
Country-wise Analysis

Which Country Lies at the CenterStage for Positive Displacement Sanitary Pumps Market Revenue?

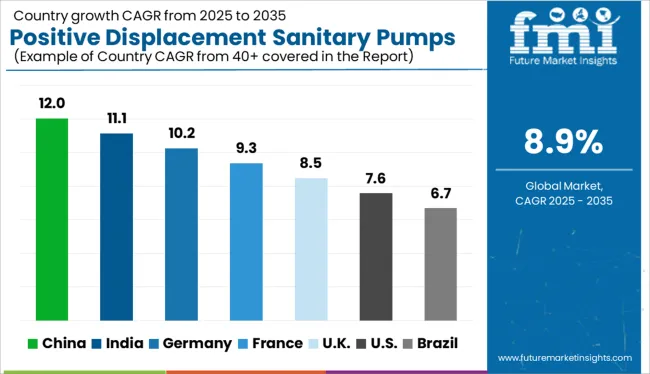
The market in China is expected to account for the highest market share of US$ 3.5 Bn by the end of 2032. The wide use of Positive Displacement Sanitary Pumps in water and wastewater treatment facilities is the key driver of market expansion. The region's oil and gas exploration facilities are expected to be updated and modernized, which would improve the market. Furthermore, mounting worries about water scarcity have encouraged Chinese governments to promote wastewater treatment and recycling. These pumps allow faster installation with better and more effective results while significantly decreasing carbon footprints, which is boosting market expansion.

CIRCOR International had built a new manufacturing facility in Weihai, China. CIRCOR designs flow and motion control devices for the most demanding and mission-critical applications worldwide, including valves, sensors, actuation, pumps, motors, and regulators. Once operational, the new facility will enable CIRCOR to offer its Asian clients a larger choice of flow control solutions. CIRCOR Weihai currently produces centrifugal and three-screw positive displacement pumps for the industrial and commercial maritime industries.

Get the data you need at a Fraction of the cost

Personalize your report by choosing insights you need
and save 40%!

Category-wise Insights

Which Positive Displacement Sanitary Pumps Segment is projected to Witness Fastest Growth among Positive Displacement Sanitary Pumps Type?

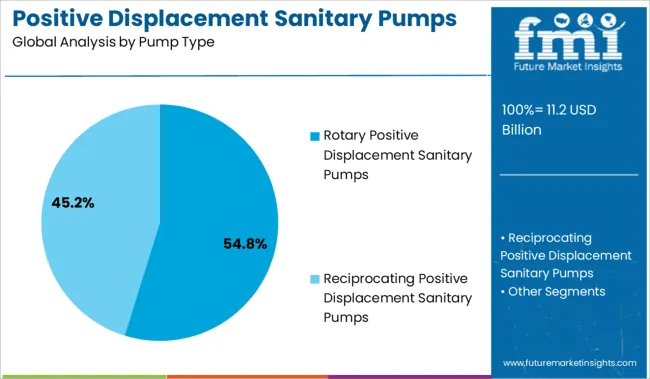
Rotary segment is forecasted to grow at the highest CAGR of over 8.2% during 2022-2032. The implementation of contemporary agricultural technology to increase total factor productivity in order to fulfil expanding agricultural commodity demand is expected to benefit the sales of rotary pump. Rising standards and discretionary spending, as well as process manufacturing, are projected to fuel the rotary pumps demand.

Increased smart manufacturing facilities with pumps networked to the cloud are expected to provide important information such as machine condition and history, which will be the rotary pump industry's future.

When compared to traditional positive displacement (PDP) pumps, the rotary lobe pump has extremely high efficiency. As a consequence, energy usage is greatly reduced. Given that energy bills make up a considerable portion of life cycle costs, this is a significant gain. The substantial adaptability of a wide range of pumped media can assist in reducing expenses even further: The rotating lobe pump can be used for a variety of manufacturing operations in various circumstances. As a result, spare component storage costs are decreased, as are training costs.

Which Product Type of Positive Displacement Sanitary Pumps is expected to Score Highest Growth in the Coming Years?

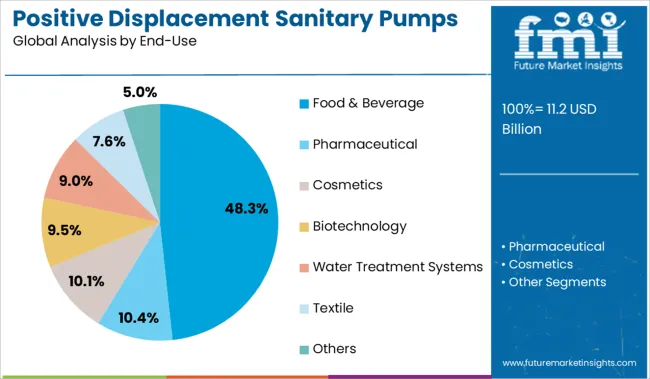
The Food & Beverage segment is forecasted to grow at the highest CAGR of over 9% during 2022-2032. Selecting the correct sanitary positive displacement pump is crucial in today's food and beverage processing environment for enhancing operational efficiency and product consistency while minimizing waste and downtime. Food makers may now choose from a number of PD pump technologies. They may accomplish a broad variety of performance capacities, pressures, and viscosities when utilized together. However, not all PD pumps are the same. In addition, not every pump is suitable for every application.

The two most common technologies for sanitary PD applications are rotary lobe and circumferential piston pumps. They are nearly similar, and depending on the manufacturer, these two pumps can be built with identical components such as shafts and housings.

Positive displacement twin screw pumps are being utilized more often in food and beverage applications. The two-spindle configuration causes the product to move axially. Reduced pulsation in this pump minimizes pump wear and enhances product handling. Twin screw pumps are the costliest of the three varieties of PD pumps.
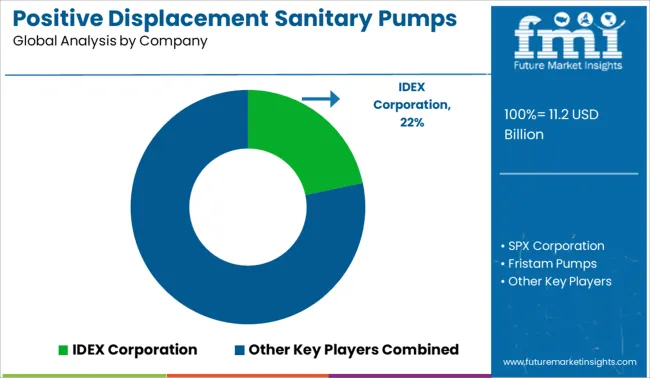
Competitive Analysis

Among the leading players in the global Positive Displacement Sanitary Pumps market are SPX Corporation, Fristam Pumps, IDEX Corporation, Alfa Laval AB, and PSG Dover. To gain a competitive advantage in the industry, these market players are investing in product launches, partnerships, mergers and acquisitions, and expansions.

Due to the growing demand for the product around the world, many new companies are expected to enter the market. This is expected to increase competition on a worldwide scale. Additionally, market growth is expected to be fueled by collaborations among current players to improve quality throughout the research period. Over the projection period, established market players are expected to diversify their portfolios and offer one-stop solutions to combat fierce competition.

  • In September 2021, Flotronic Pumps, a UK-based specialist manufacturer of PD sanitary pumps, air driven double diaphragm pumps, and components, has been acquired by Unibloc Pump. The innovative single bolt design of Flotronic Pumps lowers process downtime by simplifying pump assembly and disassembly, resulting in lower running costs and best-in-class air pump performance.
  • In June 2021, Anderson Process has acquired Premier Pump Inc., a long-standing Cleveland pump distributor and service provider. The acquisition is being made to capitalize on the two firms' complementary product and service capabilities, as well as to support Anderson Process's aim of becoming one of the Midwest's largest and most comprehensive specialized process equipment distributors. Premier Pump Inc.'s purchase will broaden the company's reach and provide assistance in the Eastern Midwest zone.

Similarly, recent developments related to companies in Positive Displacement Sanitary Pumps services have been tracked by the team at Future Market Insights, which are available in the full report.

Market Segments Covered in Positive Displacement Sanitary Pumps Analysis

By Pump Type:

  • Rotary Positive Displacement Sanitary Pumps
    • Rotary Lobe
    • Twin Screw
    • Progressive Cavity
    • Eccentric Disc
    • Gear
    • Sinusoidal
    • Hose
  • Reciprocating Positive Displacement Sanitary Pumps
    • Piston/Plunger
    • Diaphragm

By End-Use:

  • Food & Beverage
  • Pharmaceutical
  • Cosmetics
  • Biotechnology
  • Water Treatment Systems
  • Textile
  • Others

By Region:

  • North America
  • Europe
  • Asia Pacific
  • Middle East and Africa
  • Latin America

Frequently Asked Questions

How much is the current worth of the Positive Displacement Sanitary Pumps Market?

The global Positive Displacement Sanitary Pumps Market is worth more than US$ 7.8 Bn at present.

What is the forecast of sales for Positive Displacement Sanitary Pumps Market?

Value of Positive Displacement Sanitary Pumps Market are projected to increase at a CAGR of around 8.9% during 2022 – 2032.

What was the last 5 year’s market CAGR?

Value of Positive Displacement Sanitary Pumps Market increased at a CAGR of around 9.5% during 2017 – 2021.

What is a key trend shaping the growth of Positive Displacement Sanitary Pumps Market?

Rising consumer demand for processed foods in both developed and emerging nations, as well as greater consumer and food industry awareness of the need of sanitary standards, stands as the key trend in Positive Displacement Sanitary Pumps market.

Table of Content

1. Executive Summary

    1.1. Global Market Outlook

    1.2. Demand-side Trends

    1.3. Supply-side Trends

    1.4. Technology Roadmap Analysis

    1.5. Analysis and Recommendations

2. Market Overview

    2.1. Market Coverage / Taxonomy

    2.2. Market Definition / Scope / Limitations

3. Market Background

    3.1. Market Dynamics

        3.1.1. Drivers

        3.1.2. Restraints

        3.1.3. Opportunity

        3.1.4. Trends

    3.2. Scenario Forecast

        3.2.1. Demand in Optimistic Scenario

        3.2.2. Demand in Likely Scenario

        3.2.3. Demand in Conservative Scenario

    3.3. Opportunity Map Analysis

    3.4. Investment Feasibility Matrix

    3.5. PESTLE and Porter’s Analysis

    3.6. Regulatory Landscape

        3.6.1. By Key Regions

        3.6.2. By Key Countries

4. Global Positive Displacement Sanitary Pumps Market Analysis 2017-2021 and Forecast, 2022-2032

    4.1. Historical Market Size Value (US$ Mn) Analysis, 2017-2021

    4.2. Current and Future Market Size Value (US$ Mn) Projections, 2022-2032

        4.2.1. Y-o-Y Growth Trend Analysis

        4.2.2. Absolute $ Opportunity Analysis

5. Global Positive Displacement Sanitary Pumps Market Analysis 2017-2021 and Forecast 2022-2032, By Pump Type

    5.1. Introduction / Key Findings

    5.2. Historical Market Size Value (US$ Mn) Analysis By Pump Type, 2017-2021

    5.3. Current and Future Market Size Value (US$ Mn) Analysis and Forecast By Pump Type, 2022-2032

        5.3.1. Rotary

            5.3.1.1. Rotary Lobe

            5.3.1.2. Twin Screw

            5.3.1.3. Progressive Cavity

            5.3.1.4. Eccentric Disc

            5.3.1.5. Gear

            5.3.1.6. Sinusoidal

            5.3.1.7. Hose

        5.3.2. Reciprocating

            5.3.2.1. Piston/ Plunger

            5.3.2.2. Diaphragm

    5.4. Y-o-Y Growth Trend Analysis By Pump Type, 2017-2021

    5.5. Absolute $ Opportunity Analysis By Pump Type, 2022-2032

6. Global Positive Displacement Sanitary Pumps Market Analysis 2017-2021 and Forecast 2022-2032, By End Use

    6.1. Introduction / Key Findings

    6.2. Historical Market Size Value (US$ Mn) Analysis By End Use, 2017-2021

    6.3. Current and Future Market Size Value (US$ Mn) Analysis and Forecast By End Use, 2022-2032

        6.3.1. Food & Beverage

        6.3.2. Pharmaceutical

        6.3.3. Cosmetics

        6.3.4. Biotechnology

        6.3.5. Water Treatment Systems

        6.3.6. Textile

        6.3.7. Others

    6.4. Y-o-Y Growth Trend Analysis By End Use, 2017-2021

    6.5. Absolute $ Opportunity Analysis By End Use, 2022-2032

7. Global Positive Displacement Sanitary Pumps Market Analysis 2017-2021 and Forecast 2022-2032, By Region

    7.1. Introduction

    7.2. Historical Market Size Value (US$ Mn) Analysis By Region, 2017-2021

    7.3. Current Market Size Value (US$ Mn) Analysis and Forecast By Region, 2022-2032

        7.3.1. North America

        7.3.2. Latin America

        7.3.3. Europe

        7.3.4. Asia Pacific

        7.3.5. MEA

    7.4. Market Attractiveness Analysis By Region

8. North America Positive Displacement Sanitary Pumps Market Analysis 2017-2021 and Forecast 2022-2032, By Country

    8.1. Historical Market Size Value (US$ Mn) Trend Analysis By Market Taxonomy, 2017-2021

    8.2. Market Size Value (US$ Mn) Forecast By Market Taxonomy, 2022-2032

        8.2.1. By Country

            8.2.1.1. U.S.

            8.2.1.2. Canada

        8.2.2. By Pump Type

        8.2.3. By End Use

    8.3. Market Attractiveness Analysis

        8.3.1. By Country

        8.3.2. By Pump Type

        8.3.3. By End Use

    8.4. Key Takeaways

9. Latin America Positive Displacement Sanitary Pumps Market Analysis 2017-2021 and Forecast 2022-2032, By Country

    9.1. Historical Market Size Value (US$ Mn) Trend Analysis By Market Taxonomy, 2017-2021

    9.2. Market Size Value (US$ Mn) Forecast By Market Taxonomy, 2022-2032

        9.2.1. By Country

            9.2.1.1. Brazil

            9.2.1.2. Mexico

            9.2.1.3. Rest of Latin America

        9.2.2. By Pump Type

        9.2.3. By End Use

    9.3. Market Attractiveness Analysis

        9.3.1. By Country

        9.3.2. By Pump Type

        9.3.3. By End Use

    9.4. Key Takeaways

10. Europe Positive Displacement Sanitary Pumps Market Analysis 2017-2021 and Forecast 2022-2032, By Country

    10.1. Historical Market Size Value (US$ Mn) Trend Analysis By Market Taxonomy, 2017-2021

    10.2. Market Size Value (US$ Mn) Forecast By Market Taxonomy, 2022-2032

        10.2.1. By Country

            10.2.1.1. Germany

            10.2.1.2. Italy

            10.2.1.3. France

            10.2.1.4. U.K.

            10.2.1.5. Spain

            10.2.1.6. Russia

            10.2.1.7. BENELUX

            10.2.1.8. Rest of Europe

        10.2.2. By Pump Type

        10.2.3. By End Use

    10.3. Market Attractiveness Analysis

        10.3.1. By Country

        10.3.2. By Pump Type

        10.3.3. By End Use

    10.4. Key Takeaways

11. Asia Pacific Positive Displacement Sanitary Pumps Market Analysis 2017-2021 and Forecast 2022-2032, By Country

    11.1. Historical Market Size Value (US$ Mn) Trend Analysis By Market Taxonomy, 2017-2021

    11.2. Market Size Value (US$ Mn) Forecast By Market Taxonomy, 2022-2032

        11.2.1. By Country

            11.2.1.1. China

            11.2.1.2. Japan

            11.2.1.3. South Korea

            11.2.1.4. India

            11.2.1.5. Rest of Asia Pacific

        11.2.2. By Pump Type

        11.2.3. By End Use

    11.3. Market Attractiveness Analysis

        11.3.1. By Country

        11.3.2. By Pump Type

        11.3.3. By End Use

    11.4. Key Takeaways

12. MEA Positive Displacement Sanitary Pumps Market Analysis 2017-2021 and Forecast 2022-2032, By Country

    12.1. Historical Market Size Value (US$ Mn) Trend Analysis By Market Taxonomy, 2017-2021

    12.2. Market Size Value (US$ Mn) Forecast By Market Taxonomy, 2022-2032

        12.2.1. By Country

            12.2.1.1. GCC

            12.2.1.2. Rest of MEA

        12.2.2. By Pump Type

        12.2.3. By End Use

    12.3. Market Attractiveness Analysis

        12.3.1. By Country

        12.3.2. By Pump Type

        12.3.3. By End Use

    12.4. Key Takeaways

13. Key Countries Positive Displacement Sanitary Pumps Market Analysis

    13.1. U.S.

        13.1.1. Pricing Analysis

        13.1.2. Market Share Analysis, 2021

            13.1.2.1. By Pump Type

            13.1.2.2. By End Use

    13.2. Canada

        13.2.1. Pricing Analysis

        13.2.2. Market Share Analysis, 2021

            13.2.2.1. By Pump Type

            13.2.2.2. By End Use

    13.3. Brazil

        13.3.1. Pricing Analysis

        13.3.2. Market Share Analysis, 2021

            13.3.2.1. By Pump Type

            13.3.2.2. By End Use

    13.4. Mexico

        13.4.1. Pricing Analysis

        13.4.2. Market Share Analysis, 2021

            13.4.2.1. By Pump Type

            13.4.2.2. By End Use

    13.5. Argentina

        13.5.1. Pricing Analysis

        13.5.2. Market Share Analysis, 2021

            13.5.2.1. By Pump Type

            13.5.2.2. By End Use

    13.6. Germany

        13.6.1. Pricing Analysis

        13.6.2. Market Share Analysis, 2021

            13.6.2.1. By Pump Type

            13.6.2.2. By End Use

    13.7. Italy

        13.7.1. Pricing Analysis

        13.7.2. Market Share Analysis, 2021

            13.7.2.1. By Pump Type

            13.7.2.2. By End Use

    13.8. France

        13.8.1. Pricing Analysis

        13.8.2. Market Share Analysis, 2021

            13.8.2.1. By Pump Type

            13.8.2.2. By End Use

    13.9. U.K.

        13.9.1. Pricing Analysis

        13.9.2. Market Share Analysis, 2021

            13.9.2.1. By Pump Type

            13.9.2.2. By End Use

    13.10. Spain

        13.10.1. Pricing Analysis

        13.10.2. Market Share Analysis, 2021

            13.10.2.1. By Pump Type

            13.10.2.2. By End Use

    13.11. Russia

        13.11.1. Pricing Analysis

        13.11.2. Market Share Analysis, 2021

            13.11.2.1. By Pump Type

            13.11.2.2. By End Use

    13.12. BENELUX

        13.12.1. Pricing Analysis

        13.12.2. Market Share Analysis, 2021

            13.12.2.1. By Pump Type

            13.12.2.2. By End Use

    13.13. China

        13.13.1. Pricing Analysis

        13.13.2. Market Share Analysis, 2021

            13.13.2.1. By Pump Type

            13.13.2.2. By End Use

    13.14. Japan

        13.14.1. Pricing Analysis

        13.14.2. Market Share Analysis, 2021

            13.14.2.1. By Pump Type

            13.14.2.2. By End Use

    13.15. South Korea

        13.15.1. Pricing Analysis

        13.15.2. Market Share Analysis, 2021

            13.15.2.1. By Pump Type

            13.15.2.2. By End Use

    13.16. India

        13.16.1. Pricing Analysis

        13.16.2. Market Share Analysis, 2021

            13.16.2.1. By Pump Type

            13.16.2.2. By End Use

    13.17. GCC Countries

        13.17.1. Pricing Analysis

        13.17.2. Market Share Analysis, 2021

            13.17.2.1. By Pump Type

            13.17.2.2. By End Use

14. Market Structure Analysis

    14.1. Competition Dashboard

    14.2. Competition Benchmarking

    14.3. Market Share Analysis of Top Players

        14.3.1. By Regional

        14.3.2. By Pump Type

        14.3.3. By End Use

15. Competition Analysis

    15.1. Competition Deep Dive

        15.1.1. IDEX Corporation

            15.1.1.1. Overview

            15.1.1.2. Product Portfolio

            15.1.1.3. Profitability by Market Segment

            15.1.1.4. Sales Footprint

            15.1.1.5. Strategy Overview

                15.1.1.5.1. Marketing Strategy

                15.1.1.5.2. Product Strategy

        15.1.2. SPX Corporation

            15.1.2.1. Overview

            15.1.2.2. Product Portfolio

            15.1.2.3. Profitability by Market Segment

            15.1.2.4. Sales Footprint

            15.1.2.5. Strategy Overview

                15.1.2.5.1. Marketing Strategy

                15.1.2.5.2. Product Strategy

        15.1.3. Fristam Pumps

            15.1.3.1. Overview

            15.1.3.2. Product Portfolio

            15.1.3.3. Profitability by Market Segment

            15.1.3.4. Sales Footprint

            15.1.3.5. Strategy Overview

                15.1.3.5.1. Marketing Strategy

                15.1.3.5.2. Product Strategy

        15.1.4. Xylem, Inc.

            15.1.4.1. Overview

            15.1.4.2. Product Portfolio

            15.1.4.3. Profitability by Market Segment

            15.1.4.4. Sales Footprint

            15.1.4.5. Strategy Overview

                15.1.4.5.1. Marketing Strategy

                15.1.4.5.2. Product Strategy

        15.1.5. PSG Dover

            15.1.5.1. Overview

            15.1.5.2. Product Portfolio

            15.1.5.3. Profitability by Market Segment

            15.1.5.4. Sales Footprint

            15.1.5.5. Strategy Overview

                15.1.5.5.1. Marketing Strategy

                15.1.5.5.2. Product Strategy

        15.1.6. Alfa Laval AB

            15.1.6.1. Overview

            15.1.6.2. Product Portfolio

            15.1.6.3. Profitability by Market Segment

            15.1.6.4. Sales Footprint

            15.1.6.5. Strategy Overview

                15.1.6.5.1. Marketing Strategy

                15.1.6.5.2. Product Strategy

        15.1.7. ITT Corporation

            15.1.7.1. Overview

            15.1.7.2. Product Portfolio

            15.1.7.3. Profitability by Market Segment

            15.1.7.4. Sales Footprint

            15.1.7.5. Strategy Overview

                15.1.7.5.1. Marketing Strategy

                15.1.7.5.2. Product Strategy

        15.1.8. Ampco Pumps GmbH

            15.1.8.1. Overview

            15.1.8.2. Product Portfolio

            15.1.8.3. Profitability by Market Segment

            15.1.8.4. Sales Footprint

            15.1.8.5. Strategy Overview

                15.1.8.5.1. Marketing Strategy

                15.1.8.5.2. Product Strategy

        15.1.9. KSB AG

            15.1.9.1. Overview

            15.1.9.2. Product Portfolio

            15.1.9.3. Profitability by Market Segment

            15.1.9.4. Sales Footprint

            15.1.9.5. Strategy Overview

                15.1.9.5.1. Marketing Strategy

                15.1.9.5.2. Product Strategy

        15.1.10. Axiflow Technologies, Inc.

            15.1.10.1. Overview

            15.1.10.2. Product Portfolio

            15.1.10.3. Profitability by Market Segment

            15.1.10.4. Sales Footprint

            15.1.10.5. Strategy Overview

                15.1.10.5.1. Marketing Strategy

                15.1.10.5.2. Product Strategy

        15.1.11. Sulzer Ltd.

            15.1.11.1. Overview

            15.1.11.2. Product Portfolio

            15.1.11.3. Profitability by Market Segment

            15.1.11.4. Sales Footprint

            15.1.11.5. Strategy Overview

                15.1.11.5.1. Marketing Strategy

                15.1.11.5.2. Product Strategy

        15.1.12. Nakakin Co. Ltd.

            15.1.12.1. Overview

            15.1.12.2. Product Portfolio

            15.1.12.3. Profitability by Market Segment

            15.1.12.4. Sales Footprint

            15.1.12.5. Strategy Overview

                15.1.12.5.1. Marketing Strategy

                15.1.12.5.2. Product Strategy

16. Assumptions & Acronyms Used

17. Research Methodology

List of Tables

Table 1: Global Positive Displacement Sanitary Pumps Market Value (US$ Mn) Forecast by Region, 2017-2032

Table 2: Global Positive Displacement Sanitary Pumps Market Value (US$ Mn) Forecast by Pump Type, 2017-2032

Table 3: Global Positive Displacement Sanitary Pumps Market Value (US$ Mn) Forecast by End Use, 2017-2032

Table 4: North America Positive Displacement Sanitary Pumps Market Value (US$ Mn) Forecast by Country, 2017-2032

Table 5: North America Positive Displacement Sanitary Pumps Market Value (US$ Mn) Forecast by Pump Type, 2017-2032

Table 6: North America Positive Displacement Sanitary Pumps Market Value (US$ Mn) Forecast by End Use, 2017-2032

Table 7: Latin America Positive Displacement Sanitary Pumps Market Value (US$ Mn) Forecast by Country, 2017-2032

Table 8: Latin America Positive Displacement Sanitary Pumps Market Value (US$ Mn) Forecast by Pump Type, 2017-2032

Table 9: Latin America Positive Displacement Sanitary Pumps Market Value (US$ Mn) Forecast by End Use, 2017-2032

Table 10: Europe Positive Displacement Sanitary Pumps Market Value (US$ Mn) Forecast by Country, 2017-2032

Table 11: Europe Positive Displacement Sanitary Pumps Market Value (US$ Mn) Forecast by Pump Type, 2017-2032

Table 12: Europe Positive Displacement Sanitary Pumps Market Value (US$ Mn) Forecast by End Use, 2017-2032

Table 13: Asia Pacific Positive Displacement Sanitary Pumps Market Value (US$ Mn) Forecast by Country, 2017-2032

Table 14: Asia Pacific Positive Displacement Sanitary Pumps Market Value (US$ Mn) Forecast by Pump Type, 2017-2032

Table 15: Asia Pacific Positive Displacement Sanitary Pumps Market Value (US$ Mn) Forecast by End Use, 2017-2032

Table 16: MEA Positive Displacement Sanitary Pumps Market Value (US$ Mn) Forecast by Country, 2017-2032

Table 17: MEA Positive Displacement Sanitary Pumps Market Value (US$ Mn) Forecast by Pump Type, 2017-2032

Table 18: MEA Positive Displacement Sanitary Pumps Market Value (US$ Mn) Forecast by End Use, 2017-2032

List of Charts

Figure 1: Global Positive Displacement Sanitary Pumps Market Value (US$ Mn) by Pump Type, 2022-2032

Figure 2: Global Positive Displacement Sanitary Pumps Market Value (US$ Mn) by End Use, 2022-2032

Figure 3: Global Positive Displacement Sanitary Pumps Market Value (US$ Mn) by Region, 2022-2032

Figure 4: Global Positive Displacement Sanitary Pumps Market Value (US$ Mn) Analysis by Region, 2017-2032

Figure 5: Global Positive Displacement Sanitary Pumps Market Value Share (%) and BPS Analysis by Region, 2022-2032

Figure 6: Global Positive Displacement Sanitary Pumps Market Y-o-Y Growth (%) Projections by Region, 2022-2032

Figure 7: Global Positive Displacement Sanitary Pumps Market Value (US$ Mn) Analysis by Pump Type, 2017-2032

Figure 8: Global Positive Displacement Sanitary Pumps Market Value Share (%) and BPS Analysis by Pump Type, 2022-2032

Figure 9: Global Positive Displacement Sanitary Pumps Market Y-o-Y Growth (%) Projections by Pump Type, 2022-2032

Figure 10: Global Positive Displacement Sanitary Pumps Market Value (US$ Mn) Analysis by End Use, 2017-2032

Figure 11: Global Positive Displacement Sanitary Pumps Market Value Share (%) and BPS Analysis by End Use, 2022-2032

Figure 12: Global Positive Displacement Sanitary Pumps Market Y-o-Y Growth (%) Projections by End Use, 2022-2032

Figure 13: Global Positive Displacement Sanitary Pumps Market Attractiveness by Pump Type, 2022-2032

Figure 14: Global Positive Displacement Sanitary Pumps Market Attractiveness by End Use, 2022-2032

Figure 15: Global Positive Displacement Sanitary Pumps Market Attractiveness by Region, 2022-2032

Figure 16: North America Positive Displacement Sanitary Pumps Market Value (US$ Mn) by Pump Type, 2022-2032

Figure 17: North America Positive Displacement Sanitary Pumps Market Value (US$ Mn) by End Use, 2022-2032

Figure 18: North America Positive Displacement Sanitary Pumps Market Value (US$ Mn) by Country, 2022-2032

Figure 19: North America Positive Displacement Sanitary Pumps Market Value (US$ Mn) Analysis by Country, 2017-2032

Figure 20: North America Positive Displacement Sanitary Pumps Market Value Share (%) and BPS Analysis by Country, 2022-2032

Figure 21: North America Positive Displacement Sanitary Pumps Market Y-o-Y Growth (%) Projections by Country, 2022-2032

Figure 22: North America Positive Displacement Sanitary Pumps Market Value (US$ Mn) Analysis by Pump Type, 2017-2032

Figure 23: North America Positive Displacement Sanitary Pumps Market Value Share (%) and BPS Analysis by Pump Type, 2022-2032

Figure 24: North America Positive Displacement Sanitary Pumps Market Y-o-Y Growth (%) Projections by Pump Type, 2022-2032

Figure 25: North America Positive Displacement Sanitary Pumps Market Value (US$ Mn) Analysis by End Use, 2017-2032

Figure 26: North America Positive Displacement Sanitary Pumps Market Value Share (%) and BPS Analysis by End Use, 2022-2032

Figure 27: North America Positive Displacement Sanitary Pumps Market Y-o-Y Growth (%) Projections by End Use, 2022-2032

Figure 28: North America Positive Displacement Sanitary Pumps Market Attractiveness by Pump Type, 2022-2032

Figure 29: North America Positive Displacement Sanitary Pumps Market Attractiveness by End Use, 2022-2032

Figure 30: North America Positive Displacement Sanitary Pumps Market Attractiveness by Country, 2022-2032

Figure 31: Latin America Positive Displacement Sanitary Pumps Market Value (US$ Mn) by Pump Type, 2022-2032

Figure 32: Latin America Positive Displacement Sanitary Pumps Market Value (US$ Mn) by End Use, 2022-2032

Figure 33: Latin America Positive Displacement Sanitary Pumps Market Value (US$ Mn) by Country, 2022-2032

Figure 34: Latin America Positive Displacement Sanitary Pumps Market Value (US$ Mn) Analysis by Country, 2017-2032

Figure 35: Latin America Positive Displacement Sanitary Pumps Market Value Share (%) and BPS Analysis by Country, 2022-2032

Figure 36: Latin America Positive Displacement Sanitary Pumps Market Y-o-Y Growth (%) Projections by Country, 2022-2032

Figure 37: Latin America Positive Displacement Sanitary Pumps Market Value (US$ Mn) Analysis by Pump Type, 2017-2032

Figure 38: Latin America Positive Displacement Sanitary Pumps Market Value Share (%) and BPS Analysis by Pump Type, 2022-2032

Figure 39: Latin America Positive Displacement Sanitary Pumps Market Y-o-Y Growth (%) Projections by Pump Type, 2022-2032

Figure 40: Latin America Positive Displacement Sanitary Pumps Market Value (US$ Mn) Analysis by End Use, 2017-2032

Figure 41: Latin America Positive Displacement Sanitary Pumps Market Value Share (%) and BPS Analysis by End Use, 2022-2032

Figure 42: Latin America Positive Displacement Sanitary Pumps Market Y-o-Y Growth (%) Projections by End Use, 2022-2032

Figure 43: Latin America Positive Displacement Sanitary Pumps Market Attractiveness by Pump Type, 2022-2032

Figure 44: Latin America Positive Displacement Sanitary Pumps Market Attractiveness by End Use, 2022-2032

Figure 45: Latin America Positive Displacement Sanitary Pumps Market Attractiveness by Country, 2022-2032

Figure 46: Europe Positive Displacement Sanitary Pumps Market Value (US$ Mn) by Pump Type, 2022-2032

Figure 47: Europe Positive Displacement Sanitary Pumps Market Value (US$ Mn) by End Use, 2022-2032

Figure 48: Europe Positive Displacement Sanitary Pumps Market Value (US$ Mn) by Country, 2022-2032

Figure 49: Europe Positive Displacement Sanitary Pumps Market Value (US$ Mn) Analysis by Country, 2017-2032

Figure 50: Europe Positive Displacement Sanitary Pumps Market Value Share (%) and BPS Analysis by Country, 2022-2032

Figure 51: Europe Positive Displacement Sanitary Pumps Market Y-o-Y Growth (%) Projections by Country, 2022-2032

Figure 52: Europe Positive Displacement Sanitary Pumps Market Value (US$ Mn) Analysis by Pump Type, 2017-2032

Figure 53: Europe Positive Displacement Sanitary Pumps Market Value Share (%) and BPS Analysis by Pump Type, 2022-2032

Figure 54: Europe Positive Displacement Sanitary Pumps Market Y-o-Y Growth (%) Projections by Pump Type, 2022-2032

Figure 55: Europe Positive Displacement Sanitary Pumps Market Value (US$ Mn) Analysis by End Use, 2017-2032

Figure 56: Europe Positive Displacement Sanitary Pumps Market Value Share (%) and BPS Analysis by End Use, 2022-2032

Figure 57: Europe Positive Displacement Sanitary Pumps Market Y-o-Y Growth (%) Projections by End Use, 2022-2032

Figure 58: Europe Positive Displacement Sanitary Pumps Market Attractiveness by Pump Type, 2022-2032

Figure 59: Europe Positive Displacement Sanitary Pumps Market Attractiveness by End Use, 2022-2032

Figure 60: Europe Positive Displacement Sanitary Pumps Market Attractiveness by Country, 2022-2032

Figure 61: Asia Pacific Positive Displacement Sanitary Pumps Market Value (US$ Mn) by Pump Type, 2022-2032

Figure 62: Asia Pacific Positive Displacement Sanitary Pumps Market Value (US$ Mn) by End Use, 2022-2032

Figure 63: Asia Pacific Positive Displacement Sanitary Pumps Market Value (US$ Mn) by Country, 2022-2032

Figure 64: Asia Pacific Positive Displacement Sanitary Pumps Market Value (US$ Mn) Analysis by Country, 2017-2032

Figure 65: Asia Pacific Positive Displacement Sanitary Pumps Market Value Share (%) and BPS Analysis by Country, 2022-2032

Figure 66: Asia Pacific Positive Displacement Sanitary Pumps Market Y-o-Y Growth (%) Projections by Country, 2022-2032

Figure 67: Asia Pacific Positive Displacement Sanitary Pumps Market Value (US$ Mn) Analysis by Pump Type, 2017-2032

Figure 68: Asia Pacific Positive Displacement Sanitary Pumps Market Value Share (%) and BPS Analysis by Pump Type, 2022-2032

Figure 69: Asia Pacific Positive Displacement Sanitary Pumps Market Y-o-Y Growth (%) Projections by Pump Type, 2022-2032

Figure 70: Asia Pacific Positive Displacement Sanitary Pumps Market Value (US$ Mn) Analysis by End Use, 2017-2032

Figure 71: Asia Pacific Positive Displacement Sanitary Pumps Market Value Share (%) and BPS Analysis by End Use, 2022-2032

Figure 72: Asia Pacific Positive Displacement Sanitary Pumps Market Y-o-Y Growth (%) Projections by End Use, 2022-2032

Figure 73: Asia Pacific Positive Displacement Sanitary Pumps Market Attractiveness by Pump Type, 2022-2032

Figure 74: Asia Pacific Positive Displacement Sanitary Pumps Market Attractiveness by End Use, 2022-2032

Figure 75: Asia Pacific Positive Displacement Sanitary Pumps Market Attractiveness by Country, 2022-2032

Figure 76: MEA Positive Displacement Sanitary Pumps Market Value (US$ Mn) by Pump Type, 2022-2032

Figure 77: MEA Positive Displacement Sanitary Pumps Market Value (US$ Mn) by End Use, 2022-2032

Figure 78: MEA Positive Displacement Sanitary Pumps Market Value (US$ Mn) by Country, 2022-2032

Figure 79: MEA Positive Displacement Sanitary Pumps Market Value (US$ Mn) Analysis by Country, 2017-2032

Figure 80: MEA Positive Displacement Sanitary Pumps Market Value Share (%) and BPS Analysis by Country, 2022-2032

Figure 81: MEA Positive Displacement Sanitary Pumps Market Y-o-Y Growth (%) Projections by Country, 2022-2032

Figure 82: MEA Positive Displacement Sanitary Pumps Market Value (US$ Mn) Analysis by Pump Type, 2017-2032

Figure 83: MEA Positive Displacement Sanitary Pumps Market Value Share (%) and BPS Analysis by Pump Type, 2022-2032

Figure 84: MEA Positive Displacement Sanitary Pumps Market Y-o-Y Growth (%) Projections by Pump Type, 2022-2032

Figure 85: MEA Positive Displacement Sanitary Pumps Market Value (US$ Mn) Analysis by End Use, 2017-2032

Figure 86: MEA Positive Displacement Sanitary Pumps Market Value Share (%) and BPS Analysis by End Use, 2022-2032

Figure 87: MEA Positive Displacement Sanitary Pumps Market Y-o-Y Growth (%) Projections by End Use, 2022-2032

Figure 88: MEA Positive Displacement Sanitary Pumps Market Attractiveness by Pump Type, 2022-2032

Figure 89: MEA Positive Displacement Sanitary Pumps Market Attractiveness by End Use, 2022-2032

Figure 90: MEA Positive Displacement Sanitary Pumps Market Attractiveness by Country, 2022-2032

Explore Technology Insights

View Reports

Positive Displacement Sanitary Pumps Market