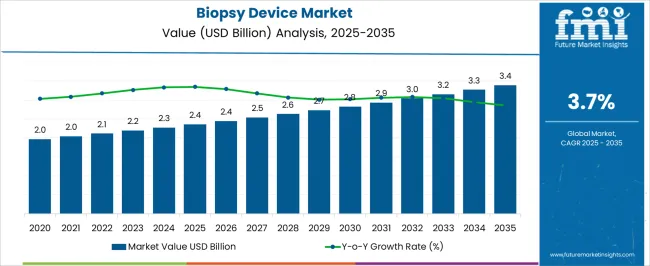
The Biopsy Device Market is estimated to be valued at USD 2.4 billion in 2025 and is projected to reach USD 3.4 billion by 2035, registering a compound annual growth rate (CAGR) of 3.7% over the forecast period.
The Biopsy Device market is experiencing steady growth, driven by the increasing prevalence of chronic diseases and cancer, which necessitate accurate and minimally invasive diagnostic procedures. Rising adoption of advanced biopsy technologies for early detection is supporting market expansion, particularly in oncology, cardiology, and pathology applications. Innovations in needle design, imaging guidance, and automated sample collection are enhancing procedural accuracy, patient safety, and operational efficiency.
Hospitals and diagnostic centers are increasingly integrating biopsy devices into standard clinical workflows to improve diagnostic confidence and reduce turnaround times. Regulatory support and guidelines promoting early detection and personalized treatment further encourage adoption. The market is also being shaped by growing awareness among clinicians and patients regarding minimally invasive diagnostic alternatives, which reduce recovery time and procedural risk.
Continuous investment in research and development, combined with rising healthcare infrastructure in emerging and developed regions, is positioning the Biopsy Device market for sustained growth As healthcare providers prioritize precision diagnostics and patient-centered care, demand for reliable, high-quality biopsy devices is expected to remain strong.
| Metric | Value |
|---|---|
| Biopsy Device Market Estimated Value in (2025 E) | USD 2.4 billion |
| Biopsy Device Market Forecast Value in (2035 F) | USD 3.4 billion |
| Forecast CAGR (2025 to 2035) | 3.7% |
The market is segmented by Product Type, Application, and End Use and region. By Product Type, the market is divided into Needles, Guidance System, Guns, Reagents And Kits, and Others. In terms of Application, the market is classified into Medical Diagnosis and Scientific Research. Based on End Use, the market is segmented into Hospital, Specialized Oncology Centres, Diagnostic Centers, and Research Institutes. Regionally, the market is classified into North America, Latin America, Western Europe, Eastern Europe, Balkan & Baltic Countries, Russia & Belarus, Central Asia, East Asia, South Asia & Pacific, and the Middle East & Africa.
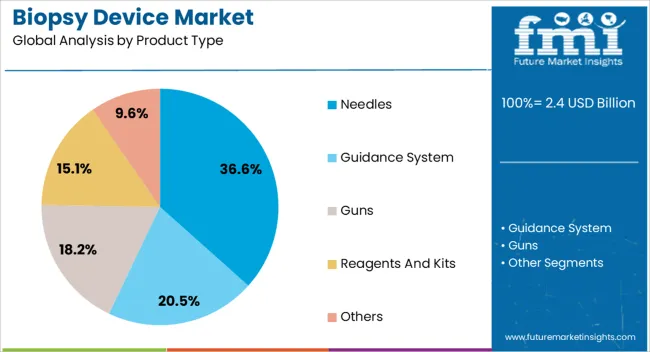
The needles segment is projected to hold 36.6% of the Biopsy Device market revenue in 2025, establishing it as the leading product type. Growth is being driven by the widespread adoption of core needle and fine needle biopsy techniques, which are recognized for their precision, reliability, and minimally invasive nature. These devices allow for accurate tissue sampling while minimizing patient discomfort and risk of complications.
Integration with imaging guidance systems such as ultrasound, CT, and MRI enhances procedural accuracy, further supporting clinical adoption. Advances in needle material, design, and tip geometry are improving sample quality and procedural efficiency.
Hospitals and diagnostic laboratories prefer needle-based biopsy devices due to their compatibility with multiple tissue types and organ sites, as well as their operational cost-effectiveness As demand for accurate and safe diagnostic procedures continues to grow globally, the needles product type is expected to maintain its leadership, supported by ongoing technological improvements and widespread clinical acceptance.
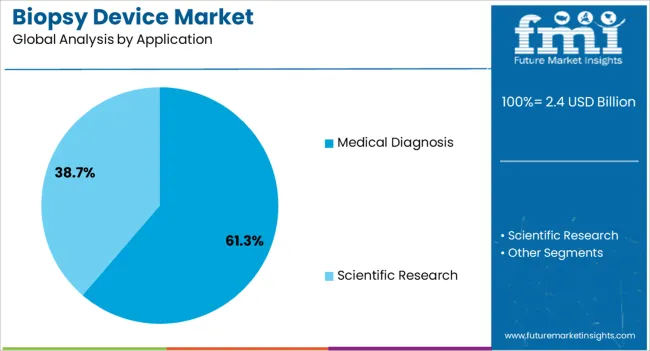
The medical diagnosis application segment is anticipated to account for 61.3% of the Biopsy Device market revenue in 2025, making it the leading application area. Growth is driven by the increasing need for precise and minimally invasive diagnostic procedures to identify cancers, chronic diseases, and other pathological conditions. Biopsy devices enable accurate tissue sampling, which informs treatment planning and improves patient outcomes.
Adoption is being reinforced by advancements in imaging-guided techniques, automation, and disposable device technologies, which enhance procedural efficiency and safety. Hospitals and diagnostic centers are integrating these devices into routine clinical workflows to accelerate diagnosis and reduce turnaround times.
Rising awareness among clinicians about the benefits of early and precise diagnosis, coupled with regulatory support for minimally invasive procedures, is further boosting adoption The medical diagnosis segment is expected to remain the primary driver of market growth, as healthcare systems continue to prioritize accurate diagnostics, patient-centered care, and early disease detection.
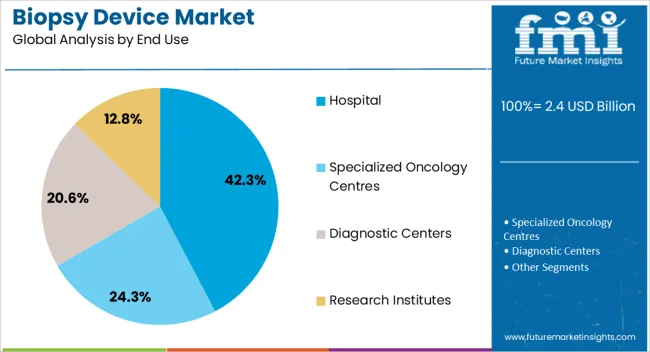
The hospital end-use segment is projected to hold 42.3% of the Biopsy Device market revenue in 2025, establishing it as the leading end-use category. Growth in this segment is being driven by the high demand for biopsy procedures in hospitals, which serve as primary centers for diagnosis and treatment of complex diseases. Hospitals benefit from integrated workflows, access to advanced imaging systems, and trained personnel capable of performing precise, minimally invasive procedures.
Investments in infrastructure and diagnostic capabilities, particularly in emerging regions, are expanding the adoption of biopsy devices in hospital settings. The availability of high-quality, standardized devices ensures consistent diagnostic outcomes and reduces procedural risks.
Hospitals increasingly prefer devices that provide operational efficiency, patient safety, and compatibility with imaging guidance technologies As healthcare systems continue to focus on accurate and timely diagnosis, the hospital segment is expected to maintain its market leadership, supported by rising procedural volumes, technological advancements, and growing emphasis on patient-centered care.
The biopsy device landscape has left a substantial growth legacy from 2020 to 2025. With substantial investments pouring in to develop innovative product lines, a CAGR of 6.4% was observed in the past five years alone.
Based on the conditions prevailing in the market, the biopsy device market yielded revenues worth USD 2,123.4 million in 2025.
The increased number of cancer patients is the foremost market driver during the historical period. The rising prevalence of cancer brought attention to the need for early detection of the disease. Consequently, the demand for biopsy devices surged, driving the subject market.
Various government initiatives to bolster the healthcare sector helped the global biopsy device market propel. Due to measures taken to uplift the industry, many benefits like enhanced monetary support, relieved legal policies, etc., helped the subject market. Hence, this was another important market driver.
| Historical CAGR from 2020 to 2025 | 6.40% |
|---|---|
| Forecast CAGR from 2025 to 2035 | 3.70% |
The forecasted period focuses more on technological advancements. Innovation will be fostered due to technology disruption, helping the subject market propel. In addition, new biopsy devices can be introduced in the market, leveraging innovation.
The increasing prevalence of lifestyle-related diseases and chronic diseases will lead to rising demand for frequent check-ups. Hence, this is another important market driver for the subject industry.
Forecast CAGRs from 2025 to 2035
| Countries | Forecasted CAGR |
|---|---|
| Canada | 2.60% |
| France | 4.30% |
| Spain | 4.10% |
| India | 5.80% |
| Thailand | 4.50% |
| Category | Product Type - Needles |
|---|---|
| Market Share in 2025 | 36.6% |
| Market Segment Drivers |
|
| Category | Application - Medical Diagnosis |
|---|---|
| Market Share in 2025 | 61.3% |
| Market Segment Drivers |
|
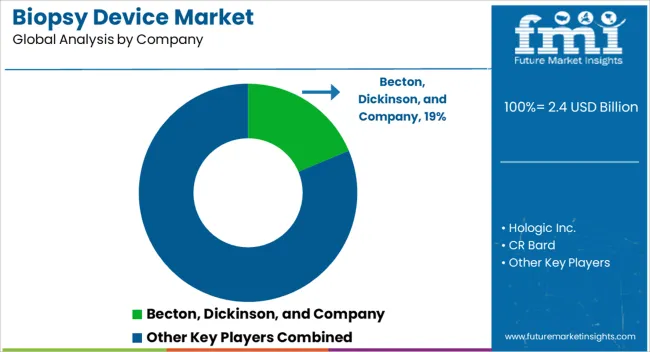
The competitive landscape is robust, leaving little room for emerging marketers to secure significant market share. Consequently, new entrants must focus on automation, technological integration, and product innovation for a decisive market position. Brand positioning must be exclusive for a competitive edge.
Existing market players have been influencing the market drastically with many key expansion strategies. These strategies include product innovation, strategic collaborations, market diversification, global market penetration, and other exclusive business formulations. Due to these key moves, the competitive space of the global biopsy device market could be clearer.
Key Market Developments
| Attributes | Details |
|---|---|
| Estimated Market Size in 2025 | USD 2.4 billion |
| Projected Market Valuation in 2035 | USD 3.4 billion |
| Value-based CAGR 2025 to 2035 | 3.7% |
| Forecast Period | 2025 to 2035 |
| Historical Data Available for | 2020 to 2025 |
| Market Analysis | Value in USD million |
| Key Regions Covered | North America; Latin America; Western Europe; Eastern Europe; South Asia and Pacific; East Asia; The Middle East and Africa |
| Key Market Segments Covered | By Product Type, By Application, By End Use, Region |
| Key Countries Profiled | The United States, Canada, Brazil, Mexico, Germany, The United Kingdom, France, Spain, Italy, Poland, Russia, Czech Republic, Romania, India, Bangladesh, Australia, New Zealand, China, Japan, South Korea, GCC Countries, South Africa, Israel |
| Key Companies Profiled | CR Bard; Becton, Dickinson, and Company; B. Braun Melsungen AG; Hologic Inc.; Cook Medical; Devicor Medical Products Inc.; Argon Medical Inc. |
The global biopsy device market is estimated to be valued at USD 2.4 billion in 2025.
The market size for the biopsy device market is projected to reach USD 3.4 billion by 2035.
The biopsy device market is expected to grow at a 3.7% CAGR between 2025 and 2035.
The key product types in biopsy device market are needles, guidance system, guns, reagents and kits and others.
In terms of application, medical diagnosis segment to command 61.3% share in the biopsy device market in 2025.


Full Research Suite comprises of:
Market outlook & trends analysis
Interviews & case studies
Strategic recommendations
Vendor profiles & capabilities analysis
5-year forecasts
8 regions and 60+ country-level data splits
Market segment data splits
12 months of continuous data updates
DELIVERED AS:
PDF EXCEL ONLINE
Breast Biopsy Devices Market Analysis - Innovations & Forecast 2025 to 2035
Robotic Biopsy Devices Market Insights - Trends & Forecast 2025 to 2035
MRI Compatible Biopsy Devices Market
Biopsy Guidance System Market Size and Share Forecast Outlook 2025 to 2035
Microbiopsy Market Size and Share Forecast Outlook 2025 to 2035
Lung Biopsy Systems Market Size and Share Forecast Outlook 2025 to 2035
Breast Biopsy Market Size and Share Forecast Outlook 2025 to 2035
Cancer Biopsy Market - Growth & Technological Innovations 2025 to 2035
Liquid Biopsy Market Analysis - Size, Share, and Forecast Outlook 2025 to 2035
MRI Safe Biopsy Needle Market
Robotic Lung Biopsy Market Size and Share Forecast Outlook 2025 to 2035
Aspiration & Biopsy Needles Market Analysis - Trends & Forecast 2025 to 2035
Stereotactic Biopsy Tables Market
Cold Disposable Biopsy Forceps Market Growth – Trends & Forecast 2025 to 2035
Endobronchial Ultrasound Biopsy Market Size and Share Forecast Outlook 2025 to 2035
Ultrasound-Guided Breast Biopsy Market Size and Share Forecast Outlook 2025 to 2035
Device-Embedded Biometric Authentication Market Size and Share Forecast Outlook 2025 to 2035
IoT Device Management Market Size and Share Forecast Outlook 2025 to 2035
IoT Device Management Platform Market Size and Share Forecast Outlook 2025 to 2035
Drug Device Combination Products Market Size and Share Forecast Outlook 2025 to 2035

Thank you!
You will receive an email from our Business Development Manager. Please be sure to check your SPAM/JUNK folder too.
Chat With
MaRIA