The Microbiopsy Market is estimated to be valued at USD 180.2 billion in 2025 and is projected to reach USD 340.0 billion by 2035, registering a compound annual growth rate (CAGR) of 6.6% over the forecast period.
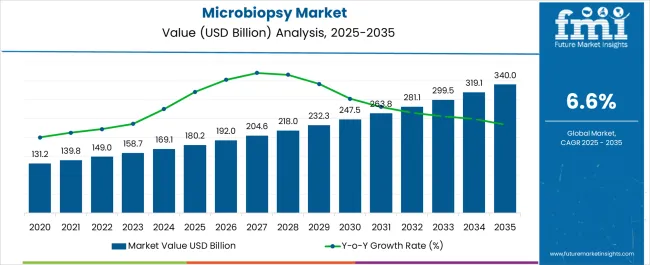
| Metric | Value |
|---|---|
| Microbiopsy Market Estimated Value in (2025 E) | USD 180.2 billion |
| Microbiopsy Market Forecast Value in (2035 F) | USD 340.0 billion |
| Forecast CAGR (2025 to 2035) | 6.6% |
The microbiopsy market is experiencing strong growth driven by increasing prevalence of cancer, advancements in minimally invasive diagnostic procedures, and rising demand for early and accurate disease detection. Growing clinical preference for procedures that reduce patient discomfort, minimize recovery time, and deliver high diagnostic accuracy is strengthening the role of microbiopsy solutions.
Technological improvements in needle design, sample preservation, and imaging guidance are enhancing reliability and adoption across multiple medical specialties. Hospitals and diagnostic centers are prioritizing microbiopsy techniques as part of precision medicine initiatives and early detection programs.
The market outlook remains positive as healthcare systems continue to invest in advanced diagnostic tools that combine patient safety, cost efficiency, and diagnostic precision.
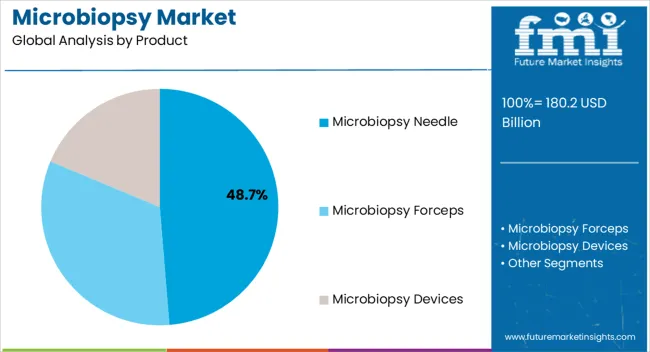
The microbiopsy needle segment is expected to account for 48.70% of total revenue by 2025 within the product category, making it the leading segment. This dominance is supported by its ability to provide high quality tissue samples with minimal invasiveness, reducing patient trauma and improving diagnostic accuracy.
The widespread use of biopsy needles in cancer diagnostics and dermatological applications has reinforced adoption. Furthermore, ongoing product innovations aimed at enhancing precision, usability, and safety have encouraged broader deployment in clinical settings.
These advantages have positioned microbiopsy needles as the preferred choice among available product types.
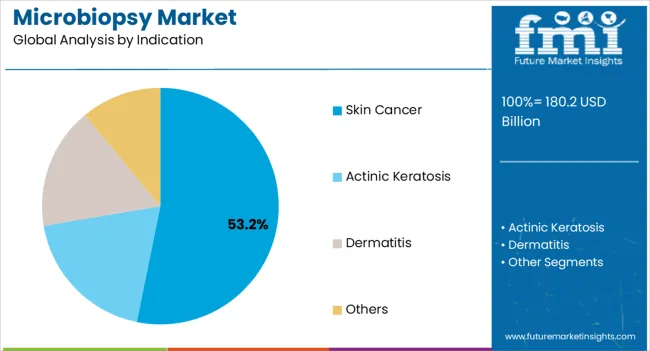
The skin cancer indication segment is projected to hold 53.20% of total revenue by 2025, positioning it as the most significant application area. Growth in this segment is driven by the rising global incidence of skin cancers and heightened awareness of early diagnosis.
Microbiopsy techniques are increasingly valued for their ability to obtain adequate samples while preserving surrounding tissue integrity, which is crucial for dermatological assessments. The demand for minimally invasive diagnostic options in outpatient and hospital settings has further accelerated adoption.
Consequently, skin cancer remains the leading indication supported by both clinical effectiveness and patient centric diagnostic approaches.
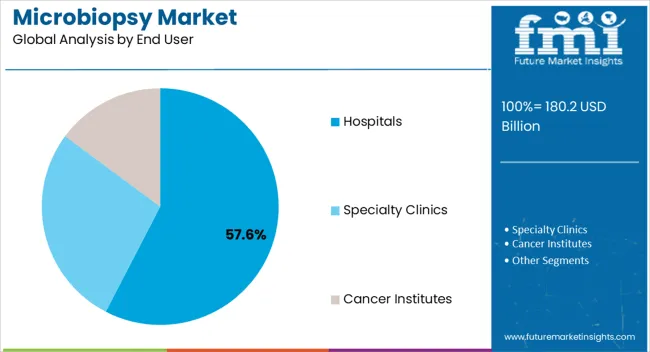
The hospitals segment is estimated to contribute 57.60% of overall market revenue by 2025, emerging as the dominant end user category. This leadership is attributed to the availability of advanced diagnostic infrastructure, skilled professionals, and comprehensive patient care pathways.
Hospitals are the primary centers for oncology and dermatology diagnostics where microbiopsy procedures are frequently conducted. The integration of microbiopsy techniques into hospital-based cancer screening programs and treatment planning has significantly increased uptake.
Strong investment in medical technology and emphasis on precision diagnostics continue to strengthen the role of hospitals as the largest end user segment in this market.
From 2012 to 2025, the global microbiopsy market experienced a CAGR of 5.1%, reaching a market size of USD 180.2 million in 2025.
A minimally invasive biopsy method called microbiopsy includes taking small tissue samples for analysis or research. Microbiopsy technique have evolved within the molecular diagnosis and research arena over the years. From 2012 to 2025, the market for microbiopsy tools and services has expanded steadily. Microbiopsy has been applied in various domain including infectious disease diagnosis like leishmaniasis or viral warts, skin oncology like basel cell carcinoma (BCC) and melanoma.
Future Forecast for Microbiopsy Industry:
Looking ahead, the global microbiopsy industry is expected to rise at a CAGR of 6.9% from 2025 to 2035. During the forecast period, the market size is expected to reach USD 340 million by 2035.
Chronic diseases such as cancer, dermatological conditions, and autoimmune disorders are on the rise globally. Microbiopsy plays a crucial role in the early diagnosis, monitoring, and treatment of these conditions. As the prevalence of chronic diseases continues to increase, the demand for microbiopsy techniques and devices is expected to grow.
Technological advancements have led to the development of more advanced and precise microbiopsy devices. These devices offer improved accuracy, minimal tissue damage, and reduced patient discomfort. The introduction of automated and handheld microbiopsy devices has made the procedure more accessible and efficient. Ongoing research and development in the field are expected to drive further advancements, expanding the market.
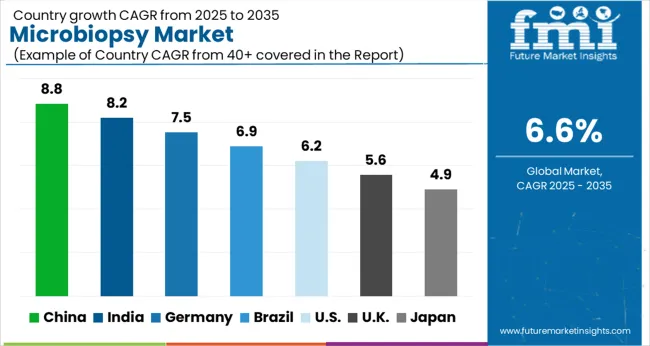
| Country | The United States |
|---|---|
| Market Size (USD million) by End of Forecast Period (2035) | USD 340 million |
| CAGR % 2025 to End of Forecast (2035) | 6.4% |
The microbiopsy industry in the United States is expected to reach a market size of USD 340 million by 2035, expanding at a CAGR of 6.4%. Rising prevalence of cancer, which has led to a higher demand for accurate and minimally invasive diagnostic procedure. Along with technology advancement has contributed to the growth of global market growth.
| Country | The United Kingdom |
|---|---|
| Market Size (USD million) by End of Forecast Period (2035) | USD 15.6 million |
| CAGR % 2025 to End of Forecast (2035) | 6.3% |
The microbiopsy industry in the United Kingdom is expected to reach a market value of USD 15.6 million, expanding at a CAGR of 6.3% during the forecast period. The United Kingdom market is projected to growth of the market due to the growing demand for microbiopsy by healthcare professionals. Also, UK has robust healthcare system with a high focus on innovation which created favorable environment for the growth of the microbiopsy market.
| Country | China |
|---|---|
| Market Size (USD million) by End of Forecast Period (2035) | USD 18.7 million |
| CAGR % 2025 to End of Forecast (2035) | 8.1% |
The microbiopsy industry in China is anticipated to reach a market size of USD 18.7 million, moving at a CAGR of 8.1% during the forecast period. The Chinese government is investing heavily in advancing healthcare infrastructure and technology in the country. Also, private healthcare expenditure on advanced diagnostics has contributed to the growth of microbiopsy market in China.
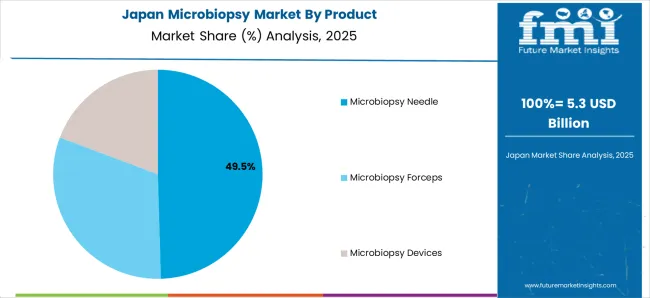
| Country | Japan |
|---|---|
| Market Size (USD million) by End of Forecast Period (2035) | USD 15.2 million |
| CAGR % 2025 to End of Forecast (2035) | 7.4% |
The microbiopsy industry in Japan is estimated to reach a market size of USD 15.2 million by 2035, thriving at a CAGR of 7.4%. Increasing adoption of robotics and biopsy procedures is driving the growth of the market in Japan. These advanced technologies offer greater precision and accuracy, while also reducing the risk of tissue damage and infection.
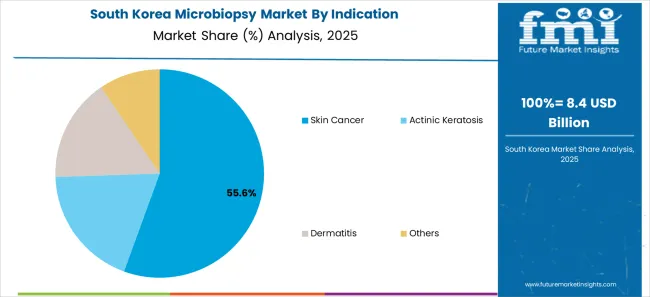
| Country | South Korea |
|---|---|
| Market Size (USD million) by End of Forecast Period (2035) | USD 13.5 million |
| CAGR % 2025 to End of Forecast (2035) | 8.8% |
The microbiopsy industry in South Korea is expected to reach a market size of USD 13.5 million, expanding at a CAGR of 8.8% during the forecast period. The market in South Korea is forecasted to witness growth as government has implemented various initiatives to improve the country’s healthcare system. Also, the rising demand for personalized medicine in south Korea.
The microbiopsy needle is expected to dominate the microbiopsy industry with a CAGR of 8.2% from 2025 to 2035. Microbiopsy needles are made specifically to collect minute tissue samples from selected body parts. These needles include either a tiny needle tip or a cutting edge that allows for regulated and precise tissue collection. For precise diagnosis, research, and treatment planning, the capacity to acquire high-quality tissue samples with little damage or contamination is crucial. The improvement of tissue sampling made possible by microbiopsy needles is what is causing the microbiopsy market to expand.
The skin cancer segment is expected to dominate the microbiopsy industry with a CAGR of 8.2% from 2025 to 2035. One of the most prevalent cancers in the world is skin cancer, which includes melanoma and non-melanoma varieties such basal cell carcinoma and squamous cell carcinoma. A thorough and timely diagnosis is essential for efficient care and better patient outcomes. Tissue samples are typically obtained using microbiopsy procedures such skin punch biopsies or shave biopsies for histopathological analysis and conclusive diagnosis. The market for microbiopsy procedures is expanding as a result of the rising incidence of skin cancer and the increased demand for microbiopsy operations.
The hospital segment is expected to dominate the microbiopsy industry with a CAGR of 6.7% from 2025 to 2035. Key centers for diagnostic services, such as microbiopsy procedures, are hospitals. Hospitals offer the required equipment, knowledge, and resources to conduct microbiopsy operations when patients present with questionable skin lesions or need tissue collection for diagnostic purposes. Specialized dermatological departments, pathology labs, and qualified medical staff that perform and analyses microbiopsy results are all found in hospitals. The need for microbiopsy procedures is driven by hospitals' accessibility to complete diagnostic services, which also helps the market expand.
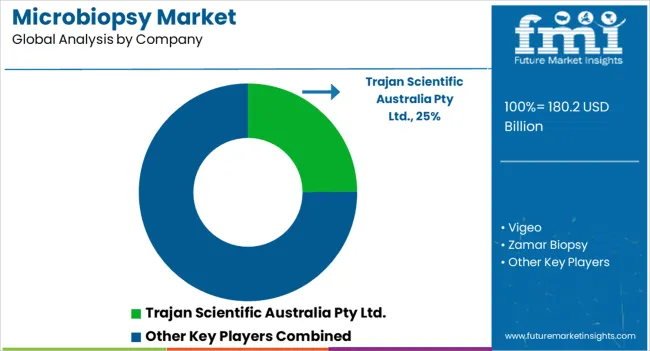
The microbiopsy sector is fiercely competitive, with many companies fighting for market dominance. To stay ahead of the competition in such a circumstance, essential players must employ smart techniques.
Key Strategies Used by the Participants
To produce innovative goods that increase efficacy, dependability, and cost-effectiveness, businesses make significant investments in research and development. Product innovation enables companies to stand out from the competition while also meeting the shifting needs of their customers.
Key industry leaders frequently develop strategic partnerships and collaborations with other companies in order to harness their strengths and increase their market reach. Companies might also gain access to new technology and markets through such agreements.
The microbiopsy sector is expanding rapidly in emerging regions such as China and India. Key firms are enhancing their distribution networks and developing local manufacturing facilities to increase their presence in these areas.
Mergers and acquisitions are frequently used by key players in the microbiopsy business to consolidate their market position, extend their product range, and gain access to new markets.
Key Developments in the Microbiopsy Market:
The global microbiopsy market is estimated to be valued at USD 180.2 billion in 2025.
The market size for the microbiopsy market is projected to reach USD 340.0 billion by 2035.
The microbiopsy market is expected to grow at a 6.6% CAGR between 2025 and 2035.
The key product types in microbiopsy market are microbiopsy needle, microbiopsy forceps and microbiopsy devices.
In terms of indication, skin cancer segment to command 53.2% share in the microbiopsy market in 2025.


Our Research Products

The "Full Research Suite" delivers actionable market intel, deep dives on markets or technologies, so clients act faster, cut risk, and unlock growth.

The Leaderboard benchmarks and ranks top vendors, classifying them as Established Leaders, Leading Challengers, or Disruptors & Challengers.

Locates where complements amplify value and substitutes erode it, forecasting net impact by horizon

We deliver granular, decision-grade intel: market sizing, 5-year forecasts, pricing, adoption, usage, revenue, and operational KPIs—plus competitor tracking, regulation, and value chains—across 60 countries broadly.

Spot the shifts before they hit your P&L. We track inflection points, adoption curves, pricing moves, and ecosystem plays to show where demand is heading, why it is changing, and what to do next across high-growth markets and disruptive tech

Real-time reads of user behavior. We track shifting priorities, perceptions of today’s and next-gen services, and provider experience, then pace how fast tech moves from trial to adoption, blending buyer, consumer, and channel inputs with social signals (#WhySwitch, #UX).

Partner with our analyst team to build a custom report designed around your business priorities. From analysing market trends to assessing competitors or crafting bespoke datasets, we tailor insights to your needs.
Supplier Intelligence
Discovery & Profiling
Capacity & Footprint
Performance & Risk
Compliance & Governance
Commercial Readiness
Who Supplies Whom
Scorecards & Shortlists
Playbooks & Docs
Category Intelligence
Definition & Scope
Demand & Use Cases
Cost Drivers
Market Structure
Supply Chain Map
Trade & Policy
Operating Norms
Deliverables
Buyer Intelligence
Account Basics
Spend & Scope
Procurement Model
Vendor Requirements
Terms & Policies
Entry Strategy
Pain Points & Triggers
Outputs
Pricing Analysis
Benchmarks
Trends
Should-Cost
Indexation
Landed Cost
Commercial Terms
Deliverables
Brand Analysis
Positioning & Value Prop
Share & Presence
Customer Evidence
Go-to-Market
Digital & Reputation
Compliance & Trust
KPIs & Gaps
Outputs
Full Research Suite comprises of:
Market outlook & trends analysis
Interviews & case studies
Strategic recommendations
Vendor profiles & capabilities analysis
5-year forecasts
8 regions and 60+ country-level data splits
Market segment data splits
12 months of continuous data updates
DELIVERED AS:
PDF EXCEL ONLINE

Thank you!
You will receive an email from our Business Development Manager. Please be sure to check your SPAM/JUNK folder too.
Chat With
MaRIA