Robotic Lung Biopsy Market Analysis Size and Share Forecast Outlook 2023 to 2033

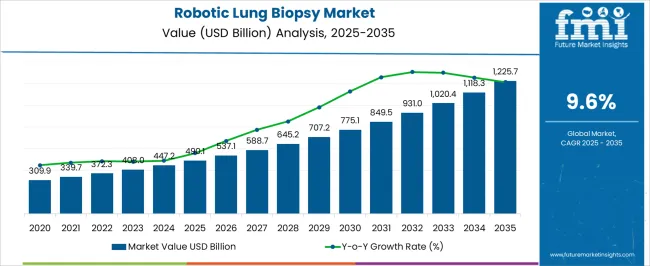
The Robotic Lung Biopsy Market size is projected to be worth USD 408.0 million in 2023. From 2023 to 2033, global robotic lung biopsy demand is forecast to rise at 9.6% CAGR. Total market valuation at the end of 2033 is expected to surpass USD 1,023.05 million.

Lung cancer remains the primary cause of cancer deaths globally. To tackle this global burden, early diagnosis becomes extremely critical. For this purpose, medical professionals perform diagnostic procedures such as biopsies and robotic lung biopsies.

Robotic lung biopsy, also known as robotic-assisted bronchoscopy or robotic bronchoscopy, is a novel advancement in bronchoscopy. It is widely used to detect the presence of lung cancer and other lung diseases.

Robotic lung biopsies use robotic-assisted technology for performing precise biopsies quickly and accurately. These procedures are minimally invasive and can be instrumental in determining the stage and type of a tumor, thereby helping to guide the course of treatment.

Rising need for early detection and diagnosis of lung cancer is providing a strong impetus to the robotic lung biopsy industry. Consequently, growing preferences towards minimally invasive medical procedures is expected to boost robotic lung biopsy sales revenue during the forecast period.

Minimally invasive procedures such as robotic lung biopsies are safer and more effective and can reduce pain, recovery time, and risk of infection. They aid in the early detection of lung cancer and other lethal respiratory diseases which can be helpful to initiate a proper treatment approach.

Surging cases of lung cancer and other respiratory disease is likely to fuel robotic lung biopsy system demand during the assessment period.

As per the World Cancer Research Fund International, there were an estimated 2.2 million lung cancer cases globally in 2020 and this number is expected to significantly increase during the next ten years. This will uplift robotic lung biopsy demand.

Introduction of favorable reimbursement policies is expected to positively impact the robotic lung biopsy industry. Many insurance providers are offering coverage for minimally invasive procedures, making them accessible and affordable to patients. As a result, more and more lung cancer patients are opting for robotic lung biopsies.

Due to the rising incidence of lung cancer and developments in robotic-assisted technology, the market for robotic lung biopsies is anticipated to expand rapidly over the next several years

Collaborations between medical device manufacturers and research institutes are anticipated to increase. This will significantly expand the global robotic lung biopsy market size.

Other Drivers Propelling the Demand for Robotic Lung Biopsy include:

  • Rising incidence of lung cancer globally will boost the global robotic lung biopsy industry. Lung cancer, according to the World Health Organization (WHO), is the primary reason for cancer-related deaths worldwide.
  • High adoption of robotic systems for diagnosis of lung diseases will boost robotic lung biopsy system sales.
  • Growing demand for minimally invasive procedures is likely to create new opportunities for robotic lung biopsy system manufacturers.
  • The development of robotic-assisted technology is expected to fuel the market's expansion. Robotic technology helps doctors do minimally invasive operations that are extremely precise and accurate.
  • The market for robotic lung biopsies is expanding as a result of increased healthcare costs and government measures to increase access to healthcare.

Challenges for Companies /Manufacturers in the Robotic Lung Biopsy Market:

  • Healthcare organizations with tight budgets may be discouraged from adopting medical robotic technology because of the initial capital expense needed for buying and maintaining such equipment.
  • The scarcity of qualified healthcare workers with experience in robotic-assisted lung biopsy operations is also limiting market expansion.
  • To monitor the creation and application of robotically assisted medical devices, there is a need for strong regulatory frameworks given the field's quick speed of technical innovation. As there are numerous parties involved in the creation, distribution, and application of robotically assisted devices, guaranteeing product safety and regulatory compliance can be challenging.

Opportunities in the Robotic Lung Biopsy Industry:

  • The market for robotic lung biopsies offers the healthcare sector tremendous room for expansion and innovation. Robotic lung biopsy devices are being used more often globally as a result of technological developments and rising demand for minimally invasive procedures.
  • The market is anticipated to develop as a result of the expanding availability of sophisticated robotic technology as well as the rising number of hospitals and diagnostic centers around the world.
  • The robotic lung biopsy market presents a variety of chances for organizations to develop their operations, broaden their product lines, and alter their sources of income. The market is expected to expand in the next few years due to a growing emphasis on patient-centered and affordable healthcare.
  • Development of new surgical robotics systems for robotic bronchoscopy will create lucrative opportunities for market players

Latest Trends in the Robotic Lung Biopsy Market:

  • The use of cutting-edge technologies, such as artificial intelligence and machine learning, to increase the precision and effectiveness of biopsy procedures is one of the key trends in the market.
  • The creation of more precise and compact biopsy tools as well as the incorporation of robotic systems with other imaging and diagnostic tools will boost the market. For instance, robots with CT or MRI imaging capabilities can deliver data that are even more exact and accurate than those obtained with conventional X-rays.
Attributes Key Insights
Estimated Global Robotic Lung Biopsy Market Size (2023) USD 408.0 million
Projected Robotic Lung Biopsy Market Projected Value (2033) USD 1,023.05 million
Value-based CAGR (2023 to 2033) 9.6%

2018 to 2022 Robotic Lung Biopsy Sales Outlook Compared to Forecast from 2023 to 2033

From 2018 to 2022, the global robotic lung biopsy market experienced a CAGR of 11.2% CAGR. Total market value at the end of 2022 reached around USD 379.7 million.

From 2018 to 2022, the global robotic lung biopsy industry witnessed steady growth due to the rising demand for lung cancer control systems. The market for robotic lung biopsies was just getting started at the time, and adoption rates were quite low.

Due to their high price, limited availability, and the perceived risk associated with robotic surgery, many healthcare professionals were reluctant to invest in these systems.

As per estimates from Intuitive Surgical in 2022, a total of 321 Ion end luminal systems were installed globally.

Looking ahead, the global robotic lung biopsy industry is expected to progress at a CAGR of 9.6% from 2023 to 2033. By the end of 2033, the market size is expected to reach USD 1,023.05 million.

Rising cases of lung cancer and shift towards minimally invasive procedures are key factors that are expected to drive the global market forward.
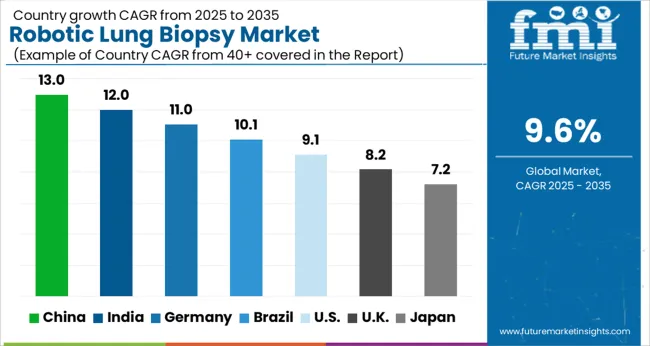
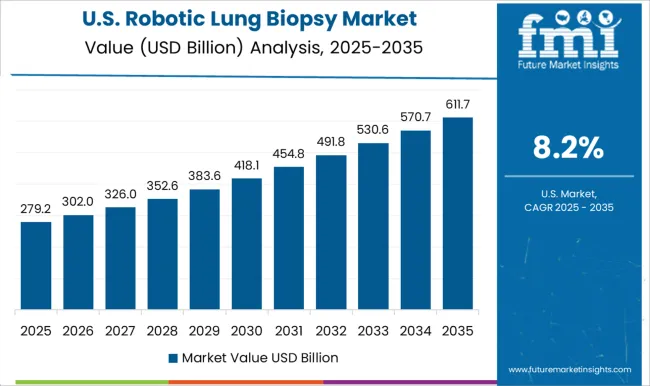
Top Countries Advancing Robotic Lung Biopsy Technologies

What is Driving Demand for Robotic Lung Biopsies in the United States?

Minimally Invasive Procedures Fueling Robotic Lung Biopsy Demand in the United States

Country United States
Market Size (USD million) by End of Forecast Period (2033) USD 648.1 million
CAGR % from 2023 to the End of Forecast (2033) 10.8%

The United States robotic lung biopsy industry is expected to reach a valuation of USD 648.1 million by 2033. Overall demand for robotic lung biopsies in the country is set to increase at a CAGR of 10.8% from 2023 to 2033.

High penetration of robotics in healthcare sector and rising preference for minimally invasive procedures are key factors boosting the United States robotic lung biopsy market.

Other factors expected to drive the demand for robotic lung biopsies in the country are:

  • Robotics and artificial intelligence developments have improved the procedure's accuracy, minimal invasiveness, and efficiency. This is resulting in increased patient satisfaction rates and lower healthcare expenses which will fuel demand in the country.
  • Older people are more likely to develop lung cancer and have problems with conventional biopsy techniques. As a result, robotic lung biopsy demand will surge at a robust pace in the United States.
  • Rising cases of COPD will also support market expansion through 2033.

What is the Growth Projection for the United Kingdom Robotic Lung Biopsy Industry?

High Adoption of Robotic Technologies in Healthcare to Boost the United Kingdom Market

Country The United Kingdom
Market Size (USD million) by End of Forecast Period (2033) USD 58.5 million
CAGR % from 2023 to the End of Forecast (2033) 8.2%

Robotic lung biopsy sales revenue in the United Kingdom is expected to surge at 8.2% CAGR during the assessment period. By 2033, the United Kingdom market value is projected to cross USD 58.5 million.

Rising adoption of robotic technologies in disease diagnosis and treatment is a prominent factor driving the United Kingdom. Similarly, favorable government support will facilitate market expansion in the country.

The National Health Service (NHS) in the United Kingdom is also pushing for increased use of robotic technologies in healthcare. This is increasing both healthcare professionals' and patients' knowledge of these technologies as well as fueling adoption of cutting-edge medical equipment.

How is China Robotic Lung Biopsy Industry Shaping?

Rising Prevalence of Lung Cancer to Boost China’s Robotic Biopsy Sector

Country China
Market Size (USD million) by End of Forecast Period (2033) USD 23.4 million
CAGR % from 2023 to the End of Forecast (2033) 7.7%

Robotic lung biopsy demand in China is anticipated to surge at 7.7% CAGR from 2023 to 2033. Total market valuation in China at the end of 2033 is expected to reach USD 23.4 million. Increasing cases of lung cancer is a key factor boosting the robotic lung biopsy industry in China.

The development of this industry is also being aided by technological and robotic developments that have made lung biopsy procedures safer, less intrusive, and more effective.

Finally, development of the robotic lung biopsy industry in China is significantly influenced by the Chinese government's support for medical technology and innovation.

How will Growth Unfold in Japan Market?

Increasing Adoption of Advanced Medical Technologies Spurring Growth in Kapan Market

Country Japan
Market Size (USD million) by End of Forecast Period (2033) USD 37.0 million
CAGR % from 2023 to the End of Forecast (2033) 9.7%

he robotic lung biopsy industry in Japan is estimated to reach a market share of USD 37.0 million by 2033. It is expected to thrive at a CAGR of 9.7% over the next ten years. Growing adoption of advanced medical technologies is expected to boost Japan market during the assessment period.

There is now a sizable market in Japan for precise diagnostic equipment, such as robotic lung biopsy systems. In the healthcare industry, Japan is renowned for being an early user of new technology, which has helped to fuel the quick expansion of this business.

The Japanese government also places a high priority on encouraging medical innovation and funding the creation of cutting-edge technologies. This is creating a conducive environment for robotic lung biopsy device manufacturers.

What is the Demand Outlook for Korea Robotic Lung Biopsy Industry?

Growing Awareness About the Positive Outcomes of Robotic Lung Biopsies Fueling Demand in Korea

Country South Korea
Market Size (USD million) by End of Forecast Period (2033) USD 11.2 million
CAGR % from 2023 to the End of Forecast (2033) 5.5%

The robotic lung biopsy industry in South Korea is anticipated to cross a valuation of USD 11.2 million by 2033. It is likely to exhibit a CAGR of 5.5% during the forecast period.

Growth in the market is driven by continuous advancements in medical technologies and rising awareness about the benefits of robotic lung biopsies.

The government aggressively encourages the quick uptake of innovative technologies, such as robotics, in the healthcare industry. Compared to conventional approaches, robotic lung biopsy operations are more accurate and efficient, carry a lower risk of complications, and result in faster patient recovery periods.

Last but not least, South Korea's advanced and well-established healthcare system offers a favorable atmosphere for the commercial expansion of robotic lung biopsies.

Robotic Lung Biopsy Market Analysis by System Type and End User

Why is Demand for Instruments and Accessories Rising in the Market?

Increasing Usage by End-users Fueling Demand for Instruments and Accessories

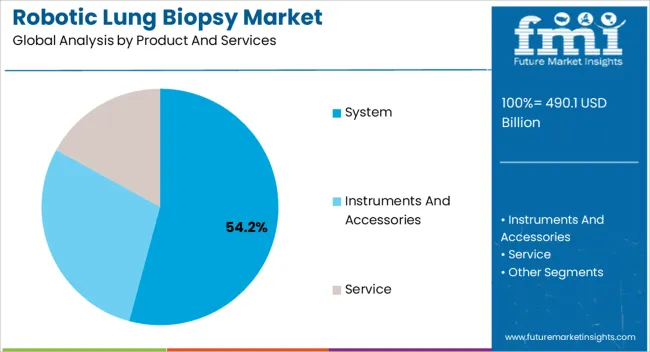
According to Future Market Insights (FI), demand in the market will remain high for instruments and accessories. The target segment is expected to progress at a CAGR of 10.9% from 2023 to 2033. This is due to rising usage of robotic lung biopsy instruments and accessories in hospitals and ambulatory surgical centers.

During a biopsy, robotic instruments and accessories are designed to allow precise and accurate tissue manipulation. The robotic arms provide surgeons with more dexterity and fine control, allowing them to make delicate movements with greater precision. This precision aids in the targeting of specific areas of interest as well as the collection of correct tissue samples for diagnosis.

Robotic systems help surgeons by converting hand movements into precise actions via robotic instruments. This decreases the physical strain and tiredness that surgeons suffer throughout extensive surgeries. The ergonomic design of the instruments and accessories allows for comfortable manipulation and enhances the surgeon's control.

Which is the Commonly Preferred Navigation Technology in Robotic Lung Biopsies?

Fiber Optic RealShape Navigation to Remain the Most Popular Navigation Technology

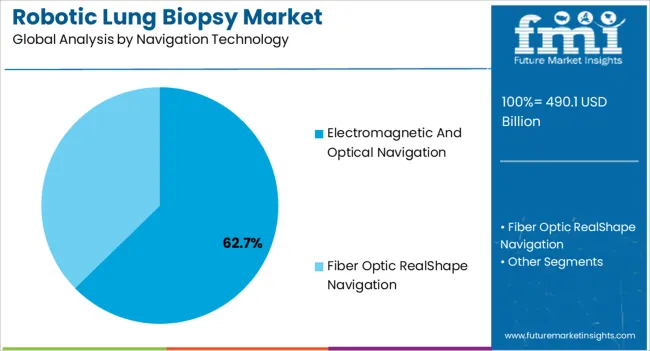
As per the latest report, fiber optic realshape navigation segment is expected to thrive at 10.4% CAGR from 2023 to 2033. It is likely to remain the most widely used technology in robotic lung biopsies. This is due to ability of this ground-breaking technology to enable real-time 3D visualization of full shape devices inside the body.

In robotics biopsy treatments, fiber optic realshape navigation provides higher accuracy, increased reach, and real-time visualization. This leads to a more successful and least invasive approach to lung biopsies.

Fiber optic realshape navigation, by generating a three-dimensional map of the patient's airways, can provide real-time advice. This assists the surgeon in precisely navigating to the desired region, increasing the likelihood of collecting a tissue sample from the intended site.

Which End User Segment will Likely Lead the Robotic Lung Biopsy Industry?

Hospitals Segment to Dominate the Global Market Through 2033

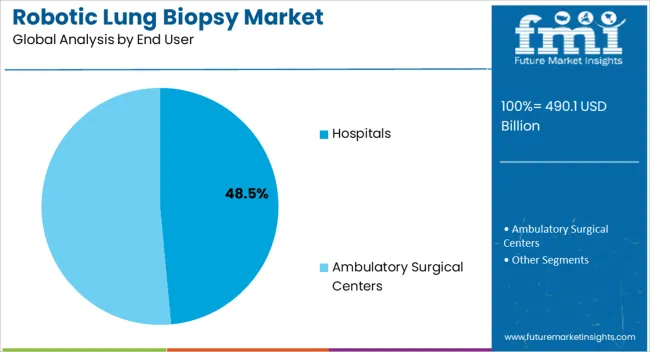
The hospitals segment is expected to dominate the robotic lung biopsy industry, accelerating at a CAGR of 9.9% from 2023 to 2033. This is due to increasing number of robotic biopsy procedures performed in hospitals.

Hospitals are increasingly recognizing the advantages of robotic biopsy procedures, such as increased accuracy & precision and less invasive approaches. As a result, there has been a rise in the adoption of robotic surgical systems for performing biopsies, including lung biopsies.

The field of robotics has seen significant advancements, leading to more sophisticated and capable robotic systems. These developments include improved robotic arms, greater imaging technology, and better ergonomics for surgeons. Robotic biopsy procedures have become more precise, efficient, and safe as a result of such advancements and hospitals are becoming key end users for advanced robotic systems.
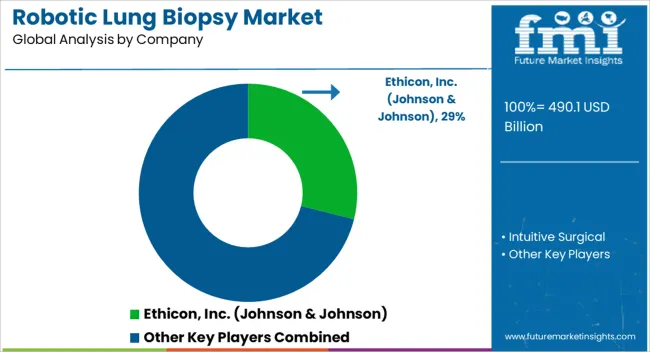
Strategies Adopted by Leading Players in the Robotic Lung Biopsy Industry

The robotic lung biopsy industry is highly competitive, with numerous players vying for market share. In such a scenario, key players must adopt effective strategies to stay ahead of the competition.

Key Strategies Adopted by the Players

Product Innovation

Leading companies are investing in research and development to introduce advanced robotic systems and services for robotic lung biopsies. Product innovation will allow them to differentiate themselves from their competitors while also catering to the changing needs of end users

Strategic Partnerships and Collaborations

Key players frequently develop strategic partnerships and collaborations with other companies to expand their market presence. They can also gain access to new technologies and markets through such collaborations.

Expansion into Emerging Markets

The robotic lung biopsy industry is witnessing significant growth in emerging markets such as China and the United States. Key robotic lung biopsy device manufacturers are expanding their presence in these markets by establishing local manufacturing facilities and strengthening their distribution networks.

Mergers and Acquisitions

Key players in the robotic lung biopsy industry often engage in mergers and acquisitions to strengthen their market position, expand their product portfolio, and gain access to new markets.

Key Players in the Robotic Lung Biopsy Industry

  • Ethicon, Inc. (Johnson & Johnson)
  • Intuitive Surgical.

Key Developments:

  • A new Intuitive ION robotic-assisted bronchoscopy platform was introduced by Lee Health in 2023.
  • In September 2021, a new minimally invasive robotic-assisted lung biopsy procedure was launched by MountainView Hospital. To precisely detect lung cancer, this procedure uses ION robotic-assisted bronchoscopy platform.
  • Recently, a new approach to pulmonary nodule diagnosis combining cone-beam computed tomography (CBCT) and robotic-assisted bronchoscopy technologies was introduced by pulmonologists at the Harron Lung Center.

Scope of the Robotic Lung Biopsy Market Report

Attribute Details
Estimated Market Size (2023) USD 408.0 million
Projected Market Size (2033) USD 1,023.05 million
Anticipated Growth Rate (2023 to 2033) 9.6% CAGR
Forecast Period 2023 to 2033
Historical Data Available for 2018 to 2022
Market Analysis USD million for Value and MT for Volume
Key Regions Covered North America; Latin America; Europe; Asia Pacific; and Middle East and Africa
Key Countries Covered United States, Canada, Mexico, Brazil, Germany, Italy, France, United Kingdom, Spain, BENELUX, Russia, China, Japan, South Korea, India, ASEAN, Australia and New Zealand, Türkiye, South Africa, GCC Countries, Others.
Key Segments Covered Product & Services, Navigation Technology, End User, and Region
Key Companies Profiled Ethicon, Inc. (Johnson & Johnson); Intuitive Surgical.

Top Investment Segments in the Robotic Lung Biopsy Market

By Product and Services:

  • System
  • Instruments and Accessories
  • Service

By Navigation Technology:

  • Electromagnetic and Optical Navigation
  • Fiber Optic RealShape Navigation

By End User:

  • Hospitals
  • Ambulatory Surgical Centers

By Region:

  • North America
  • Latin America
  • Europe
  • East Asia
  • South Asia
  • Oceania
  • The Middle East & Africa

Table of Content

  • 1. Executive Summary
  • 2. Market Overview
  • 3. Key Market Trends
  • 4. Value-Added Insights
  • 5. Market Background
  • 6. Global Market Volume (in Units) Analysis 2018 to 2022 and Forecast, 2023 to 2033
  • 7. Global Market - Pricing Analysis
  • 8. Global Market Demand (in Value or Size in USD million) Analysis 2018 to 2022 and Forecast, 2023 to 2033
  • 9. Global Market Analysis 2018 to 2022 and Forecast 2023 to 2033, By Product and Services
    • 9.1. Systems
    • 9.2. Instruments and accessories
    • 9.3. Services
  • 10. Global Market Analysis 2018 to 2022 and Forecast 2023 to 2033, By Navigation Technology
    • 10.1. Electromagnetic and Optical Navigation
    • 10.2. Fiber Optic RealShape Navigation
  • 11. Global Market Analysis 2018 to 2022 and Forecast 2023 to 2033, By End User
    • 11.1. Hospitals
    • 11.2. Ambulatory Surgical Centers
  • 12. Global Market Analysis 2018 to 2022 and Forecast 2023 to 2033, By Region
    • 12.1. North America
    • 12.2. Latin America
    • 12.3. Europe
    • 12.4. South Asia
    • 12.5. East Asia
    • 12.6. Oceania
    • 12.7. Middle East & Africa
  • 13. North America Market Analysis 2018 to 2022 and Forecast 2023 to 2033
  • 14. Latin America Market Analysis 2018 to 2022 and Forecast 2023 to 2033
  • 15. Europe Market Analysis 2018 to 2022 and Forecast 2023 to 2033
  • 16. East Asia Market Analysis 2018 to 2022 and Forecast 2023 to 2033
  • 17. South Asia Market Analysis 2018 to 2022 and Forecast 2023 to 2033
  • 18. Oceania Market Analysis 2018 to 2022 and Forecast 2023 to 2033
  • 19. Middle East and Africa Market Analysis 2018 to 2022 and Forecast 2023 to 2033
  • 20. Market Structure Analysis
  • 21. Competition Analysis
    • 21.1. Ethicon, Inc. (Johnson & Johnson)
    • 21.2. Intuitive Surgical
  • 22. Assumptions and Acronyms Used
  • 23. Research Methodology

List of Tables

Table 01: Global Market Value (US$ Million) Analysis 2018 to 2022 and Forecast 2023 to 2033, by Product and Services

Table 02: Global Market Volume (Units) Analysis 2018 to 2022 and Forecast 2023 to 2033, by Product and Services

Table 03: Global Market Analysis 2018 to 2022 and Forecast 2023 to 2033by Navigation Technology

Table 04: Global Market Analysis 2018 to 2022 and Forecast 2023 to 2033, by End User

Table 05: Global Market Analysis 2018 to 2022 and Forecast 2023 to 2033, by Region

Table 06: North America Market Value (US$ Million) Analysis 2018 to 2022 and Forecast 2023 to 2033, by Country

Table 07: North America Market Value (US$ Million) Analysis 2018 to 2022 and Forecast 2023 to 2033, by Product and Services

Table 08: North America Market Volume (Units) Analysis 2018 to 2022 and Forecast 2023 to 2033, by Product and Services

Table 09: North America Market Value (US$ Million) Analysis 2018 to 2022 and Forecast 2023 to 2033, by Navigation Technology

Table 10: North America Market Value (US$ Million) Analysis 2018 to 2022 and Forecast 2023 to 2033, by End User

Table 11: Latin America Market Value (US$ Million) Analysis 2018 to 2022 and Forecast 2023 to 2033, by Country

Table 12: Latin America Market Value (US$ Million) Analysis 2018 to 2022 and Forecast 2023 to 2033, by Product and Services

Table 13: Latin America Market Volume (Units) Analysis 2018 to 2022 and Forecast 2023 to 2033, by Product and Services

Table 14: Latin America Market Value (US$ Million) Analysis 2018 to 2022 and Forecast 2023 to 2033, by Navigation Technology

Table 15: Latin America Market Value (US$ Million) Analysis 2018 to 2022 and Forecast 2023 to 2033, by End User

Table 16: Europe Market Value (US$ Million) Analysis 2018 to 2022 and Forecast 2023 to 2033, by Country

Table 17: Europe Market Value (US$ Million) Analysis 2018 to 2022 and Forecast 2023 to 2033, by Product and Services

Table 18: Europe Market Volume (Units) Analysis 2018 to 2022 and Forecast 2023 to 2033, by Product and Services

Table 19: Europe Market Analysis 2018 to 2022 and Forecast 2023 to 2033by Navigation Technology

Table 20: Europe Market Value (US$ Million) Analysis 2018 to 2022 and Forecast 2023 to 2033, by End User

Table 21: East Asia Market Value (US$ Million) Analysis 2018 to 2022 and Forecast 2023 to 2033, by Country

Table 22: East Asia Market Value (US$ Million) Analysis 2018 to 2022 and Forecast 2023 to 2033, by Product and Services

Table 23: East Asia Market Volume (Units) Analysis 2018 to 2022 and Forecast 2023 to 2033, by Product and Services

Table 24: East Asia Market Value (US$ Million) Analysis 2018 to 2022 and Forecast 2023 to 2033, by Navigation Technology

Table 25: East Asia Market Value (US$ Million) Analysis 2018 to 2022 and Forecast 2023 to 2033, by End User

Table 26: South Asia Market Value (US$ Million) Analysis 2018 to 2022 and Forecast 2023 to 2033, by Country

Table 27: South Asia Market Value (US$ Million) Analysis 2018 to 2022 and Forecast 2023 to 2033, by Product and Services

Table 28: South Asia Market Volume (Units) Analysis 2018 to 2022 and Forecast 2023 to 2033, by Product and Services

Table 29: South Asia Market Value (US$ Million) Analysis 2018 to 2022 and Forecast 2023 to 2033, by Navigation Technology

Table 30: South Asia Market Value (US$ Million) Analysis 2018 to 2022 and Forecast 2023 to 2033, by End User

Table 31: Oceania Market Value (US$ Million) Analysis 2018 to 2022 and Forecast 2023 to 2033, by Country

Table 32: Oceania Market Value (US$ Million) Analysis 2018 to 2022 and Forecast 2023 to 2033, by Product and Services

Table 33: Oceania Market Volume (Units) Analysis 2018 to 2022 and Forecast 2023 to 2033, by Product and Services

Table 34: Oceania Market Analysis 2018 to 2022 and Forecast 2023 to 2033by Navigation Technology

Table 35: Oceania Market Value (US$ Million) Analysis 2018 to 2022 and Forecast 2023 to 2033, by End User

Table 36: Middle East & Africa Market Value (US$ Million) Analysis 2018 to 2022 and Forecast 2023 to 2033, by Country

Table 37: Middle East & Africa Market Value (US$ Million) Analysis 2018 to 2022 and Forecast 2023 to 2033, by Product and Services

Table 38: Middle East & Africa Market Volume (Units) Analysis 2018 to 2022 and Forecast 2023 to 2033, by Product and Services

Table 39: Middle East & Africa Market Analysis 2018 to 2022 and Forecast 2023 to 2033by Navigation Technology

Table 40: Middle East & Africa Market Value (US$ Million) Analysis 2018 to 2022 and Forecast 2023 to 2033, by End User

List of Figures

Figure 01: Global Market Volume (Units), 2018 to 2022

Figure 02: Global Market Volume (Units) & Y-o-Y Growth (%) Analysis, 2023 to 2033

Figure 03: Market, Pricing Analysis per unit (US$), in 2023

Figure 04: Market, Pricing Forecast per unit (US$), in 2033

Figure 05: Global Market Value (US$ Million) Analysis, 2018 to 2022

Figure 06: Global Market Forecast & Y-o-Y Growth, 2023 to 2033

Figure 07: Global Market Absolute $ Opportunity (US$ Million) Analysis, 2023 to 2033

Figure 08: Global Market Value Share (%) Analysis 2023 and 2033, by Product and Services

Figure 09: Global Market Y-o-Y Growth (%) Analysis 2023 to 2033, by Product and Services

Figure 10: Global Market Attractiveness Analysis 2023 to 2033, by Product and Services

Figure 11: Global Market Value Share (%) Analysis 2023 and 2033, by Navigation Technology

Figure 12: Global Market Y-o-Y Growth (%) Analysis 2023 to 2033, by Navigation Technology

Figure 13: Global Market Attractiveness Analysis 2023 to 2033, by Navigation Technology

Figure 14: Global Market Value Share (%) Analysis 2023 and 2033, by End User

Figure 15: Global Market Y-o-Y Growth (%) Analysis 2023 to 2033, by End User

Figure 16: Global Market Attractiveness Analysis 2023 to 2033, by End User

Figure 17: Global Market Value Share (%) Analysis 2023 and 2033, by Region

Figure 18: Global Market Y-o-Y Growth (%) Analysis 2023 to 2033, by Region

Figure 19: Global Market Attractiveness Analysis 2023 to 2033, by Region

Figure 20: North America Market Value (US$ Million) Analysis, 2018 to 2022

Figure 21: North America Market Value (US$ Million) Forecast, 2023 to 2033

Figure 22: North America Market Value Share, by Product and Services (2023 E)

Figure 23: North America Market Value Share, by Navigation Technology (2023 E)

Figure 24: North America Market Value Share, by End User (2023 E)

Figure 25: North America Market Value Share, by Country (2023 E)

Figure 26: North America Market Attractiveness Analysis by Product and Services, 2023 to 2033

Figure 27: North America Market Attractiveness Analysis by Navigation Technology, 2023 to 2033

Figure 28: North America Market Attractiveness Analysis by End User, 2023 to 2033

Figure 29: North America Market Attractiveness Analysis by Country, 2023 to 2033

Figure 30: United States Market Value Proportion Analysis, 2023

Figure 31: Global Vs. United States Growth Comparison

Figure 32: United States Market Share Analysis (%) by Product and Services, 2022 & 2033

Figure 33: United States Market Share Analysis (%) by Navigation Technology, 2022 & 2033

Figure 34: United States Market Share Analysis (%) by End User, 2022 & 2033

Figure 35: Canada Market Value Proportion Analysis, 2023

Figure 36: Global Vs. Canada. Growth Comparison

Figure 37: Canada Market Share Analysis (%) by Product and Services, 2022 & 2033

Figure 38: Canada Market Share Analysis (%) by Navigation Technology, 2022 & 2033

Figure 39: Canada Market Share Analysis (%) by End User, 2022 & 2033

Figure 40: Latin America Market Value (US$ Million) Analysis, 2018 to 2022

Figure 41: Latin America Market Value (US$ Million) Forecast, 2023 to 2033

Figure 42: Latin America Market Value Share, by Product and Services (2023 E)

Figure 43: Latin America Market Value Share, by Navigation Technology (2023 E)

Figure 44: Latin America Market Value Share, by End User (2023 E)

Figure 45: Latin America Market Value Share, by Country (2023 E)

Figure 46: Latin America Market Attractiveness Analysis by Product and Services, 2023 to 2033

Figure 47: Latin America Market Attractiveness Analysis by Navigation Technology, 2023 to 2033

Figure 48: Latin America Market Attractiveness Analysis by End User, 2023 to 2033

Figure 49: Latin America Market Attractiveness Analysis by Country, 2023 to 2033

Figure 50: Mexico Market Value Proportion Analysis, 2023

Figure 51: Global Vs Mexico Growth Comparison

Figure 52: Mexico Market Share Analysis (%) by Product and Services, 2022 & 2033

Figure 53: Mexico Market Share Analysis (%) by Navigation Technology, 2022 & 2033

Figure 54: Mexico Market Share Analysis (%) by End User, 2022 & 2033

Figure 55: Brazil Market Value Proportion Analysis, 2023

Figure 56: Global Vs. Brazil. Growth Comparison

Figure 57: Brazil Market Share Analysis (%) by Product and Services, 2022 & 2033

Figure 58: Brazil Market Share Analysis (%) by Navigation Technology, 2022 & 2033

Figure 59: Brazil Market Share Analysis (%) by End User, 2022 & 2033

Figure 60: Argentina Market Value Proportion Analysis, 2023

Figure 61: Global Vs Argentina Growth Comparison

Figure 62: Argentina Market Share Analysis (%) by Product and Services, 2022 & 2033

Figure 63: Argentina Market Share Analysis (%) by Navigation Technology, 2022 & 2033

Figure 64: Argentina Market Share Analysis (%) by End User, 2022 & 2033

Figure 65: Europe Market Value (US$ Million) Analysis, 2018 to 2022

Figure 66: Europe Market Value (US$ Million) Forecast, 2023 to 2033

Figure 67: Europe Market Value Share, by Product and Services (2023 E)

Figure 68: Europe Market Value Share, by Navigation Technology (2023 E)

Figure 69: Europe Market Value Share, by End User (2023 E)

Figure 70: Europe Market Value Share, by Country (2023 E)

Figure 71: Europe Market Attractiveness Analysis by Product and Services, 2023 to 2033

Figure 72: Europe Market Attractiveness Analysis by Navigation Technology, 2023 to 2033

Figure 73: Europe Market Attractiveness Analysis by End User, 2023 to 2033

Figure 74: Europe Market Attractiveness Analysis by Country, 2023 to 2033

Figure 75: United Kingdom Market Value Proportion Analysis, 2023

Figure 76: Global Vs. United Kingdom Growth Comparison

Figure 77: United Kingdom Market Share Analysis (%) by Product and Services, 2022 & 2033

Figure 78: United Kingdom Market Share Analysis (%) by Navigation Technology, 2022 & 2033

Figure 79: United Kingdom Market Share Analysis (%) by End User, 2022 & 2033

Figure 80: Germany Market Value Proportion Analysis, 2023

Figure 81: Global Vs. Germany Growth Comparison

Figure 82: Germany Market Share Analysis (%) by Product and Services, 2022 & 2033

Figure 83: Germany Market Share Analysis (%) by Navigation Technology, 2022 & 2033

Figure 84: Germany Market Share Analysis (%) by End User, 2022 & 2033

Figure 85: Italy Market Value Proportion Analysis, 2023

Figure 86: Global Vs. Italy Growth Comparison

Figure 87: Italy Market Share Analysis (%) by Product and Services, 2022 & 2033

Figure 88: Italy Market Share Analysis (%) by Navigation Technology, 2022 & 2033

Figure 89: Italy Market Share Analysis (%) by End User, 2022 & 2033

Figure 90: France Market Value Proportion Analysis, 2023

Figure 91: Global Vs France Growth Comparison

Figure 92: France Market Share Analysis (%) by Product and Services, 2022 & 2033

Figure 93: France Market Share Analysis (%) by Navigation Technology, 2022 & 2033

Figure 94: France Market Share Analysis (%) by End User, 2022 & 2033

Figure 95: Spain Market Value Proportion Analysis, 2023

Figure 96: Global Vs Spain Growth Comparison

Figure 97: Spain Market Share Analysis (%) by Product and Services, 2022 & 2033

Figure 98: Spain Market Share Analysis (%) by Navigation Technology, 2022 & 2033

Figure 99: Spain Market Share Analysis (%) by End User, 2022 & 2033

Figure 100: Russia Market Value Proportion Analysis, 2023

Figure 101: Global Vs Russia Growth Comparison

Figure 102: Russia Market Share Analysis (%) by Product and Services, 2022 & 2033

Figure 103: Russia Market Share Analysis (%) by Navigation Technology, 2022 & 2033

Figure 104: Russia Market Share Analysis (%) by End User, 2022 & 2033

Figure 105: BENELUX Market Value Proportion Analysis, 2023

Figure 106: Global Vs BENELUX Growth Comparison

Figure 107: BENELUX Market Share Analysis (%) by Product and Services, 2022 & 2033

Figure 108: BENELUX Market Share Analysis (%) by Navigation Technology, 2022 & 2033

Figure 109: BENELUX Market Share Analysis (%) by End User, 2022 & 2033

Figure 110: East Asia Market Value (US$ Million) Analysis, 2018 to 2022

Figure 111: East Asia Market Value (US$ Million) Forecast, 2023 to 2033

Figure 112: East Asia Market Value Share, by Product and Services (2023 E)

Figure 113: East Asia Market Value Share, by Navigation Technology (2023 E)

Figure 114: East Asia Market Value Share, by End User (2023 E)

Figure 115: East Asia Market Value Share, by Country (2023 E)

Figure 116: East Asia Market Attractiveness Analysis by Product and Services, 2023 to 2033

Figure 117: East Asia Market Attractiveness Analysis by Navigation Technology, 2023 to 2033

Figure 118: East Asia Market Attractiveness Analysis by End User, 2023 to 2033

Figure 119: East Asia Market Attractiveness Analysis by Country, 2023 to 2033

Figure 120: China Market Value Proportion Analysis, 2023

Figure 121: Global Vs. China Growth Comparison

Figure 122: China Market Share Analysis (%) by Product and Services, 2022 & 2033

Figure 123: China Market Share Analysis (%) by Navigation Technology, 2022 & 2033

Figure 124: China Market Share Analysis (%) by End User, 2022 & 2033

Figure 125: Japan Market Value Proportion Analysis, 2023

Figure 126: Global Vs. Japan Growth Comparison

Figure 127: Japan Market Share Analysis (%) by Product and Services, 2022 & 2033

Figure 128: Japan Market Share Analysis (%) by Navigation Technology, 2022 & 2033

Figure 129: Japan Market Share Analysis (%) by End User, 2022 & 2033

Figure 130: South Korea Market Value Proportion Analysis, 2023

Figure 131: Global Vs South Korea Growth Comparison

Figure 132: South Korea Market Share Analysis (%) by Product and Services, 2022 & 2033

Figure 133: South Korea Market Share Analysis (%) by Navigation Technology, 2022 & 2033

Figure 134: South Korea Market Share Analysis (%) by End User, 2022 & 2033

Figure 135: South Asia Market Value (US$ Million) Analysis, 2018 to 2022

Figure 136: South Asia Market Value (US$ Million) Forecast, 2023 to 2033

Figure 137: South Asia Market Value Share, by Product and Services (2023 E)

Figure 138: South Asia Market Value Share, by Navigation Technology (2023 E)

Figure 139: South Asia Market Value Share, by End User (2023 E)

Figure 140: South Asia Market Value Share, by Country (2023 E)

Figure 141: South Asia Market Attractiveness Analysis by Product and Services, 2023 to 2033

Figure 142: South Asia Market Attractiveness Analysis by Navigation Technology, 2023 to 2033

Figure 143: South Asia Market Attractiveness Analysis by End User, 2023 to 2033

Figure 144: South Asia Market Attractiveness Analysis by Country, 2023 to 2033

Figure 145: India Market Value Proportion Analysis, 2023

Figure 146: Global Vs. India Growth Comparison

Figure 147: India Market Share Analysis (%) by Product and Services, 2022 & 2033

Figure 148: India Market Share Analysis (%) by Navigation Technology, 2022 & 2033

Figure 149: India Market Share Analysis (%) by End User, 2022 & 2033

Figure 150: Indonesia Market Value Proportion Analysis, 2023

Figure 151: Global Vs. Indonesia Growth Comparison

Figure 152: Indonesia Market Share Analysis (%) by Product and Services, 2022 & 2033

Figure 153: Indonesia Market Share Analysis (%) by Navigation Technology, 2022 & 2033

Figure 154: Indonesia Market Share Analysis (%) by End User, 2022 & 2033

Figure 155: Malaysia Market Value Proportion Analysis, 2023

Figure 156: Global Vs. Malaysia Growth Comparison

Figure 157: Malaysia Market Share Analysis (%) by Product and Services, 2022 & 2033

Figure 158: Malaysia Market Share Analysis (%) by Navigation Technology, 2022 & 2033

Figure 159: Malaysia Market Share Analysis (%) by End User, 2022 & 2033

Figure 160: Thailand Market Value Proportion Analysis, 2023

Figure 161: Global Vs. Thailand Growth Comparison

Figure 162: Thailand Market Share Analysis (%) by Product and Services, 2022 & 2033

Figure 163: Thailand Market Share Analysis (%) by Navigation Technology, 2022 & 2033

Figure 164: Thailand Market Share Analysis (%) by End User, 2022 & 2033

Figure 165: Oceania Market Value (US$ Million) Analysis, 2018 to 2022

Figure 166: Oceania Market Value (US$ Million) Forecast, 2023 to 2033

Figure 167: Oceania Market Value Share, by Product and Services (2023 E)

Figure 168: Oceania Market Value Share, by Navigation Technology (2023 E)

Figure 169: Oceania Market Value Share, by End User (2023 E)

Figure 170: Oceania Market Value Share, by Country (2023 E)

Figure 171: Oceania Market Attractiveness Analysis by Product and Services, 2023 to 2033

Figure 172: Oceania Market Attractiveness Analysis by Navigation Technology, 2023 to 2033

Figure 173: Oceania Market Attractiveness Analysis by End User, 2023 to 2033

Figure 174: Oceania Market Attractiveness Analysis by Country, 2023 to 2033

Figure 175: Australia Market Value Proportion Analysis, 2023

Figure 176: Global Vs. Australia Growth Comparison

Figure 177: Australia Market Share Analysis (%) by Product and Services, 2022 & 2033

Figure 178: Australia Market Share Analysis (%) by Navigation Technology, 2022 & 2033

Figure 179: Australia Market Share Analysis (%) by End User, 2022 & 2033

Figure 180: New Zealand Market Value Proportion Analysis, 2023

Figure 181: Global Vs New Zealand Growth Comparison

Figure 182: New Zealand Market Share Analysis (%) by Product and Services, 2022 & 2033

Figure 183: New Zealand Market Share Analysis (%) by Navigation Technology, 2022 & 2033

Figure 184: New Zealand Market Share Analysis (%) by End User, 2022 & 2033

Figure 185: Middle East & Africa Market Value (US$ Million) Analysis, 2018 to 2022

Figure 186: Middle East & Africa Market Value (US$ Million) Forecast, 2023 to 2033

Figure 187: Middle East & Africa Market Value Share, by Product and Services (2023 E)

Figure 188: Middle East & Africa Market Value Share, by Navigation Technology (2023 E)

Figure 189: Middle East & Africa Market Value Share, by End User (2023 E)

Figure 190: Middle East & Africa Market Value Share, by Country (2023 E)

Figure 191: Middle East & Africa Market Attractiveness Analysis by Product and Services, 2023 to 2033

Figure 192: Middle East & Africa Market Attractiveness Analysis by Navigation Technology, 2023 to 2033

Figure 193: Middle East & Africa Market Attractiveness Analysis by End User, 2023 to 2033

Figure 194: Middle East & Africa Market Attractiveness Analysis by Country, 2023 to 2033

Figure 195: GCC Countries Market Value Proportion Analysis, 2023

Figure 196: Global Vs GCC Countries Growth Comparison

Figure 197: GCC Countries Market Share Analysis (%) by Product and Services, 2022 & 2033

Figure 198: GCC Countries Market Share Analysis (%) by Navigation Technology, 2022 & 2033

Figure 199: GCC Countries Market Share Analysis (%) by End User, 2022 & 2033

Figure 200: Türkiye Market Value Proportion Analysis, 2023

Figure 201: Global Vs. Türkiye Growth Comparison

Figure 202: Türkiye Market Share Analysis (%) by Product and Services, 2022 & 2033

Figure 203: Türkiye Market Share Analysis (%) by Navigation Technology, 2022 & 2033

Figure 204: Türkiye Market Share Analysis (%) by End User, 2022 & 2033

Figure 205: South Africa Market Value Proportion Analysis, 2023

Figure 206: Global Vs. South Africa Growth Comparison

Figure 207: South Africa Market Share Analysis (%) by Product and Services, 2022 & 2033

Figure 208: South Africa Market Share Analysis (%) by Navigation Technology, 2022 & 2033

Figure 209: South Africa Market Share Analysis (%) by End User, 2022 & 2033

Figure 210: North Africa Market Value Proportion Analysis, 2023

Figure 211: Global Vs North Africa Growth Comparison

Figure 212: North Africa Market Share Analysis (%) by Product and Services, 2022 & 2033

Figure 213: North Africa Market Share Analysis (%) by Navigation Technology, 2022 & 2033

Figure 214: North Africa Market Share Analysis (%) by End User, 2022 & 2033

Frequently Asked Questions

What is the Growth Potential of the Robotic Lung Biopsy Market?

The growth potential of the market is 9.6% through 2033.

What Limits the Growth Potential of the Market?

The high treatment cost is likely to limit market growth.

What is the Growth Outlook for the Market in the United States?

The United States is likely to capture a valuation of 648.1 million by 2033.

How Big Will the Market in the United Kingdom by 2033?

The market in the United Kingdom may capture a CAGR of 8.2% by 2033.

Which Country is Set to Register Exponential Growth in the Market?

The United States, China, and the United Kingdom may witness significant growth in the market.

Explore Similar Insights

Future Market Insights

Robotic Lung Biopsy Market