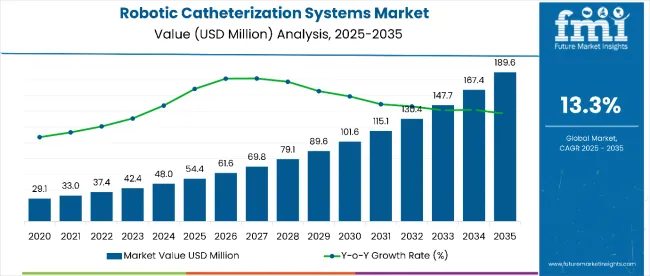
The global sales of robotic catheterization systems are estimated to be worth USD 54.4 million in 2025 and anticipated to reach a value of USD 189.6 million by 2035. Sales are projected to rise at a CAGR of 13.3% over the forecast period between 2025 and 2035. The revenue generated by robotic catheterization systems in 2023 was USD 42.0 million.
The robotic catheterization systems market is experiencing a development in terms of digitalization of instruments with it being a main factor in the advancement of automated and integrated cardiovascular interventional labs. The developments in robotic technology are occurring at a rapid pace, which would assist hospitals in cutting down on catheterization lab costs, chiefly in inaccessible and isolated areas.
The commercialization of such advanced digitalized systems has resulted in the improvement of the operational efficiency of catheterization labs. The factor of high cost is still relevant for such systems; however, the deployment of robotic catheterization systems is gaining pace over the globe owing to their benefits over the conventional catheterization procedures.
| Attributes | Key Insights |
|---|---|
| Historical Size, 2024 | USD 48.2 million |
| Estimated Size, 2025 | USD 54.4 million |
| Projected Size, 2035 | USD 189.6 million |
| Value-based CAGR (2025 to 2035) | 13.3% |
The advancing need for minimally invasive procedures is one of the major drivers for the market for robotic catheterization systems. As the patients and the healthcare providers increasingly stress on quick recovery, reduced risk of complications, and lower costs, minimally invasive surgeries become their first choice.
Robotic catheterization systems are at the very center of this trend, as one can perform complicated procedures with high accuracy and minimum panic to the patient's body. These systems provide surgeons with enhanced instrumentation that improves control when placing catheters, thereby reducing the scope for human errors and increasing the positive outcome of the procedures.
The small incision site for robotic procedures will generally mean less post-op pain, shorter recovery periods, and quicker discharge from the hospital. These all add to a better patient experience while expediting treatment and minimizing costs; hence making robotic catheterization systems attractive options for hospitals and clinics.
With the increasing demand for minimally invasive procedures, it is expected that robotic catheterization systems will see great adoption, catering to the needs of both patients and healthcare providers.
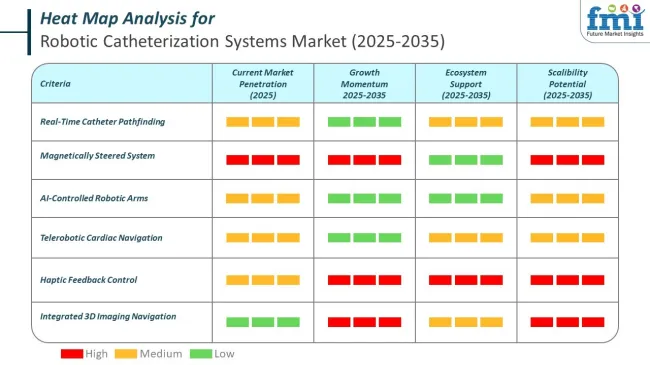
The robotic catheterization systems market in 2025 is moving closer to patients. AI is not just helping doctors. It's powering better clinical outcomes, smoother recovery, and faster diagnosis. Catheter robots now operate with predictive mapping. Real-time vascular tracking means fewer complications and higher consumer trust.
Hospitals that offer innovative catheterization systems demand see higher patient inflow. These systems are marketed for precision, lower pain, and quicker discharge.
Robotic catheterization systems market is subject to rigorous government oversight due to their clinical complexity and use of AI, robotics, and networked components. Regulatory frameworks determine how these systems are developed, approved, and introduced into hospitals. Compliance impacts everything from launch timelines to insurance coverage.
In the USA, the FDA classifies most robotic catheter systems under Class II or III medical devices. Developers must submit detailed safety data, clinical trial results, and usability documentation. AI-powered features are reviewed for transparency, performance consistency, and bias mitigation.
The below table presents the expected CAGR for the global growth of robotic catheterization systems sales over several semi-annual periods spanning from 2025 to 2035. In the first half (H1) of the decade from 2024 to 2034, the business is predicted to surge at a CAGR of 14.4%, followed by a slightly lower growth rate of 14.0% in the second half (H2) of the same decade.
| Particular | Value CAGR |
|---|---|
| H1 | 14.4% (2024 to 2034) |
| H2 | 14.0% (2024 to 2034) |
| H1 | 13.3% (2025 to 2035) |
| H2 | 12.9% (2025 to 2035) |
Moving into the subsequent period, from H1 2025 to H2 2035, the CAGR is projected to decrease slightly to 13.3% in the first half and decrease moderately at 12.9% in the second half. In the first half (H1) the market witnessed a decrease of 110 BPS while in the second half (H2), the market witnessed a increase of 110 BPS.
Long-Term Cost Efficiency of Robotic Catheterization Systems Demanded in the Markets
While the initial costs of robotic catheter systems may be steep, economically, they are much more efficient in the long-run. These high-tech systems are associated with faster and more accurate procedures that lead to a direct decrease in procedure times and enhance patient outcomes.
This, in turn, leads to shorter less costly hospital stays. Robotic systems also minimize the risk of complications and human error, which may result in cost related to treatment and recovery for the patient. These systems, through greater accuracy in catheter placement and reduced rates of adverse events, significantly reduce the need for secondary surgical interventions, thus minimizing hospitalizations and other medical interventions.
Further, accuracy improves such clinical outcomes as readmissions and re-hospitalizations, which decreases overall increment in costs of healthcare. Over time, the financial advantages of operational efficiencies and better patient outcomes arising from robotic systems make it a capital-efficient investment toward the healthcare institutions. This is prompting hospitals into realizing the long-term financial benefits of robotic catheterization technology.
Enhanced Precision and Safety with Robotic Catheterization Systems Driving the Demand
Such robotic-assisted procedures, whereby precision, dexterity, and control over catheterization are maximized, produce satisfactory patient results-and a better chance of success for doctors involved. Although this technology does have the potential to put surgeons at ease during potentially challenging procedures, it has also greatly reduced human error opportunities through enhanced accuracy.
Highly controlled precision placement means that catheters get in just where they need to be, resulting in fewer complications and increased chances of success. Moreover, robotic systems reduce dependence on manual adjustments that, among other things, may contribute to error or duplication of technique.
Besides better control over precision, robotic systems minimize radiation exposure, a frequent concern in conventional catheterization procedures. By offering better control of the whole procedure, in conjunction with real-time imaging, the amount of fluoroscopy required is reduced, consequently cutting the radiation dose for patients. Such benefits, therefore, translate into safer procedures, which consequently lessen the risk of side effects related to radiation exposure.
In summary, the interaction of reduced human error, greater accuracy, and less radiation exposure provides for better clinical outcomes with quicker recovery times, fewer complications, and less chance of adverse events, establishing robotic catheterization systems as an indispensable tool in modern medicine.
Reducing Radiation Risks and Enhancing Precision will Create Opportunities in the Market
The opportunistic approach to this market is driven by the factor of reduced risk in terms of occupational hazards with reference to radiation exposure for cardiologists. During the interventional cardiology procedures, it has been reported by majority of surgeons that the occupational hazards associated with interventional cardiology procedures affected them.
The modern cath labs use ionizing radiation comprehensively in the form of X-rays, which is responsible for the practitioners to be exposed to risk of malignancy also comprising the neck and head region.
Though the preventive measures, such as the utilization of lead aprons may reduce the impact of such risk associated factors, it is to be noted that their long term use may be associated with the development of orthopaedic injuries among practitioners.
The market for robotic catheterization systems is thus set to witness a lucrative growth with the advancement in technology as well as the extensive testing of these systems in clinical trials for their efficacy. Training of skilled professionals to perform conventional cardiovascular procedures will further boost the growth of robot assisted catheterization procedures, such as catheter ablation.
Thus, the reduced impact of risk associated with radiation, the precision of robot assisted catheterization procedures and the rising demand of skilled professionals to perform robotic catheterization procedures will drive the sales of the robotic catheterization systems over the forecast period.
Challenges in Adopting Robotic Catheterization Systems for Peripheral Vascular Interventions
The restricted mechanical capacity of balloon angioplasty in peripheral vascular interventions to recover calcified lesions has given rise to the development of novel technologies using robot assisted catheterization procedures. Conventionally, large number of robot assisted catheterization technologies have been established to assist with the physicians’ ability to operate with percutaneous coronary intervention procedures.
However, there lacks data comparing the endovascular options and thus, there is large parity with regard to establishing which robot assisted catheterization procedure would benefit the patient, depending upon the disease and procedural impact on surgical outcomes.
Additionally, the high upfront cost of robotic catheterization systems depicts a negative impact on the end users’ decision to purchase them. Setting robot-assisted endovascular procedures as standard of care may take time since special reimbursement for robotic assisted catheterization are not available.
The lack of studies demonstrating cost effectiveness and outcome data from manufacturers might make it challenging for care centers to justify investing in the robotic platform. By extending the spectrum of indications for robotic catheterized procedures, manufacturers may improve their applicability and potentially gain market share in the long term.
Other major complications include infection at the insertion site of the robotic catheterization systems guiding wire and catheter, contamination of the burr catheter and seeding of the catheter.
Growing awareness concerning complications associated with robotic catheterization systems procedures and increasing reluctance concerning the risk of infection, results in low inclination and reluctance towards robotic catheterization system procedures in peripheral vascular intervention by patients.
The global sales of robotic catheterization systems recorded a CAGR of 13.9% during the historical period between 2020 and 2024. The revenue growth of robotic catheterization systems was positive as it reached a value of USD 4,8.2 million in 2024 from USD 28.6 million in 2020.
Robotic systems for surgical and interventional procedures have now gained a considerable impression on how surgeries are executed and are being gradually implemented in the present operating rooms. Robot assisted catheterization has demonstrated its abilities to perform interventional procedures with vastly low exposure to radiation by the operator as compared to the conventional catheterization procedures.
Processes where clinicians are provided with navigational and mechanical tools which carry out a defined set of actions or a part of a procedure with high precision and control are now achieved with robot- catheterization systems.
These systems are developed to provide physicians with precision in terms of catheter manipulation and its positioning, while keeping account of its stable control during catheter associated procedures, vastly for cardiovascular processes. These systems or medical robots are thus designed to promote physician ability to perform critical medical procedures with precision and control.
Moreover, the implementation of robotic catheterization systems also enables the physicians to cause impact on the target tissue as well as assist with the delivery of medicines or disinfecting agents for infection and disease prevention. Rising advancements in the deployment of robotic catheterization systems in endovascular therapy is an emerging novel approach with significant effects on the reduction in exposure to radiation.
These systems augment the applications of minimally invasive procedures and assists the physicians to perform procedures in the domain of neurosurgery, vascular surgery, and interventional cardiology.
Market leaders such as Siemens Healthineers and Johnson and Johnson (by Hansen Medical, Inc.), with a broad range of products, worldwide presence, and notable investments in research and development, these companies are seen to lead in innovation. Thus, having a significant bearing on market trends, these companies set benchmarks for technology and clinical outcomes.
The Tier 2 players are firms like Stereotaxis, Inc., who offer rather specific contributions with their robotic navigation and catheterization systems. Usually, specialization and niche applications are adopted by these companies to evolve their technology differentiations and target solutions to carve their market share. Their contribution undoubtedly fills out the market, catering to specialized clinical needs.
Tier 3 consists of small or emerging firms that cover those territories within themselves or address some specific innovations of note. Usually, the Tier 3 players operate on a very small scope, offering bespoke solutions or cost-effective choices to gain market share.
The pyramidal structure shows a dynamic market where the well-networked large powers generate growth that is supplemented with the innovation from mid-sized companies to satisfy specialized or underexplored market niches by small players.
The section below covers the industry analysis for the robotic catheterization systems for different countries. Market demand analysis on key countries in several regions of the globe, including North America, Latin America, East Asia, South Asia & Pacific, Western Europe, Eastern Europe and MEA, is provided.
The United States is anticipated to remain at the forefront in North America, with higher market share through 2035. In Asia Pacific, India is projected to witness a CAGR of 10.6% by 2035.
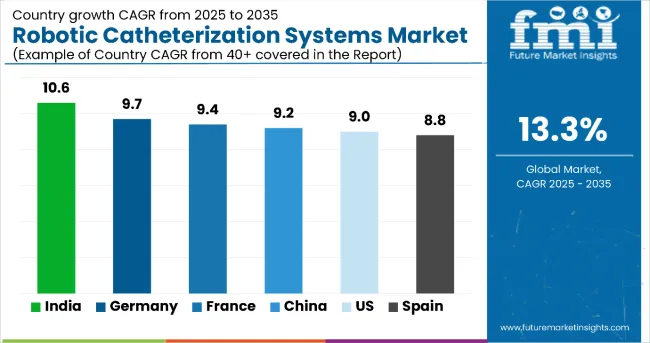
| Countries | Value CAGR (2025 to 2035) |
|---|---|
| United States | 9.0% |
| Germany | 9.7% |
| China | 9.2% |
| France | 9.4% |
| India | 10.6% |
| Spain | 8.8% |
The United states has a stronghold in the North American market for robotic catheterization systems in 2024, and growth is expected throughout the forecast period. High disability and aging populations drive demand for advanced medical technologies.
Furthermore, The invention of at least automation and robotics in healthcare functioning from the major manufacturers and research institutes among the scientists in the USA Also, the engines churn out renewables in the relentless process of development, contributing to sustenance...establishances like there and practically guarantees that the USA would make sure to exert unassailable dominance within the region.
In 2024, China was the dominant player in the East Asia market. The major driver is the increasing adoption of automation and robotic assistive devices in the healthcare sector, with China being one of the major contributors to the development of robotic systems for various medical applications, including catheterization procedures. Increasing elderly population and the rising tone of cardiovascular diseases provide a wider space for growth for advanced medical technologies in the country.
China's strong inclination toward technological progress supported by strong government support for the robotics and health sectors, is proceeding toward higher growth opportunities for the market. These factors place China as the leading force to reckon within the East Asian market robotic catheterization systems for the forecast period.
The UK market for robotic catheterization systems will grow at a CAGR of about 10.3% during the forecast period. This growth could be attributed to an increasing burden of disease in the region, which is augmenting the demand for advanced medical technology. The broad acceptance of clinically approved mechanical and automated systems for emergency surgeries has further awoken the UK market.
These systems provide increased precision, efficiency, and reliability and embody modern healthcare practices. Further, the focus on equipping the UK with technology into its healthcare is assured to boost sustainable growth in this market, positioning the country as one of the key players in the European Industrys.
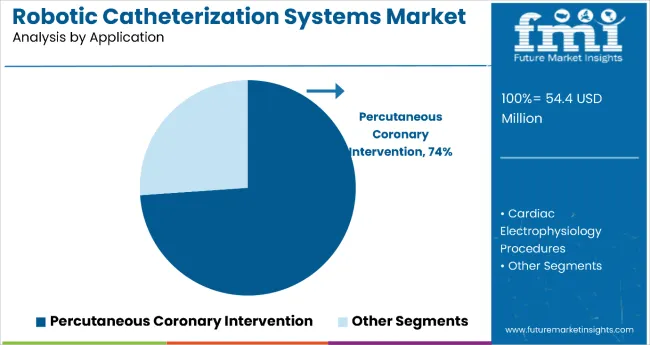
Percutaneous coronary intervention holds the dominant position with 73.9% of the market share in the application category within the robotic catheterization systems market. This substantial leadership is driven by PCI's critical role in treating coronary artery disease through minimally invasive procedures that require exceptional precision and control.
Robotic catheterization systems provide unparalleled accuracy in catheter navigation and stent placement, which are vital for improving surgical outcomes and ensuring patient safety during complex cardiovascular procedures.
The segment's dominance is reinforced by the increasing prevalence of cardiovascular diseases and the growing preference for minimally invasive techniques that reduce recovery times and procedural risks.
The precision and efficiency offered by robotic systems in PCI procedures have made them the preferred choice among cardiologists seeking to enhance patient outcomes while maintaining procedural safety.
As cardiovascular disease rates continue to rise globally and healthcare providers increasingly prioritize advanced technological solutions for complex interventions, the PCI segment is positioned to maintain its market leadership through continued innovation in robotic precision and control capabilities.
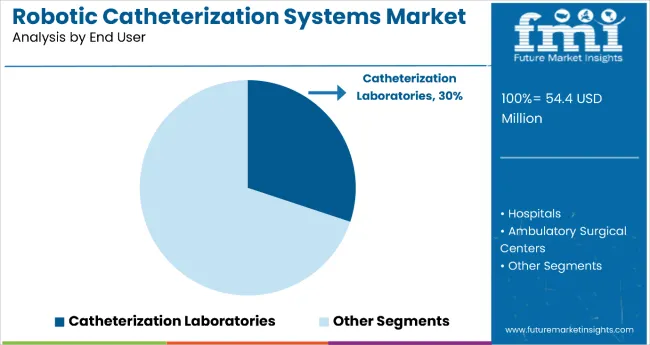
Catheterization laboratories represent a significant segment with 30.1% of the market share in the end user category within the robotic catheterization systems market. This substantial market presence is attributed to catheterization labs' specialized focus on diagnostic and interventional cardiology procedures where precision and control are paramount.
These dedicated facilities are specifically equipped with advanced diagnostic and interventional tools, making them ideal environments for deploying robotic catheterization systems that enhance procedural accuracy and patient outcomes.
The segment's strong position is reinforced by catheterization labs' role in handling high-risk patients and complex cardiovascular cases that particularly benefit from the enhanced precision offered by robotic systems. The continuous advancements in robotic technologies and their proven benefits in cardiovascular care drive further adoption in these specialized facilities.
As the complexity of cardiovascular interventions increases and the demand for precision-guided procedures grows, catheterization laboratories are expected to maintain their significant market position through continued investment in advanced robotic technologies that support their mission of delivering specialized, high-quality cardiovascular care.
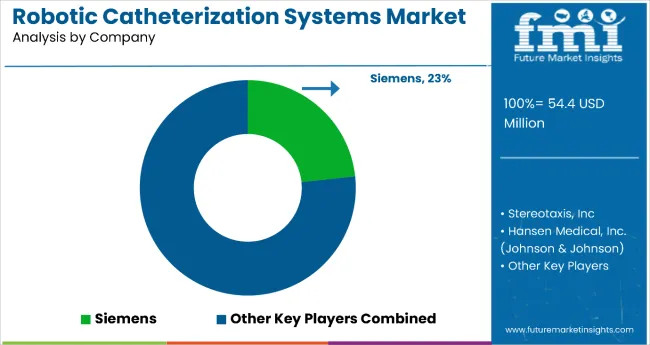
Strategic collaborations, acquisitions, expansion, product launches, agreements and research sponsorship are the key strategies adopted by manufacturers to increase the product sales in different geographies.
Recent Industry Developments in Robotic Catheterization Systems Industry
| Report Attributes | Details |
|---|---|
| Current Total Market Size (2025) | USD 54.4 million |
| Projected Market Size (2035) | USD 189.6 million |
| CAGR (2025 to 2035) | 13.3% |
| Historical Size (2024) | USD 48.2 million |
| Base Year for Estimation | 2024 |
| Forecast Period | 2025 to 2035 |
| Report Parameter | Revenue in USD million |
| By Product Segments | Electromechanical Robotic Catheterization Systems, Magnetic-Guided Robotic Catheterization Systems |
| Applications Analyzed | Percutaneous Coronary Intervention, Cardiac Electrophysiology Procedures |
| End Users Analyzed | Hospitals, Specialty Clinics, Ambulatory Surgical Centers |
| Regions Covered | North America, Europe, Asia Pacific, Latin America, Middle East & Africa |
| Key Players | Siemens, Stereotaxis, Inc, Hansen Medical, Inc. (Johnson & Johnson) |
In terms of product, the industry is divided into- electromechanical robotic catheterization systems and magnetic-guided robotic catheterization systems
In terms of application, the industry is segregated into- percutaneous coronary intervention and cardiac electrophysiology procedures
In terms of end user, the industry is segregated into hospitals, ambulatory surgical centers and catheterization laboratories
Key countries of North America, Latin America, Western Europe, Eastern Europe, South Asia and Pacific, East Asia and Middle East and Africa (MEA) have been covered in the report.
The global robotic catheterization systems market is projected to witness CAGR of 13.3% between 2024 and 2035.
The global sales of robotic catheterization systems stood at USD 48.2 million in 2024.
The global robotic catheterization systems market is anticipated to reach USD 189.6 million by 2035 end.
India is set to record the highest CAGR of 13.9% in the assessment period.
The key players operating in the global robotic catheterization systems market include Siemens, Stereotaxis, Inc and Hansen Medical, Inc. (Johnson & Johnson)


Our Research Products

The "Full Research Suite" delivers actionable market intel, deep dives on markets or technologies, so clients act faster, cut risk, and unlock growth.

The Leaderboard benchmarks and ranks top vendors, classifying them as Established Leaders, Leading Challengers, or Disruptors & Challengers.

Locates where complements amplify value and substitutes erode it, forecasting net impact by horizon

We deliver granular, decision-grade intel: market sizing, 5-year forecasts, pricing, adoption, usage, revenue, and operational KPIs—plus competitor tracking, regulation, and value chains—across 60 countries broadly.

Spot the shifts before they hit your P&L. We track inflection points, adoption curves, pricing moves, and ecosystem plays to show where demand is heading, why it is changing, and what to do next across high-growth markets and disruptive tech

Real-time reads of user behavior. We track shifting priorities, perceptions of today’s and next-gen services, and provider experience, then pace how fast tech moves from trial to adoption, blending buyer, consumer, and channel inputs with social signals (#WhySwitch, #UX).

Partner with our analyst team to build a custom report designed around your business priorities. From analysing market trends to assessing competitors or crafting bespoke datasets, we tailor insights to your needs.
Supplier Intelligence
Discovery & Profiling
Capacity & Footprint
Performance & Risk
Compliance & Governance
Commercial Readiness
Who Supplies Whom
Scorecards & Shortlists
Playbooks & Docs
Category Intelligence
Definition & Scope
Demand & Use Cases
Cost Drivers
Market Structure
Supply Chain Map
Trade & Policy
Operating Norms
Deliverables
Buyer Intelligence
Account Basics
Spend & Scope
Procurement Model
Vendor Requirements
Terms & Policies
Entry Strategy
Pain Points & Triggers
Outputs
Pricing Analysis
Benchmarks
Trends
Should-Cost
Indexation
Landed Cost
Commercial Terms
Deliverables
Brand Analysis
Positioning & Value Prop
Share & Presence
Customer Evidence
Go-to-Market
Digital & Reputation
Compliance & Trust
KPIs & Gaps
Outputs
Full Research Suite comprises of:
Market outlook & trends analysis
Interviews & case studies
Strategic recommendations
Vendor profiles & capabilities analysis
5-year forecasts
8 regions and 60+ country-level data splits
Market segment data splits
12 months of continuous data updates
DELIVERED AS:
PDF EXCEL ONLINE
Robotic Warfare Market Size and Share Forecast Outlook 2025 to 2035
Robotic Lawn Mower Market Size and Share Forecast Outlook 2025 to 2035
Robotics Welding Market Size and Share Forecast Outlook 2025 to 2035
Robotic Rehab Tools Market Analysis - Size, Share, and Forecast Outlook 2025 to 2035
Robotics-Assisted Telesurgery Market Size and Share Forecast Outlook 2025 to 2035
Robotic Packaging Machines Market Size and Share Forecast Outlook 2025 to 2035
Robotic Lung Biopsy Market Size and Share Forecast Outlook 2025 to 2035
Robotics as a Service (RaaS) Market Size and Share Forecast Outlook 2025 to 2035
Robotic X-ray Scanner Market Size and Share Forecast Outlook 2025 to 2035
Robotic Aseptic Syringe Filler Capper Market Size and Share Forecast Outlook 2025 to 2035
Robotic Vision Market Size and Share Forecast Outlook 2025 to 2035
Robotics Actuators Market Size and Share Forecast Outlook 2025 to 2035
Robotic Biopsy Devices Market Insights - Trends & Forecast 2025 to 2035
Robotic Palletizers & De-Palletizers Market Growth - Forecast 2025 to 2035
Robotic Vacuum Cleaners Market Growth - Trends & Demand from 2025 to 2035
The Robotics Market Analysis – Size, Share, and Forecast Outlook 2025 to 2035
Robotics Prototyping Market Trends - Growth & Forecast 2025 to 2035
Robotic Process Automation Market by Component, Operation, Industry & Region Forecast till 2025 to 2035
Competitive Landscape of Robotic Vacuum Cleaner Providers
Robotic Grippers Market Growth - Trends & Forecast 2025 to 2035

Thank you!
You will receive an email from our Business Development Manager. Please be sure to check your SPAM/JUNK folder too.
Chat With
MaRIA