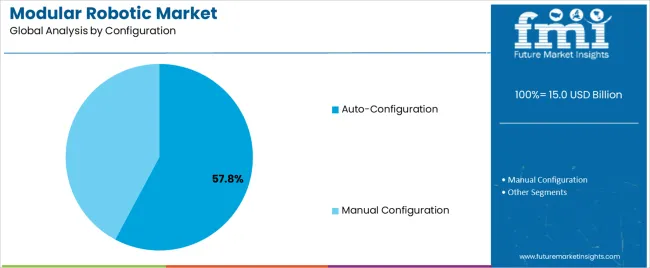
Modular Robotic Market Outlook from 2024 to 2034

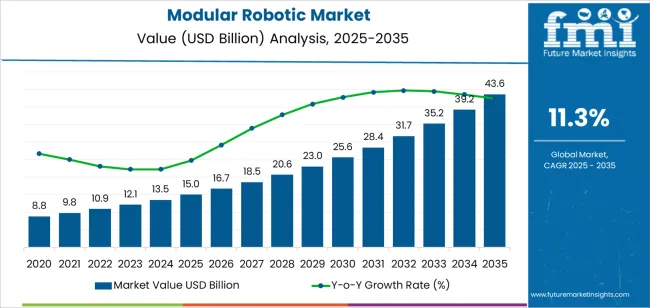
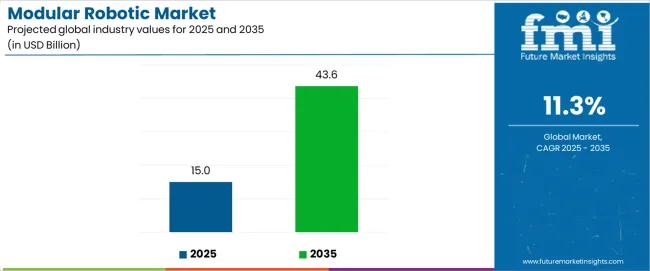
The modular robotic market is poised for an evolutionary journey, extending its influence well into 2034 and beyond. The adoption of modular robotics is estimated to stand at USD 12.69 billion in 2024. The market is forecasted to exceed a valuation of USD 66.42 billion by 2034.

The market is projected to experience staggering growth through 2034, recording a CAGR of 18.0%. Modular robotic demand is primarily driven by increased productivity, lower rejection rates, and scalable operations.

Attributes Details
Estimated Modular Robotic Market Size (2024) USD 12.69 billion
Forecasted Market Size (2034) USD 66.42 billion
Projected Value CAGR (2024 to 2034) 18.0%

Modular Robotic Market Overview

  • As the cost of robotics components continues to decline and accessibility increases, more companies are likely to adopt modular robotics solutions. Consequently, there is likely to be around a 5.2X surge in the sales of modular robotics by 2034.
  • China and Japan are set to offer intense competition in the market due to their significant investments in research and development, robust manufacturing capabilities, and strategic focus on technological advancement.
  • Modular robotic providers need to think outside the box and explore innovative ways to customize their solutions to meet diverse industry needs.

Key Factors Influencing the Global Modular Robotic Market Growth

Modular Robotics Spearhead Workplace Security and Efficiency!

The need to augment human workers with robotic assistance, particularly in industries with labor shortages or hazardous working environments, drives the market growth.

  • By automating repetitive or dangerous tasks, modular robotics improve workplace safety and reduce the risk of injuries.
  • These systems can enhance productivity by working alongside human operators. They leverage the strengths of both humans and robots to achieve optimal efficiency in various tasks.

Modular Robotics Revolutionized Industry Automation!

Increasing demand for automation across industries, driven by labor shortages, rising labor costs, and the need for operational efficiency, fuels the growth of the modular robotic market.

  • Businesses seek to leverage automation technologies, including modular robotics, to streamline processes, increase productivity, and maintain competitiveness in global markets.
  • This market demand creates opportunities for robotics companies to develop innovative modular solutions that address specific industry challenges and deliver tangible value to customers.

Customizable Robotics Redefine Industry Solutions!

The market is also driven by the demand for customizable solutions that can be tailored to specific industry needs and applications.

  • This customization allows businesses to innovate and differentiate their products or services, catering to niche markets or addressing unique challenges.
  • By offering modular platforms, robotics companies empower customers to experiment with different configurations and functionalities.

Obstacles Compressing the Modular Robotic Market Revenue Trends

While the market shows promising growth, certain challenges hinder its full potential. Limited standardization across modules complicates seamless integration. Additionally, concerns about cybersecurity and data privacy pose barriers to widespread adoption.

Historical Market Study on Modular Robotic alongside Future Projections

From 2019 to 2023, the modular robotic market showed strong growth as well, boasting a 16.3% CAGR. Different types of modular robot designs have been made. Some robots, called self-reconfiguring modular robots, can change shape by themselves. These robots can reconfigure without needing help from outside. This trend has contributed to the positive outlook of the Modular Robotic industry.

Attributes Quantitative Outlook
Modular Robotic Market Size (2023) USD 10.75 billion
Historical CAGR (2019 to 2023) 16.3%

Short-term Modular Robotic Market Analysis

The modular robotic market global forecast suggests considerable growth owing to the growing demand for modular robots in various sectors. They are being increasingly used in industries such as manufacturing, healthcare, and agriculture. Additionally, there is a trend toward modular robots becoming more affordable and accessible to a wider range of users. Because of this, the modular robot market is anticipated to grow significantly over the next few years.

Long-term Modular Robotic Market Analysis

Global trends in the modular robotic industry spotlight a dynamic landscape. One notable trend is the implementation of modular robots on Industry 4.0 principles, such as automation, data exchange, and smart manufacturing. Industry 4.0 encourages adaptive manufacturing processes that can quickly respond to changes in demand or production requirements.

Modular robots are well-suited for adaptive manufacturing environments. This is expected to have a highly positive impact on the global demand for modular robotics in the long run.

Top Opportunities for Modular Robotics Providers

The emergence of modular robotics presents significant opportunities for players in the market. For instance, Modbot's pioneering platform has paved the way for innovation and growth in the global modular robotic market.

By offering a system of reusable modules that can be easily assembled into various robotic configurations, companies can explore new avenues for product development and customization. This allows market players to address a wide range of applications and industries, leading to an increased share in the modular robotic industry.

Modular Robotic Market Trends

  • The market is witnessing a shift toward a robotics-as-a-service model and plug-and-play modular robotic systems that can be easily integrated into existing production lines.
  • Another evolving trend in the modular robotic market is the incorporation of artificial intelligence and machine learning algorithms to enhance autonomy, adaptability, and decision-making capabilities.
  • Modular robotic sales are increasing as companies are demanding modular robots that can be easily customized and configured to meet specific application requirements.

Demand Analysis of Modular Robotic by Region

The North America modular robotic market stands out as a moderately performing regional market. Top players are teaming up with different companies that offer gripping systems and similar tech to improve their robot business. Europe is witnessing continuous and steady growth in demand for modular robotics. This can be attributed to the increasing automation needs across industries.

The Asia Pacific modular robotic industry is likely to progress significantly. Rising IT investments supported by government programs in countries like China, Japan, and South Korea are anticipated to boost growth in this region.

Countries Forecasted CAGR (2024 to 2034)
United States 16.70%
Germany 19.80%
South Korea 20.20%
China 21.80%
Japan 22.25%

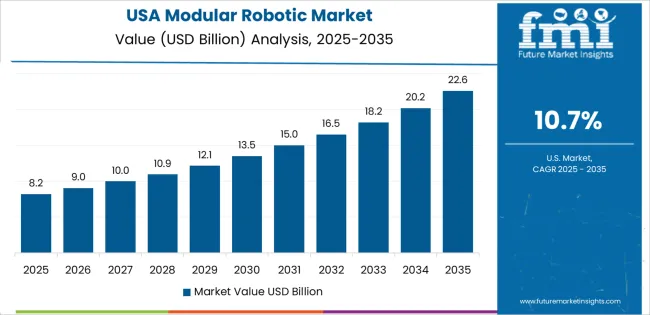
Modular Robotics are Set to Transform Manufacturing and Logistic Landscape in the United States

Demand for modular robotics in the United States is set to rise with an anticipated CAGR of 16.70% through 2034. Key factors influencing the modular robotic market include:
  • Many manufacturers here are embracing cloud technology and investing in research and development to cut down on labor expenses. This trend is expected to assist dispensing robot manufacturers in making their modular robots more affordable. It is also likely to help them expand their reach in both local and global markets.
  • The unique features of modular robots are likely to increase their acceptance rate in the United States, contributing to market growth. The adoption of these robots in the manufacturing and logistics industry throughout the country is expected to drive continued progress in the market.

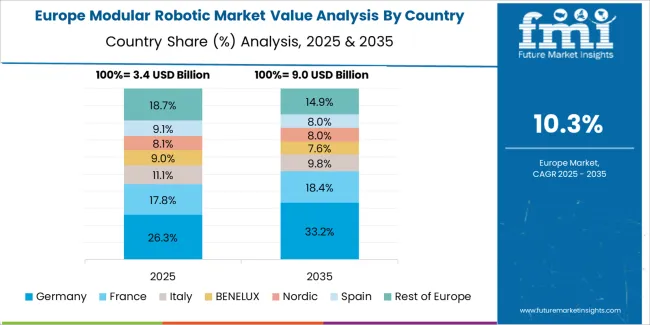
Precision Engineering and Startup Innovation Propel Modular Robotic Adoption in Germany

The Germany modular robotic market is expected to surge at a CAGR of 19.80% through 2034. The topmost dynamic forces supporting the modular robotic adoption in the country include:
  • Germany's expertise in precision engineering is poised to significantly influence the market. The country's proficiency in crafting highly accurate components is anticipated to enhance the performance of modular robotics systems.
  • The convergence of start-up culture and ample funding is poised to revolutionize the market in Germany. In February 2024, a Germany-based robotics startup called RobCo secured USD 43 million to automate smaller factories. The company's modular robots are made to be affordable.

Establishment of Robot Platforms Sparks Revolution in Modular Robotics in South Korea

The market in South Korea is likely to exhibit a CAGR of 20.20% through 2034. Reasons supporting the growth of the modular robotic market in the country include:

  • Emerging startups are poised to make a significant impact on the market in South Korea. For instance, a Seoul-based startup called Robot Factory has turned to Kickstarter to introduce its PingPong modular robot platform. This platform allows users to build various types of robots, including snake bots, drawing bots, and robotic arms, among many others.
  • As South Korea continues to top in technological advancements, particularly in robotics and automation, this control is likely to drive innovation and growth within the modular robotics sector.

Modular Robotics Adoption Skyrockets in China with Groundbreaking Developments

The adoption of modular robotics in China is forecasted to inflate at a CAGR of 21.80% through 2034. Prominent factors backing up the growth in the modular robotic industry are:
  • The exponential growth of the eCommerce and logistics industries is poised to have a profound impact on the modular robotics market in China. As more businesses embrace online retail platforms and streamline their logistics operations, the demand for efficient automation solutions like robotics is likely to skyrocket.
  • In June 2023, a team of researchers from Guangzhou University, Yanshan University, and other China-based universities developed a novel modular continuous robot. The robot has the ability to contract and bend following specific patterns, allowing it to accomplish various tasks. This breakthrough is likely to lead to increased investment and interest in modular robotics research and development in China.

Modular Robotics Gain Traction in Japan amidst Technological Advancements

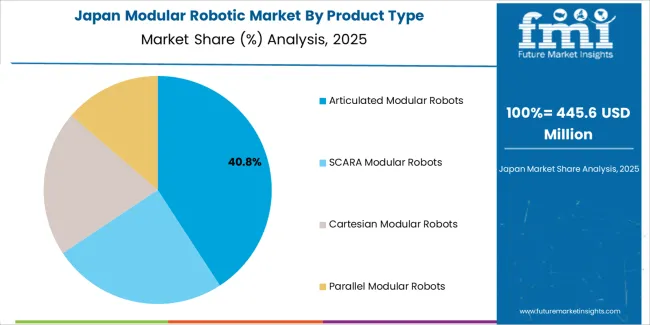
Sales of modular robotics in Japan are estimated to record a CAGR of 22.25% through 2034. The primary factors bolstering the modular robot market size are:

  • In Japan, the production and advancement of robot technology have seen significant growth. Robots were mainly used in assembling electronics and cars. But now, people are also interested in using robots in healthcare to help with Japan's aging population.
  • When it comes to the industrial robotics market size, Japan has notable leaders like Fanuc, Mitsubishi Electric, and Kawasaki Heavy Industries. Japan-based companies, with Toyota Motor Corporation at the forefront, also hold a significant number of patents in the field of modular robotics.

Modular Robotic Industry Analysis by Segment

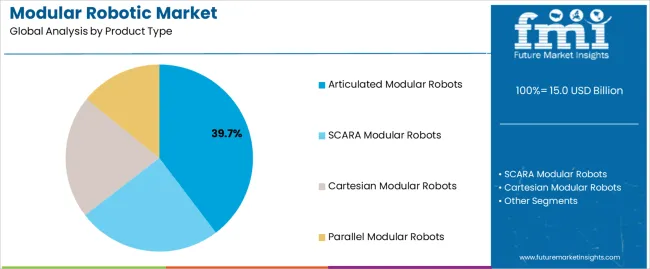
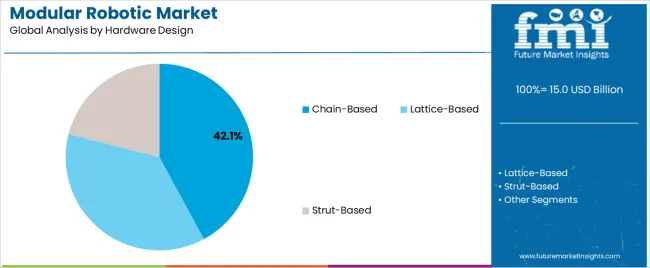
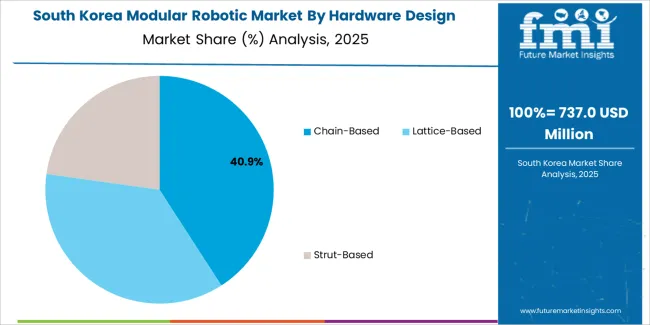
As far as the product type of modular robotic is concerned, the SCARA modular robots segment is likely to acquire 27.30% modular robotic market share. Similarly, the chain-based segment is expected to gain considerable profit in terms of hardware design, possessing a 38.80% revenue share of modular robotic industry in 2024.

Segment Estimated Market Share in 2024
SCARA Modular Robots 27.30%
Chain-based Modular Robotics 38.80%

SCARA Modular Robots Gain Favor in this Highly Competitive Market

The SCARA modular robots segment is anticipated to perform better than others in the market. Here are a few key factors that contribute to SCARA’s acceptance in the market:

  • Given their great repeatability and precision, SCARA modular robots are a good choice for operations that call for accuracy.
  • Because of its famed quickness and agility, SCARA robots facilitate accurate and timely tasks on the manufacturing line.
  • The affordability of SCARA modular robots compared to other robotic solutions makes them an attractive option for businesses seeking cost-effective automation solutions.

Chain-Based Module Robotics are Set to Redefine Efficiency and Durability Standards

The chain-based segment is set to take more than 1/3rd market share, a trend validated by factors such as:
  • Chain-based systems offer unparalleled flexibility in configuration and adaptability to various tasks and environments.
  • These systems are appropriate for multiple applications and sectors because they can be readily scaled up or down by adding or deleting modules.
  • The design of chain-based segments typically ensures robustness and reliability in operation, minimizing downtime and maintenance costs.

Competitive Landscape

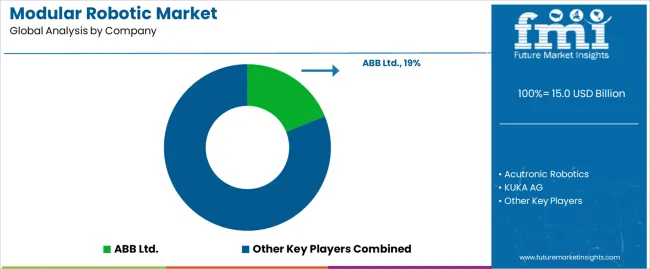
Modular robotic market players implement diverse strategies to gain an edge in this fiercely competitive market. Some focus on offering versatile modular systems adaptable to diverse applications. In the meantime, others prioritize affordability and scalability. Many emphasize top-notch technology integration to enhance functionality and autonomy.

Additionally, market players explore strategic partnerships and collaborations to broaden their reach and leverage complementary expertise. Amidst competition, innovation and differentiation remain key drivers for market leadership.

Recent Developments

  • In February 2024, OMRON introduced fresh autonomous mobile robot (AMR) options, including lifter and roller modules from ROEQ. Companies aiming to use AMRs in their space often find that an AMR without a top module is similar to a robot arm without a gripper.
  • In December 2023, QYSEA Technology revealed its latest underwater tool, the FIFISH E-GO. This new device has a modular structure and better power and imaging. It can carry multiple loads and comes with AI capabilities. These features make it the most advanced underwater robot from QYSEA so far.
  • In January 2023, Ottonomy unveiled the Ottobot YETI, a new autonomous delivery robot. It is the first of its kind, with customizable features and interchangeable cabins to suit the specific requirements of retail, restaurants, and curbside deliveries.

Key Modular Robotic Market Players

  • ABB Ltd.
  • Acutronic Robotics
  • KUKA AG
  • Mitsubishi Electric Corp.
  • FANUC Corporation
  • Kawasaki Heavy Industries Ltd.
  • Yaskawa Electric Corporation
  • Denso Corporation
  • Universal Robots
  • Nachi-Fujikoshi Corp.
  • Rethink Robotics

Key Coverage in the Modular Robotic Market Research Report

  • Adjacent Study on the Flexible Robotics Market, Reconfigurable Robotics Market, Adaptive Robotics Market
  • Opportunity Assessment in the Modular Automation Market and Customizable Robotics Market
  • Recent Key Advancements in the Configurable Robotic Solutions Market
  • Competitive Analysis between the Interchangeable Robotics Market and Interchangeable Robotic Components Market
  • Updated Emerging Trends in Modular Robotics Market
  • Top 10 Companies in the Scalable Automation Solutions Market
  • Potential of Versatile Robotic Platforms Market in Asia Pacific

Key Segments in the Modular Robotics Global Market Report

By Product Type:

  • SCARA Modular Robots
  • Articulated Modular Robots
  • Cartesian Modular Robots
  • Parallel Modular Robots

By Hardware Design:

  • Chain-based
  • Lattice-based
  • Strut-based

By Configuration:

  • Auto-Configuration
  • Manual Configuration

By End Use Industry:

  • Automotive
  • Electronics & Electrical
  • Chemical
  • Food & Beverages
  • Pharmaceutical
  • Others

By Region:

  • North America
  • Latin America
  • Asia Pacific
  • Europe
  • MEA

Table of Content

  • 1. Executive Summary
  • 2. Market Overview
  • 3. Market Background
  • 4. Global Market Analysis 2019 to 2023 and Forecast, 2024 to 2034
  • 5. Global Market Analysis 2019 to 2023 and Forecast 2024 to 2034, By Product Type
    • 5.1. SCARA Modular Robots
    • 5.2. Articulated Modular Robots
    • 5.3. Cartesian Modular Robots
    • 5.4. Parallel Modular Robots
  • 6. Global Market Analysis 2019 to 2023 and Forecast 2024 to 2034, By Hardware Design
    • 6.1. Chain-Based
    • 6.2. Lattice-Based
    • 6.3. Strut-Based
  • 7. Global Market Analysis 2019 to 2023 and Forecast 2024 to 2034, By Configuration
    • 7.1. Auto-Configuration
    • 7.2. Manual Configuration
  • 8. Global Market Analysis 2019 to 2023 and Forecast 2024 to 2034, By End Use Industry
    • 8.1. Automotive
    • 8.2. Electronics & Electrical
    • 8.3. Chemical
    • 8.4. Food & Beverages
    • 8.5. Pharmaceutical
    • 8.6. Others
  • 9. Global Market Analysis 2019 to 2023 and Forecast 2024 to 2034, By Region
    • 9.1. North America
    • 9.2. Latin America
    • 9.3. Western Europe
    • 9.4. Eastern Europe
    • 9.5. South Asia and Pacific
    • 9.6. East Asia
    • 9.7. Middle East and Africa
  • 10. North America Market Analysis 2019 to 2023 and Forecast 2024 to 2034, By Country
  • 11. Latin America Market Analysis 2019 to 2023 and Forecast 2024 to 2034, By Country
  • 12. Western Europe Market Analysis 2019 to 2023 and Forecast 2024 to 2034, By Country
  • 13. Eastern Europe Market Analysis 2019 to 2023 and Forecast 2024 to 2034, By Country
  • 14. South Asia and Pacific Market Analysis 2019 to 2023 and Forecast 2024 to 2034, By Country
  • 15. East Asia Market Analysis 2019 to 2023 and Forecast 2024 to 2034, By Country
  • 16. Middle East and Africa Market Analysis 2019 to 2023 and Forecast 2024 to 2034, By Country
  • 17. Key Countries Market Analysis
  • 18. Market Structure Analysis
  • 19. Competition Analysis
    • 19.1. ABB Ltd.
    • 19.2. FANUC Corporation
    • 19.3. Mitsubishi Electric Corporation
    • 19.4. Yaskawa Robotics
    • 19.5. Kawasaki Heavy Industries, Ltd.
    • 19.6. Aurotek Corporation
    • 19.7. Universal Robots
    • 19.8. DENSO
    • 19.9. A.C.M.I. spa
    • 19.10. CMA Robotics Spa
    • 19.11. Rethink Robotics GmbH
  • 20. Assumptions & Acronyms Used
  • 21. Research Methodology

List of Tables

Table 1: Global Market Value (US$ Million) Forecast by Region, 2019 to 2034

Table 2: Global Market Volume (Units) Forecast by Region, 2019 to 2034

Table 3: Global Market Value (US$ Million) Forecast by Product Type, 2019 to 2034

Table 4: Global Market Volume (Units) Forecast by Product Type, 2019 to 2034

Table 5: Global Market Value (US$ Million) Forecast by Hardware Design, 2019 to 2034

Table 6: Global Market Volume (Units) Forecast by Hardware Design, 2019 to 2034

Table 7: Global Market Value (US$ Million) Forecast by Configuration, 2019 to 2034

Table 8: Global Market Volume (Units) Forecast by Configuration, 2019 to 2034

Table 9: Global Market Value (US$ Million) Forecast by End Use Industry, 2019 to 2034

Table 10: Global Market Volume (Units) Forecast by End Use Industry, 2019 to 2034

Table 11: North America Market Value (US$ Million) Forecast by Country, 2019 to 2034

Table 12: North America Market Volume (Units) Forecast by Country, 2019 to 2034

Table 13: North America Market Value (US$ Million) Forecast by Product Type, 2019 to 2034

Table 14: North America Market Volume (Units) Forecast by Product Type, 2019 to 2034

Table 15: North America Market Value (US$ Million) Forecast by Hardware Design, 2019 to 2034

Table 16: North America Market Volume (Units) Forecast by Hardware Design, 2019 to 2034

Table 17: North America Market Value (US$ Million) Forecast by Configuration, 2019 to 2034

Table 18: North America Market Volume (Units) Forecast by Configuration, 2019 to 2034

Table 19: North America Market Value (US$ Million) Forecast by End Use Industry, 2019 to 2034

Table 20: North America Market Volume (Units) Forecast by End Use Industry, 2019 to 2034

Table 21: Latin America Market Value (US$ Million) Forecast by Country, 2019 to 2034

Table 22: Latin America Market Volume (Units) Forecast by Country, 2019 to 2034

Table 23: Latin America Market Value (US$ Million) Forecast by Product Type, 2019 to 2034

Table 24: Latin America Market Volume (Units) Forecast by Product Type, 2019 to 2034

Table 25: Latin America Market Value (US$ Million) Forecast by Hardware Design, 2019 to 2034

Table 26: Latin America Market Volume (Units) Forecast by Hardware Design, 2019 to 2034

Table 27: Latin America Market Value (US$ Million) Forecast by Configuration, 2019 to 2034

Table 28: Latin America Market Volume (Units) Forecast by Configuration, 2019 to 2034

Table 29: Latin America Market Value (US$ Million) Forecast by End Use Industry, 2019 to 2034

Table 30: Latin America Market Volume (Units) Forecast by End Use Industry, 2019 to 2034

Table 31: Western Europe Market Value (US$ Million) Forecast by Country, 2019 to 2034

Table 32: Western Europe Market Volume (Units) Forecast by Country, 2019 to 2034

Table 33: Western Europe Market Value (US$ Million) Forecast by Product Type, 2019 to 2034

Table 34: Western Europe Market Volume (Units) Forecast by Product Type, 2019 to 2034

Table 35: Western Europe Market Value (US$ Million) Forecast by Hardware Design, 2019 to 2034

Table 36: Western Europe Market Volume (Units) Forecast by Hardware Design, 2019 to 2034

Table 37: Western Europe Market Value (US$ Million) Forecast by Configuration, 2019 to 2034

Table 38: Western Europe Market Volume (Units) Forecast by Configuration, 2019 to 2034

Table 39: Western Europe Market Value (US$ Million) Forecast by End Use Industry, 2019 to 2034

Table 40: Western Europe Market Volume (Units) Forecast by End Use Industry, 2019 to 2034

Table 41: Eastern Europe Market Value (US$ Million) Forecast by Country, 2019 to 2034

Table 42: Eastern Europe Market Volume (Units) Forecast by Country, 2019 to 2034

Table 43: Eastern Europe Market Value (US$ Million) Forecast by Product Type, 2019 to 2034

Table 44: Eastern Europe Market Volume (Units) Forecast by Product Type, 2019 to 2034

Table 45: Eastern Europe Market Value (US$ Million) Forecast by Hardware Design, 2019 to 2034

Table 46: Eastern Europe Market Volume (Units) Forecast by Hardware Design, 2019 to 2034

Table 47: Eastern Europe Market Value (US$ Million) Forecast by Configuration, 2019 to 2034

Table 48: Eastern Europe Market Volume (Units) Forecast by Configuration, 2019 to 2034

Table 49: Eastern Europe Market Value (US$ Million) Forecast by End Use Industry, 2019 to 2034

Table 50: Eastern Europe Market Volume (Units) Forecast by End Use Industry, 2019 to 2034

Table 51: South Asia and Pacific Market Value (US$ Million) Forecast by Country, 2019 to 2034

Table 52: South Asia and Pacific Market Volume (Units) Forecast by Country, 2019 to 2034

Table 53: South Asia and Pacific Market Value (US$ Million) Forecast by Product Type, 2019 to 2034

Table 54: South Asia and Pacific Market Volume (Units) Forecast by Product Type, 2019 to 2034

Table 55: South Asia and Pacific Market Value (US$ Million) Forecast by Hardware Design, 2019 to 2034

Table 56: South Asia and Pacific Market Volume (Units) Forecast by Hardware Design, 2019 to 2034

Table 57: South Asia and Pacific Market Value (US$ Million) Forecast by Configuration, 2019 to 2034

Table 58: South Asia and Pacific Market Volume (Units) Forecast by Configuration, 2019 to 2034

Table 59: South Asia and Pacific Market Value (US$ Million) Forecast by End Use Industry, 2019 to 2034

Table 60: South Asia and Pacific Market Volume (Units) Forecast by End Use Industry, 2019 to 2034

Table 61: East Asia Market Value (US$ Million) Forecast by Country, 2019 to 2034

Table 62: East Asia Market Volume (Units) Forecast by Country, 2019 to 2034

Table 63: East Asia Market Value (US$ Million) Forecast by Product Type, 2019 to 2034

Table 64: East Asia Market Volume (Units) Forecast by Product Type, 2019 to 2034

Table 65: East Asia Market Value (US$ Million) Forecast by Hardware Design, 2019 to 2034

Table 66: East Asia Market Volume (Units) Forecast by Hardware Design, 2019 to 2034

Table 67: East Asia Market Value (US$ Million) Forecast by Configuration, 2019 to 2034

Table 68: East Asia Market Volume (Units) Forecast by Configuration, 2019 to 2034

Table 69: East Asia Market Value (US$ Million) Forecast by End Use Industry, 2019 to 2034

Table 70: East Asia Market Volume (Units) Forecast by End Use Industry, 2019 to 2034

Table 71: Middle East and Africa Market Value (US$ Million) Forecast by Country, 2019 to 2034

Table 72: Middle East and Africa Market Volume (Units) Forecast by Country, 2019 to 2034

Table 73: Middle East and Africa Market Value (US$ Million) Forecast by Product Type, 2019 to 2034

Table 74: Middle East and Africa Market Volume (Units) Forecast by Product Type, 2019 to 2034

Table 75: Middle East and Africa Market Value (US$ Million) Forecast by Hardware Design, 2019 to 2034

Table 76: Middle East and Africa Market Volume (Units) Forecast by Hardware Design, 2019 to 2034

Table 77: Middle East and Africa Market Value (US$ Million) Forecast by Configuration, 2019 to 2034

Table 78: Middle East and Africa Market Volume (Units) Forecast by Configuration, 2019 to 2034

Table 79: Middle East and Africa Market Value (US$ Million) Forecast by End Use Industry, 2019 to 2034

Table 80: Middle East and Africa Market Volume (Units) Forecast by End Use Industry, 2019 to 2034

List of Figures

Figure 1: Global Market Value (US$ Million) by Product Type, 2024 to 2034

Figure 2: Global Market Value (US$ Million) by Hardware Design, 2024 to 2034

Figure 3: Global Market Value (US$ Million) by Configuration, 2024 to 2034

Figure 4: Global Market Value (US$ Million) by End Use Industry, 2024 to 2034

Figure 5: Global Market Value (US$ Million) by Region, 2024 to 2034

Figure 6: Global Market Value (US$ Million) Analysis by Region, 2019 to 2034

Figure 7: Global Market Volume (Units) Analysis by Region, 2019 to 2034

Figure 8: Global Market Value Share (%) and BPS Analysis by Region, 2024 to 2034

Figure 9: Global Market Y-o-Y Growth (%) Projections by Region, 2024 to 2034

Figure 10: Global Market Value (US$ Million) Analysis by Product Type, 2019 to 2034

Figure 11: Global Market Volume (Units) Analysis by Product Type, 2019 to 2034

Figure 12: Global Market Value Share (%) and BPS Analysis by Product Type, 2024 to 2034

Figure 13: Global Market Y-o-Y Growth (%) Projections by Product Type, 2024 to 2034

Figure 14: Global Market Value (US$ Million) Analysis by Hardware Design, 2019 to 2034

Figure 15: Global Market Volume (Units) Analysis by Hardware Design, 2019 to 2034

Figure 16: Global Market Value Share (%) and BPS Analysis by Hardware Design, 2024 to 2034

Figure 17: Global Market Y-o-Y Growth (%) Projections by Hardware Design, 2024 to 2034

Figure 18: Global Market Value (US$ Million) Analysis by Configuration, 2019 to 2034

Figure 19: Global Market Volume (Units) Analysis by Configuration, 2019 to 2034

Figure 20: Global Market Value Share (%) and BPS Analysis by Configuration, 2024 to 2034

Figure 21: Global Market Y-o-Y Growth (%) Projections by Configuration, 2024 to 2034

Figure 22: Global Market Value (US$ Million) Analysis by End Use Industry, 2019 to 2034

Figure 23: Global Market Volume (Units) Analysis by End Use Industry, 2019 to 2034

Figure 24: Global Market Value Share (%) and BPS Analysis by End Use Industry, 2024 to 2034

Figure 25: Global Market Y-o-Y Growth (%) Projections by End Use Industry, 2024 to 2034

Figure 26: Global Market Attractiveness by Product Type, 2024 to 2034

Figure 27: Global Market Attractiveness by Hardware Design, 2024 to 2034

Figure 28: Global Market Attractiveness by Configuration, 2024 to 2034

Figure 29: Global Market Attractiveness by End Use Industry, 2024 to 2034

Figure 30: Global Market Attractiveness by Region, 2024 to 2034

Figure 31: North America Market Value (US$ Million) by Product Type, 2024 to 2034

Figure 32: North America Market Value (US$ Million) by Hardware Design, 2024 to 2034

Figure 33: North America Market Value (US$ Million) by Configuration, 2024 to 2034

Figure 34: North America Market Value (US$ Million) by End Use Industry, 2024 to 2034

Figure 35: North America Market Value (US$ Million) by Country, 2024 to 2034

Figure 36: North America Market Value (US$ Million) Analysis by Country, 2019 to 2034

Figure 37: North America Market Volume (Units) Analysis by Country, 2019 to 2034

Figure 38: North America Market Value Share (%) and BPS Analysis by Country, 2024 to 2034

Figure 39: North America Market Y-o-Y Growth (%) Projections by Country, 2024 to 2034

Figure 40: North America Market Value (US$ Million) Analysis by Product Type, 2019 to 2034

Figure 41: North America Market Volume (Units) Analysis by Product Type, 2019 to 2034

Figure 42: North America Market Value Share (%) and BPS Analysis by Product Type, 2024 to 2034

Figure 43: North America Market Y-o-Y Growth (%) Projections by Product Type, 2024 to 2034

Figure 44: North America Market Value (US$ Million) Analysis by Hardware Design, 2019 to 2034

Figure 45: North America Market Volume (Units) Analysis by Hardware Design, 2019 to 2034

Figure 46: North America Market Value Share (%) and BPS Analysis by Hardware Design, 2024 to 2034

Figure 47: North America Market Y-o-Y Growth (%) Projections by Hardware Design, 2024 to 2034

Figure 48: North America Market Value (US$ Million) Analysis by Configuration, 2019 to 2034

Figure 49: North America Market Volume (Units) Analysis by Configuration, 2019 to 2034

Figure 50: North America Market Value Share (%) and BPS Analysis by Configuration, 2024 to 2034

Figure 51: North America Market Y-o-Y Growth (%) Projections by Configuration, 2024 to 2034

Figure 52: North America Market Value (US$ Million) Analysis by End Use Industry, 2019 to 2034

Figure 53: North America Market Volume (Units) Analysis by End Use Industry, 2019 to 2034

Figure 54: North America Market Value Share (%) and BPS Analysis by End Use Industry, 2024 to 2034

Figure 55: North America Market Y-o-Y Growth (%) Projections by End Use Industry, 2024 to 2034

Figure 56: North America Market Attractiveness by Product Type, 2024 to 2034

Figure 57: North America Market Attractiveness by Hardware Design, 2024 to 2034

Figure 58: North America Market Attractiveness by Configuration, 2024 to 2034

Figure 59: North America Market Attractiveness by End Use Industry, 2024 to 2034

Figure 60: North America Market Attractiveness by Country, 2024 to 2034

Figure 61: Latin America Market Value (US$ Million) by Product Type, 2024 to 2034

Figure 62: Latin America Market Value (US$ Million) by Hardware Design, 2024 to 2034

Figure 63: Latin America Market Value (US$ Million) by Configuration, 2024 to 2034

Figure 64: Latin America Market Value (US$ Million) by End Use Industry, 2024 to 2034

Figure 65: Latin America Market Value (US$ Million) by Country, 2024 to 2034

Figure 66: Latin America Market Value (US$ Million) Analysis by Country, 2019 to 2034

Figure 67: Latin America Market Volume (Units) Analysis by Country, 2019 to 2034

Figure 68: Latin America Market Value Share (%) and BPS Analysis by Country, 2024 to 2034

Figure 69: Latin America Market Y-o-Y Growth (%) Projections by Country, 2024 to 2034

Figure 70: Latin America Market Value (US$ Million) Analysis by Product Type, 2019 to 2034

Figure 71: Latin America Market Volume (Units) Analysis by Product Type, 2019 to 2034

Figure 72: Latin America Market Value Share (%) and BPS Analysis by Product Type, 2024 to 2034

Figure 73: Latin America Market Y-o-Y Growth (%) Projections by Product Type, 2024 to 2034

Figure 74: Latin America Market Value (US$ Million) Analysis by Hardware Design, 2019 to 2034

Figure 75: Latin America Market Volume (Units) Analysis by Hardware Design, 2019 to 2034

Figure 76: Latin America Market Value Share (%) and BPS Analysis by Hardware Design, 2024 to 2034

Figure 77: Latin America Market Y-o-Y Growth (%) Projections by Hardware Design, 2024 to 2034

Figure 78: Latin America Market Value (US$ Million) Analysis by Configuration, 2019 to 2034

Figure 79: Latin America Market Volume (Units) Analysis by Configuration, 2019 to 2034

Figure 80: Latin America Market Value Share (%) and BPS Analysis by Configuration, 2024 to 2034

Figure 81: Latin America Market Y-o-Y Growth (%) Projections by Configuration, 2024 to 2034

Figure 82: Latin America Market Value (US$ Million) Analysis by End Use Industry, 2019 to 2034

Figure 83: Latin America Market Volume (Units) Analysis by End Use Industry, 2019 to 2034

Figure 84: Latin America Market Value Share (%) and BPS Analysis by End Use Industry, 2024 to 2034

Figure 85: Latin America Market Y-o-Y Growth (%) Projections by End Use Industry, 2024 to 2034

Figure 86: Latin America Market Attractiveness by Product Type, 2024 to 2034

Figure 87: Latin America Market Attractiveness by Hardware Design, 2024 to 2034

Figure 88: Latin America Market Attractiveness by Configuration, 2024 to 2034

Figure 89: Latin America Market Attractiveness by End Use Industry, 2024 to 2034

Figure 90: Latin America Market Attractiveness by Country, 2024 to 2034

Figure 91: Western Europe Market Value (US$ Million) by Product Type, 2024 to 2034

Figure 92: Western Europe Market Value (US$ Million) by Hardware Design, 2024 to 2034

Figure 93: Western Europe Market Value (US$ Million) by Configuration, 2024 to 2034

Figure 94: Western Europe Market Value (US$ Million) by End Use Industry, 2024 to 2034

Figure 95: Western Europe Market Value (US$ Million) by Country, 2024 to 2034

Figure 96: Western Europe Market Value (US$ Million) Analysis by Country, 2019 to 2034

Figure 97: Western Europe Market Volume (Units) Analysis by Country, 2019 to 2034

Figure 98: Western Europe Market Value Share (%) and BPS Analysis by Country, 2024 to 2034

Figure 99: Western Europe Market Y-o-Y Growth (%) Projections by Country, 2024 to 2034

Figure 100: Western Europe Market Value (US$ Million) Analysis by Product Type, 2019 to 2034

Figure 101: Western Europe Market Volume (Units) Analysis by Product Type, 2019 to 2034

Figure 102: Western Europe Market Value Share (%) and BPS Analysis by Product Type, 2024 to 2034

Figure 103: Western Europe Market Y-o-Y Growth (%) Projections by Product Type, 2024 to 2034

Figure 104: Western Europe Market Value (US$ Million) Analysis by Hardware Design, 2019 to 2034

Figure 105: Western Europe Market Volume (Units) Analysis by Hardware Design, 2019 to 2034

Figure 106: Western Europe Market Value Share (%) and BPS Analysis by Hardware Design, 2024 to 2034

Figure 107: Western Europe Market Y-o-Y Growth (%) Projections by Hardware Design, 2024 to 2034

Figure 108: Western Europe Market Value (US$ Million) Analysis by Configuration, 2019 to 2034

Figure 109: Western Europe Market Volume (Units) Analysis by Configuration, 2019 to 2034

Figure 110: Western Europe Market Value Share (%) and BPS Analysis by Configuration, 2024 to 2034

Figure 111: Western Europe Market Y-o-Y Growth (%) Projections by Configuration, 2024 to 2034

Figure 112: Western Europe Market Value (US$ Million) Analysis by End Use Industry, 2019 to 2034

Figure 113: Western Europe Market Volume (Units) Analysis by End Use Industry, 2019 to 2034

Figure 114: Western Europe Market Value Share (%) and BPS Analysis by End Use Industry, 2024 to 2034

Figure 115: Western Europe Market Y-o-Y Growth (%) Projections by End Use Industry, 2024 to 2034

Figure 116: Western Europe Market Attractiveness by Product Type, 2024 to 2034

Figure 117: Western Europe Market Attractiveness by Hardware Design, 2024 to 2034

Figure 118: Western Europe Market Attractiveness by Configuration, 2024 to 2034

Figure 119: Western Europe Market Attractiveness by End Use Industry, 2024 to 2034

Figure 120: Western Europe Market Attractiveness by Country, 2024 to 2034

Figure 121: Eastern Europe Market Value (US$ Million) by Product Type, 2024 to 2034

Figure 122: Eastern Europe Market Value (US$ Million) by Hardware Design, 2024 to 2034

Figure 123: Eastern Europe Market Value (US$ Million) by Configuration, 2024 to 2034

Figure 124: Eastern Europe Market Value (US$ Million) by End Use Industry, 2024 to 2034

Figure 125: Eastern Europe Market Value (US$ Million) by Country, 2024 to 2034

Figure 126: Eastern Europe Market Value (US$ Million) Analysis by Country, 2019 to 2034

Figure 127: Eastern Europe Market Volume (Units) Analysis by Country, 2019 to 2034

Figure 128: Eastern Europe Market Value Share (%) and BPS Analysis by Country, 2024 to 2034

Figure 129: Eastern Europe Market Y-o-Y Growth (%) Projections by Country, 2024 to 2034

Figure 130: Eastern Europe Market Value (US$ Million) Analysis by Product Type, 2019 to 2034

Figure 131: Eastern Europe Market Volume (Units) Analysis by Product Type, 2019 to 2034

Figure 132: Eastern Europe Market Value Share (%) and BPS Analysis by Product Type, 2024 to 2034

Figure 133: Eastern Europe Market Y-o-Y Growth (%) Projections by Product Type, 2024 to 2034

Figure 134: Eastern Europe Market Value (US$ Million) Analysis by Hardware Design, 2019 to 2034

Figure 135: Eastern Europe Market Volume (Units) Analysis by Hardware Design, 2019 to 2034

Figure 136: Eastern Europe Market Value Share (%) and BPS Analysis by Hardware Design, 2024 to 2034

Figure 137: Eastern Europe Market Y-o-Y Growth (%) Projections by Hardware Design, 2024 to 2034

Figure 138: Eastern Europe Market Value (US$ Million) Analysis by Configuration, 2019 to 2034

Figure 139: Eastern Europe Market Volume (Units) Analysis by Configuration, 2019 to 2034

Figure 140: Eastern Europe Market Value Share (%) and BPS Analysis by Configuration, 2024 to 2034

Figure 141: Eastern Europe Market Y-o-Y Growth (%) Projections by Configuration, 2024 to 2034

Figure 142: Eastern Europe Market Value (US$ Million) Analysis by End Use Industry, 2019 to 2034

Figure 143: Eastern Europe Market Volume (Units) Analysis by End Use Industry, 2019 to 2034

Figure 144: Eastern Europe Market Value Share (%) and BPS Analysis by End Use Industry, 2024 to 2034

Figure 145: Eastern Europe Market Y-o-Y Growth (%) Projections by End Use Industry, 2024 to 2034

Figure 146: Eastern Europe Market Attractiveness by Product Type, 2024 to 2034

Figure 147: Eastern Europe Market Attractiveness by Hardware Design, 2024 to 2034

Figure 148: Eastern Europe Market Attractiveness by Configuration, 2024 to 2034

Figure 149: Eastern Europe Market Attractiveness by End Use Industry, 2024 to 2034

Figure 150: Eastern Europe Market Attractiveness by Country, 2024 to 2034

Figure 151: South Asia and Pacific Market Value (US$ Million) by Product Type, 2024 to 2034

Figure 152: South Asia and Pacific Market Value (US$ Million) by Hardware Design, 2024 to 2034

Figure 153: South Asia and Pacific Market Value (US$ Million) by Configuration, 2024 to 2034

Figure 154: South Asia and Pacific Market Value (US$ Million) by End Use Industry, 2024 to 2034

Figure 155: South Asia and Pacific Market Value (US$ Million) by Country, 2024 to 2034

Figure 156: South Asia and Pacific Market Value (US$ Million) Analysis by Country, 2019 to 2034

Figure 157: South Asia and Pacific Market Volume (Units) Analysis by Country, 2019 to 2034

Figure 158: South Asia and Pacific Market Value Share (%) and BPS Analysis by Country, 2024 to 2034

Figure 159: South Asia and Pacific Market Y-o-Y Growth (%) Projections by Country, 2024 to 2034

Figure 160: South Asia and Pacific Market Value (US$ Million) Analysis by Product Type, 2019 to 2034

Figure 161: South Asia and Pacific Market Volume (Units) Analysis by Product Type, 2019 to 2034

Figure 162: South Asia and Pacific Market Value Share (%) and BPS Analysis by Product Type, 2024 to 2034

Figure 163: South Asia and Pacific Market Y-o-Y Growth (%) Projections by Product Type, 2024 to 2034

Figure 164: South Asia and Pacific Market Value (US$ Million) Analysis by Hardware Design, 2019 to 2034

Figure 165: South Asia and Pacific Market Volume (Units) Analysis by Hardware Design, 2019 to 2034

Figure 166: South Asia and Pacific Market Value Share (%) and BPS Analysis by Hardware Design, 2024 to 2034

Figure 167: South Asia and Pacific Market Y-o-Y Growth (%) Projections by Hardware Design, 2024 to 2034

Figure 168: South Asia and Pacific Market Value (US$ Million) Analysis by Configuration, 2019 to 2034

Figure 169: South Asia and Pacific Market Volume (Units) Analysis by Configuration, 2019 to 2034

Figure 170: South Asia and Pacific Market Value Share (%) and BPS Analysis by Configuration, 2024 to 2034

Figure 171: South Asia and Pacific Market Y-o-Y Growth (%) Projections by Configuration, 2024 to 2034

Figure 172: South Asia and Pacific Market Value (US$ Million) Analysis by End Use Industry, 2019 to 2034

Figure 173: South Asia and Pacific Market Volume (Units) Analysis by End Use Industry, 2019 to 2034

Figure 174: South Asia and Pacific Market Value Share (%) and BPS Analysis by End Use Industry, 2024 to 2034

Figure 175: South Asia and Pacific Market Y-o-Y Growth (%) Projections by End Use Industry, 2024 to 2034

Figure 176: South Asia and Pacific Market Attractiveness by Product Type, 2024 to 2034

Figure 177: South Asia and Pacific Market Attractiveness by Hardware Design, 2024 to 2034

Figure 178: South Asia and Pacific Market Attractiveness by Configuration, 2024 to 2034

Figure 179: South Asia and Pacific Market Attractiveness by End Use Industry, 2024 to 2034

Figure 180: South Asia and Pacific Market Attractiveness by Country, 2024 to 2034

Figure 181: East Asia Market Value (US$ Million) by Product Type, 2024 to 2034

Figure 182: East Asia Market Value (US$ Million) by Hardware Design, 2024 to 2034

Figure 183: East Asia Market Value (US$ Million) by Configuration, 2024 to 2034

Figure 184: East Asia Market Value (US$ Million) by End Use Industry, 2024 to 2034

Figure 185: East Asia Market Value (US$ Million) by Country, 2024 to 2034

Figure 186: East Asia Market Value (US$ Million) Analysis by Country, 2019 to 2034

Figure 187: East Asia Market Volume (Units) Analysis by Country, 2019 to 2034

Figure 188: East Asia Market Value Share (%) and BPS Analysis by Country, 2024 to 2034

Figure 189: East Asia Market Y-o-Y Growth (%) Projections by Country, 2024 to 2034

Figure 190: East Asia Market Value (US$ Million) Analysis by Product Type, 2019 to 2034

Figure 191: East Asia Market Volume (Units) Analysis by Product Type, 2019 to 2034

Figure 192: East Asia Market Value Share (%) and BPS Analysis by Product Type, 2024 to 2034

Figure 193: East Asia Market Y-o-Y Growth (%) Projections by Product Type, 2024 to 2034

Figure 194: East Asia Market Value (US$ Million) Analysis by Hardware Design, 2019 to 2034

Figure 195: East Asia Market Volume (Units) Analysis by Hardware Design, 2019 to 2034

Figure 196: East Asia Market Value Share (%) and BPS Analysis by Hardware Design, 2024 to 2034

Figure 197: East Asia Market Y-o-Y Growth (%) Projections by Hardware Design, 2024 to 2034

Figure 198: East Asia Market Value (US$ Million) Analysis by Configuration, 2019 to 2034

Figure 199: East Asia Market Volume (Units) Analysis by Configuration, 2019 to 2034

Figure 200: East Asia Market Value Share (%) and BPS Analysis by Configuration, 2024 to 2034

Figure 201: East Asia Market Y-o-Y Growth (%) Projections by Configuration, 2024 to 2034

Figure 202: East Asia Market Value (US$ Million) Analysis by End Use Industry, 2019 to 2034

Figure 203: East Asia Market Volume (Units) Analysis by End Use Industry, 2019 to 2034

Figure 204: East Asia Market Value Share (%) and BPS Analysis by End Use Industry, 2024 to 2034

Figure 205: East Asia Market Y-o-Y Growth (%) Projections by End Use Industry, 2024 to 2034

Figure 206: East Asia Market Attractiveness by Product Type, 2024 to 2034

Figure 207: East Asia Market Attractiveness by Hardware Design, 2024 to 2034

Figure 208: East Asia Market Attractiveness by Configuration, 2024 to 2034

Figure 209: East Asia Market Attractiveness by End Use Industry, 2024 to 2034

Figure 210: East Asia Market Attractiveness by Country, 2024 to 2034

Figure 211: Middle East and Africa Market Value (US$ Million) by Product Type, 2024 to 2034

Figure 212: Middle East and Africa Market Value (US$ Million) by Hardware Design, 2024 to 2034

Figure 213: Middle East and Africa Market Value (US$ Million) by Configuration, 2024 to 2034

Figure 214: Middle East and Africa Market Value (US$ Million) by End Use Industry, 2024 to 2034

Figure 215: Middle East and Africa Market Value (US$ Million) by Country, 2024 to 2034

Figure 216: Middle East and Africa Market Value (US$ Million) Analysis by Country, 2019 to 2034

Figure 217: Middle East and Africa Market Volume (Units) Analysis by Country, 2019 to 2034

Figure 218: Middle East and Africa Market Value Share (%) and BPS Analysis by Country, 2024 to 2034

Figure 219: Middle East and Africa Market Y-o-Y Growth (%) Projections by Country, 2024 to 2034

Figure 220: Middle East and Africa Market Value (US$ Million) Analysis by Product Type, 2019 to 2034

Figure 221: Middle East and Africa Market Volume (Units) Analysis by Product Type, 2019 to 2034

Figure 222: Middle East and Africa Market Value Share (%) and BPS Analysis by Product Type, 2024 to 2034

Figure 223: Middle East and Africa Market Y-o-Y Growth (%) Projections by Product Type, 2024 to 2034

Figure 224: Middle East and Africa Market Value (US$ Million) Analysis by Hardware Design, 2019 to 2034

Figure 225: Middle East and Africa Market Volume (Units) Analysis by Hardware Design, 2019 to 2034

Figure 226: Middle East and Africa Market Value Share (%) and BPS Analysis by Hardware Design, 2024 to 2034

Figure 227: Middle East and Africa Market Y-o-Y Growth (%) Projections by Hardware Design, 2024 to 2034

Figure 228: Middle East and Africa Market Value (US$ Million) Analysis by Configuration, 2019 to 2034

Figure 229: Middle East and Africa Market Volume (Units) Analysis by Configuration, 2019 to 2034

Figure 230: Middle East and Africa Market Value Share (%) and BPS Analysis by Configuration, 2024 to 2034

Figure 231: Middle East and Africa Market Y-o-Y Growth (%) Projections by Configuration, 2024 to 2034

Figure 232: Middle East and Africa Market Value (US$ Million) Analysis by End Use Industry, 2019 to 2034

Figure 233: Middle East and Africa Market Volume (Units) Analysis by End Use Industry, 2019 to 2034

Figure 234: Middle East and Africa Market Value Share (%) and BPS Analysis by End Use Industry, 2024 to 2034

Figure 235: Middle East and Africa Market Y-o-Y Growth (%) Projections by End Use Industry, 2024 to 2034

Figure 236: Middle East and Africa Market Attractiveness by Product Type, 2024 to 2034

Figure 237: Middle East and Africa Market Attractiveness by Hardware Design, 2024 to 2034

Figure 238: Middle East and Africa Market Attractiveness by Configuration, 2024 to 2034

Figure 239: Middle East and Africa Market Attractiveness by End Use Industry, 2024 to 2034

Figure 240: Middle East and Africa Market Attractiveness by Country, 2024 to 2034

Frequently Asked Questions

How Big is the Modular Robotic Market?

The market size for modular robotic is forecasted to be worth USD 12.69 billion in 2024.

What is the Demand Forecast for Modular Robotic?

The modular robotic market value is projected to surpass USD 66.42 billion by 2034.

What is the Projected CAGR for the Modular Robotic Market?

The CAGR of the modular robotic industry is estimated to be around 18.0% through 2034.

What is the Key Market Trend in Modular Robotic?

Customization of modular robotic systems surges in demand.

Which Countries Drive the Sales of Modular Robotics?

China and Japan are key consumers of modular robotics as of 2024.

Which is the Leading Brand of Modular Robotic?

ABB Ltd. and Acutronic Robotics are modular robotic industry leaders.

Explore Similar Insights

Future Market Insights

Modular Robotic Market