Robotic Biopsy Devices Market Size and Share Forecast Outlook 2025 to 2035

The global Robotic Biopsy Devices Market is estimated to be valued at USD 79.02 million in 2025 and is projected to reach USD 181.9 million by 2035, registering a compound annual growth rate of 8.7% over the forecast period.

Quick Stats for Robotic Biopsy Devices Market

  • Industry Value (2025): USD 79.02 million
  • Forecast Value (2035): USD 181.9 million
  • Forecast CAGR: 8.7%
  • Leading Segment in 2025: Robotic Biopsy Systems
  • Key Growth Region: North America and Europe
  • Top Key Players: Medtronic, Renishaw plc, iSYS Medizintechnik GmbH, Mazor Robotics, Biobot Surgical Pte Ltd, Medrobotics, Medtech SA.
Metric Value
Market Size in 2025 USD 79.02 Million
Projected Market Size in 2035 USD 181.9 million
CAGR (2025 to 2035) 8.7%

The Robotic Biopsy Devices Market is undergoing transformational growth, driven by rising demand for minimally invasive diagnostics and advancements in robotic precision technologies. Increased incidence of cancers and chronic conditions is pushing healthcare systems to adopt highly accurate biopsy solutions.

Companies are prioritizing compact, outpatient-friendly robotic systems to improve accessibility and procedural efficiency. Strategic partnerships and R&D investments are accelerating clinical validation and product innovation. Despite hurdles such as high costs and complex deployment in low-resource settings, the market is gaining traction across developed and emerging regions.

North America remains a leader due to early technology adoption, while Asia Pacific shows strong momentum with rising healthcare investments and disease burden. Future growth is anchored in technology refinement and broader clinical integration.

Analyzing Robotic Biopsy Devices Market by Top Investment Segments

Robotic Biopsy Systems Lead Due to Integration of Advanced Imaging and Navigation Technologies

Robotic Biopsy Systems is projected to account for 55.0% of revenue in 2025, owing to its integration of real-time imaging, robotic precision, and AI-assisted navigation. This segment has been favored by hospitals and specialty centers where high procedural accuracy and reduced patient trauma are critical.

Strong clinical validation and regulatory approvals have further positioned robotic systems as indispensable in diagnostic workflows. Growth has been underpinned by a rising shift toward minimally invasive procedures and the increasing focus on oncology diagnostics, where robotic platforms significantly improve biopsy precision.

Technological convergence in robotics and imaging has also enabled scalable deployment across multiple specialties. Additionally, manufacturers have prioritized platform standardization, enabling multi-organ use with interchangeable tools. Market penetration has been supported by favorable physician feedback, workflow optimization, and improved patient outcomes. As procedural reproducibility and standardization gain importance in clinical settings, robotic biopsy systems are being increasingly adopted as a frontline diagnostic tool.

Lung Biopsy Dominates Owing to Rising Incidence of Lung Cancer and Demand for Early Diagnosis

Lung biopsy is expected to contribute 35.4% of the market share in 2025, driven by the growing incidence of pulmonary malignancies and the rising demand for early detection. The segment has gained clinical preference due to the complexity of accessing peripheral lung nodules, which is addressed efficiently through robotic guidance systems.

Minimally invasive access to hard-to-reach lung regions has been facilitated by robotic-assisted bronchoscopy and CT-guided navigation technologies. Increasing awareness of low-dose CT screening programs and high false-positive rates have necessitated precise, targeted biopsies further fueling demand for robotic lung interventions.

Enhanced safety profiles and reduced complication rates have encouraged adoption in both high-volume hospitals and research-driven facilities. The segment has also benefited from growing clinical evidence supporting the accuracy of robotic systems in lung tissue sampling. With the rising burden of lung cancer, particularly in aging populations and smokers, this segment is expected to maintain a dominant position through 2030.
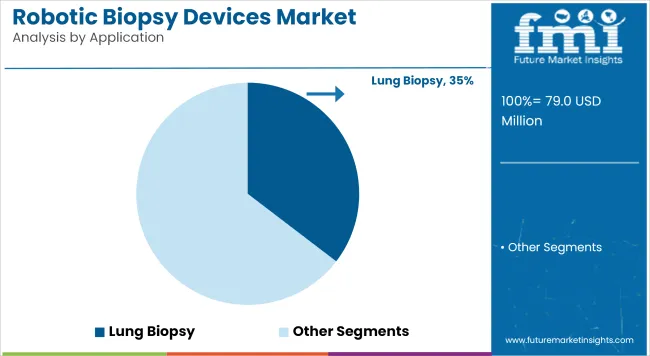
Robotic Biopsy Devices Market Analysis By Application

Hospitals Lead the Market Due to High Adoption of Capital-Intensive Robotic Platforms

Hospitals are projected to account for 50.8% of the revenue share in 2025, as this end user segment has been the primary adopter of high-investment robotic biopsy systems. Favorable infrastructure, dedicated surgical teams, and comprehensive diagnostic capabilities have enabled hospitals to integrate these systems seamlessly into their clinical operations.

Centralized purchasing power and access to capital budgets have allowed hospitals to implement robotic solutions at scale. Demand has also been driven by the rising number of complex biopsy procedures being conducted in tertiary and quaternary care hospitals.

Clinical protocols increasingly emphasize minimally invasive approaches, and robotic systems have been positioned as essential for enhancing diagnostic yield. As hospitals continue to prioritize operational efficiency and patient outcomes, robotic biopsy devices are being embedded into standard diagnostic pathways, ensuring this segment remains the largest contributor to market.
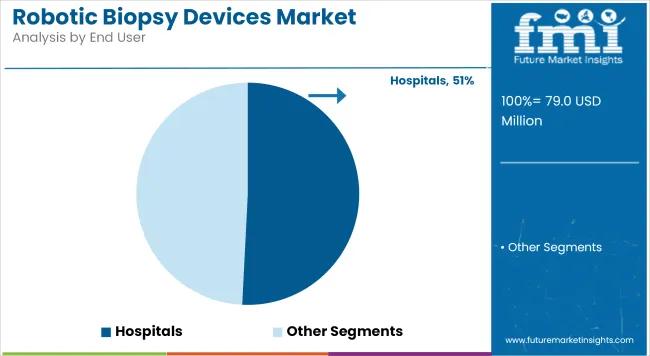
Robotic Biopsy Devices Market Analysis By End User

Challenges and Opportunities

Challenges

High Capital Costs, Training Barriers, and Regulatory Complexity

High acquisition and maintenance costs are the major restraints in the robotic biopsy devices market as they do not build up business case for small and mid-sized hospitals or diagnostic centers to adopt these systems. Surgical scalability is also hampered by the requirement for highly trained radiologists and surgeons to operate robotic systems, particularly in rural or resource-constrained settings.

Opportunities

Precision Medicine, AI Integration, and Minimally Invasive Oncology Demand

The market is gaining robust traction due to the worldwide movement towards early cancer diagnosis, minimally-invasive surgery, and precision-guided diagnostics-contributing even in the face of challenges Through targeted biopsy methods, robotic biopsy devices increase the chances of obtaining adequate tissue samples under less trauma as well as improving the diagnostic yield-none more so than for deep-seated tumors (lung, prostate, liver, brain, etc.).
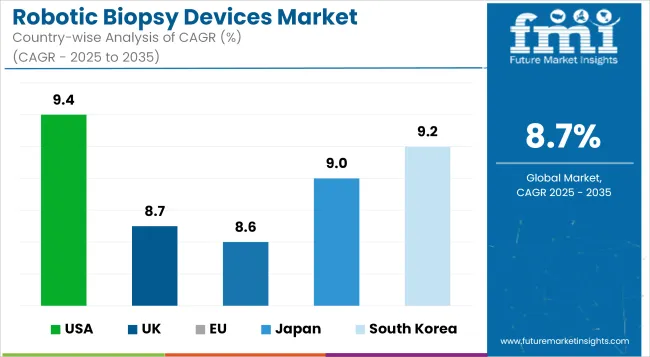
Country-wise Outlook

Robotic Biopsy Devices Market Country Wise Analysis

United States

The Robotic Biopsy Devices market in the United States is escalating massively on account of early acceptance of robotic-aided surgical system, increasing cancer diagnostics and AI-guided imaging for accurate biopsy.

Savvy parts of the behemoth USA medical ecosystem have started investing in robotic biopsy systems for breast, prostate, lung and liver cancer, with the goal of making the procedures more accurate and less invasive. Advances in FDA clearances and reimbursement policies contribute to replacing manual systems with robotic systems.

Country CAGR (2025 to 2035)
USA 9.4%

United Kingdom

The UK Robotic Biopsy Devices market is on a stable growth track due to healthcare investments by NHS in robotic surgeries and diagnostic innovations. Robotic-assisted platforms are being used in laparoscopic-assisted thoracoscopic surgery or minimally invasive cancer biopsies, notably in urology and thoracic oncology in application.

There is growing collaboration between government, academic institutions, and med-tech companies, accelerating the development and clinical validation of robotic biopsy solutions.

Country CAGR (2025 to 2035)
UK 8.7%

European Union

The EU Robotic Biopsy Devices market is predicted to grow sharply in Germany, France, and the Netherlands where healthcare services are more advanced. The demand for precision diagnostics and personalized medicine, as well as the rise in the early detection of cancer, are also driving the adoption in oncology centers.

These factors, alongside an increase in med-tech R&D initiatives by the EU, the availability of CE-marked robotic platforms as well as AI-enabled navigation tools, are boosting the market. Hospitals are prioritizing procedures that have fewer complications and shorter recovery.

Country CAGR (2025 to 2035)
EU 8.6%

Japan

The robotic biopsy devices market in Japan is on a consistent upward trajectory owing to its highly advanced robotics ecosystem and an aging population that necessitates early cancer diagnosis. Japanese hospitals are increasingly adopting robotic biopsy equipment in such specializations as gastroenterology, pulmonology, and neurosurgery to manage the diagnostic yield.

The market is benefitting from national policies favoring the adoption of minimally invasive technologies, as well as advances in miniaturized robotic arms, and integration with real-time imaging.

Country CAGR (2025 to 2035)
Japan 9.0%

South Korea

The South Korean robotic biopsy devices market is growing rapidly owing to strong med-tech manufacturing industry, government investments in smart healthcare and the expansion of the private hospital network.

Robotic precision reduces tissue injury and enhances sample quality in areas with high demand for thoracic, hepatic, and breast cancer diagnosis. Adoption and innovation are powered by university-industry collaborations with international device companies.

Country CAGR (2025 to 2035)
South Korea 9.2%

Competitive Outlook

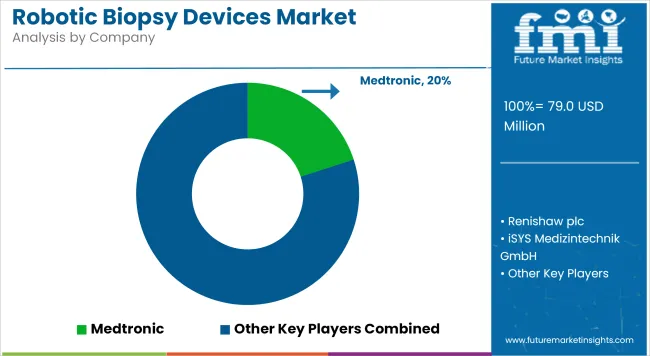
Robotic Biopsy Devices Market Analysis By Company

The robotic biopsy devices market is witnessing intensifying competition driven by rapid innovation and technological convergence. Companies are focusing on improving device precision, real-time imaging integration and AI-enabled targeting to enhance diagnostic outcomes. There is a strong shift toward developing compact, portable systems suitable for outpatient settings, which is expanding accessibility.

Players are also strengthening their clinical trial pipelines and pursuing regulatory approvals to diversify indications and market reach. Strategic collaborations with research institutions and licensing deals are accelerating innovation and product validation.

Additionally, competition is being influenced by surgical robotics firms entering the diagnostic biopsy space, leading to new standards in minimally invasive care. This dynamic ecosystem is fostering rapid technological advancement and adoption across healthcare settings.

Key Development

  • In 2025, Noah Medical's Galaxy System, a robotic-assisted bronchoscopy platform, has surpassed 5,000 procedures in the USA This milestone highlights the rapid adoption of its image-guided technology, which includes integrated tomosynthesis (TiLT+™ Technology) and augmented fluoroscopy, and a disposable bronchoscope. The system aims to improve early lung cancer detection by offering unparalleled precision and navigation to small, peripheral lesions, transforming patient care and diagnostic workflows.
  • In 2025, Johnson & Johnson MedTech has secured USA FDA 510(k) clearance for MONARCH QUEST, an AI-powered upgrade to its MONARCH robotic bronchoscopy platform that integrates with GE HealthCare's OEC 3D mobile CBCT Imaging System to enhance precision and expedite early lung cancer diagnosis.

Companies

  • Medtronic
  • Renishaw plc
  • iSYS Medizintechnik GmbH
  • Mazor Robotics
  • Biobot Surgical Pte Ltd
  • Medrobotics
  • Medtech SA

Top Segments Studied in the Robotic Biopsy Devices Market Research Report

By Product:

  • Systems
  • Instrument & Accessories

By Application:

  • Brain Biopsy
  • Lung Biopsy
  • Prostate Biopsy
  • Others

By End User:

  • Hospitals
  • Ambulatory Surgical Centers
  • Academic & Research Institutes

By Region:

  • North America
  • Latin America
  • East Asia
  • South Asia & Pacific
  • Eastern Europe
  • Western Europe
  • Middle East & Africa

Table of Content

  1. Executive Summary
  2. Industry Introduction, including Taxonomy and Market Definition
  3. Market Trends and Success Factors, including Macro-economic Factors, Market Dynamics, and Recent Industry Developments
  4. Global Market Demand Analysis 2020 to 2024 and Forecast 2025 to 2035, including Historical Analysis and Future Projections
  5. Global Market Analysis 2020 to 2024 and Forecast 2025 to 2035
    • Product
    • Application
    • End User
  6. Global Market Analysis 2020 to 2024 and Forecast 2025 to 2035, By Product
    • Systems
    • Instrument & Accessories
  7. Global Market Analysis 2020 to 2024 and Forecast 2025 to 2035, By Application
    • Brain Biopsy
    • Lung Biopsy
    • Prostate biopsy
    • Others
  8. Global Market Analysis 2020 to 2024 and Forecast 2025 to 2035, By End User
    • Hospitals
    • Ambulatory Surgical Centers
    • Academic & Research Institutes
  9. Global Market Analysis 2020 to 2024 and Forecast 2025 to 2035, By Region
    • North America
    • Latin America
    • East Asia
    • South Asia & Pacific
    • Eastern Europe
    • Western Europe
    • Middle East & Africa
  10. North America Sales Analysis 2020 to 2024 and Forecast 2025 to 2035, by Key Segments and Countries
  11. Latin America Sales Analysis 2020 to 2024 and Forecast 2025 to 2035, by Key Segments and Countries
  12. East Asia Sales Analysis 2020 to 2024 and Forecast 2025 to 2035, by Key Segments and Countries
  13. South Asia & Pacific Sales Analysis 2020 to 2024 and Forecast 2025 to 2035, by Key Segments and Countries
  14. Eastern Europe Sales Analysis 2020 to 2024 and Forecast 2025 to 2035, by Key Segments and Countries
  15. Western Europe Sales Analysis 2020 to 2024 and Forecast 2025 to 2035, by Key Segments and Countries
  16. Middle East & Africa Sales Analysis 2020 to 2024 and Forecast 2025 to 2035, by Key Segments and Countries
  17. Sales Forecast 2025 to 2035 by Product, Application, and End User for 30 Countries
  18. Competition Outlook, including Market Structure Analysis, Company Share Analysis by Key Players, and Competition Dashboard
  19. Company Profile
    • Medtronic
    • Renishaw plc
    • iSYS Medizintechnik GmbH
    • Mazor Robotics
    • Biobot Surgical Pte Ltd
    • Medrobotics
    • Medtech SA
    • Accuray Inc.
    • Auris Health, Inc.
    • Hologic, Inc.

List of Tables

  • Table 1: Global Market Value (USD Million) Forecast by Region, 2020 to 2035
  • Table 2: Global Market Volume (Units) Forecast by Region, 2020 to 2035
  • Table 3: Global Market Value (USD Million) Forecast by Product, 2020 to 2035
  • Table 4: Global Market Volume (Units) Forecast by Product, 2020 to 2035
  • Table 5: Global Market Value (USD Million) Forecast by Application, 2020 to 2035
  • Table 6: Global Market Volume (Units) Forecast by Application, 2020 to 2035
  • Table 7: Global Market Value (USD Million) Forecast by End User, 2020 to 2035
  • Table 8: Global Market Volume (Units) Forecast by End User, 2020 to 2035
  • Table 9: North America Market Value (USD Million) Forecast by Country, 2020 to 2035
  • Table 10: North America Market Volume (Units) Forecast by Country, 2020 to 2035
  • Table 11: North America Market Value (USD Million) Forecast by Product, 2020 to 2035
  • Table 12: North America Market Volume (Units) Forecast by Product, 2020 to 2035
  • Table 13: North America Market Value (USD Million) Forecast by Application, 2020 to 2035
  • Table 14: North America Market Volume (Units) Forecast by Application, 2020 to 2035
  • Table 15: North America Market Value (USD Million) Forecast by End User, 2020 to 2035
  • Table 16: North America Market Volume (Units) Forecast by End User, 2020 to 2035
  • Table 17: Latin America Market Value (USD Million) Forecast by Country, 2020 to 2035
  • Table 18: Latin America Market Volume (Units) Forecast by Country, 2020 to 2035
  • Table 19: Latin America Market Value (USD Million) Forecast by Product, 2020 to 2035
  • Table 20: Latin America Market Volume (Units) Forecast by Product, 2020 to 2035
  • Table 21: Latin America Market Value (USD Million) Forecast by Application, 2020 to 2035
  • Table 22: Latin America Market Volume (Units) Forecast by Application, 2020 to 2035
  • Table 23: Latin America Market Value (USD Million) Forecast by End User, 2020 to 2035
  • Table 24: Latin America Market Volume (Units) Forecast by End User, 2020 to 2035
  • Table 25: Western Europe Market Value (USD Million) Forecast by Country, 2020 to 2035
  • Table 26: Western Europe Market Volume (Units) Forecast by Country, 2020 to 2035
  • Table 27: Western Europe Market Value (USD Million) Forecast by Product, 2020 to 2035
  • Table 28: Western Europe Market Volume (Units) Forecast by Product, 2020 to 2035
  • Table 29: Western Europe Market Value (USD Million) Forecast by Application, 2020 to 2035
  • Table 30: Western Europe Market Volume (Units) Forecast by Application, 2020 to 2035
  • Table 31: Western Europe Market Value (USD Million) Forecast by End User, 2020 to 2035
  • Table 32: Western Europe Market Volume (Units) Forecast by End User, 2020 to 2035
  • Table 33: Eastern Europe Market Value (USD Million) Forecast by Country, 2020 to 2035
  • Table 34: Eastern Europe Market Volume (Units) Forecast by Country, 2020 to 2035
  • Table 35: Eastern Europe Market Value (USD Million) Forecast by Product, 2020 to 2035
  • Table 36: Eastern Europe Market Volume (Units) Forecast by Product, 2020 to 2035
  • Table 37: Eastern Europe Market Value (USD Million) Forecast by Application, 2020 to 2035
  • Table 38: Eastern Europe Market Volume (Units) Forecast by Application, 2020 to 2035
  • Table 39: Eastern Europe Market Value (USD Million) Forecast by End User, 2020 to 2035
  • Table 40: Eastern Europe Market Volume (Units) Forecast by End User, 2020 to 2035
  • Table 41: South Asia and Pacific Market Value (USD Million) Forecast by Country, 2020 to 2035
  • Table 42: South Asia and Pacific Market Volume (Units) Forecast by Country, 2020 to 2035
  • Table 43: South Asia and Pacific Market Value (USD Million) Forecast by Product, 2020 to 2035
  • Table 44: South Asia and Pacific Market Volume (Units) Forecast by Product, 2020 to 2035
  • Table 45: South Asia and Pacific Market Value (USD Million) Forecast by Application, 2020 to 2035
  • Table 46: South Asia and Pacific Market Volume (Units) Forecast by Application, 2020 to 2035
  • Table 47: South Asia and Pacific Market Value (USD Million) Forecast by End User, 2020 to 2035
  • Table 48: South Asia and Pacific Market Volume (Units) Forecast by End User, 2020 to 2035
  • Table 49: East Asia Market Value (USD Million) Forecast by Country, 2020 to 2035
  • Table 50: East Asia Market Volume (Units) Forecast by Country, 2020 to 2035
  • Table 51: East Asia Market Value (USD Million) Forecast by Product, 2020 to 2035
  • Table 52: East Asia Market Volume (Units) Forecast by Product, 2020 to 2035
  • Table 53: East Asia Market Value (USD Million) Forecast by Application, 2020 to 2035
  • Table 54: East Asia Market Volume (Units) Forecast by Application, 2020 to 2035
  • Table 55: East Asia Market Value (USD Million) Forecast by End User, 2020 to 2035
  • Table 56: East Asia Market Volume (Units) Forecast by End User, 2020 to 2035
  • Table 57: Middle East and Africa Market Value (USD Million) Forecast by Country, 2020 to 2035
  • Table 58: Middle East and Africa Market Volume (Units) Forecast by Country, 2020 to 2035
  • Table 59: Middle East and Africa Market Value (USD Million) Forecast by Product, 2020 to 2035
  • Table 60: Middle East and Africa Market Volume (Units) Forecast by Product, 2020 to 2035
  • Table 61: Middle East and Africa Market Value (USD Million) Forecast by Application, 2020 to 2035
  • Table 62: Middle East and Africa Market Volume (Units) Forecast by Application, 2020 to 2035
  • Table 63: Middle East and Africa Market Value (USD Million) Forecast by End User, 2020 to 2035
  • Table 64: Middle East and Africa Market Volume (Units) Forecast by End User, 2020 to 2035

List of Figures

  • Figure 1: Global Market Value (USD Million) by Product, 2025 to 2035
  • Figure 2: Global Market Value (USD Million) by Application, 2025 to 2035
  • Figure 3: Global Market Value (USD Million) by End User, 2025 to 2035
  • Figure 4: Global Market Value (USD Million) by Region, 2025 to 2035
  • Figure 5: Global Market Value (USD Million) Analysis by Region, 2020 to 2035
  • Figure 6: Global Market Volume (Units) Analysis by Region, 2020 to 2035
  • Figure 7: Global Market Value Share (%) and BPS Analysis by Region, 2025 to 2035
  • Figure 8: Global Market Y-o-Y Growth (%) Projections by Region, 2025 to 2035
  • Figure 9: Global Market Value (USD Million) Analysis by Product, 2020 to 2035
  • Figure 10: Global Market Volume (Units) Analysis by Product, 2020 to 2035
  • Figure 11: Global Market Value Share (%) and BPS Analysis by Product, 2025 to 2035
  • Figure 12: Global Market Y-o-Y Growth (%) Projections by Product, 2025 to 2035
  • Figure 13: Global Market Value (USD Million) Analysis by Application, 2020 to 2035
  • Figure 14: Global Market Volume (Units) Analysis by Application, 2020 to 2035
  • Figure 15: Global Market Value Share (%) and BPS Analysis by Application, 2025 to 2035
  • Figure 16: Global Market Y-o-Y Growth (%) Projections by Application, 2025 to 2035
  • Figure 17: Global Market Value (USD Million) Analysis by End User, 2020 to 2035
  • Figure 18: Global Market Volume (Units) Analysis by End User, 2020 to 2035
  • Figure 19: Global Market Value Share (%) and BPS Analysis by End User, 2025 to 2035
  • Figure 20: Global Market Y-o-Y Growth (%) Projections by End User, 2025 to 2035
  • Figure 21: Global Market Attractiveness by Product, 2025 to 2035
  • Figure 22: Global Market Attractiveness by Application, 2025 to 2035
  • Figure 23: Global Market Attractiveness by End User, 2025 to 2035
  • Figure 24: Global Market Attractiveness by Region, 2025 to 2035
  • Figure 25: North America Market Value (USD Million) by Product, 2025 to 2035
  • Figure 26: North America Market Value (USD Million) by Application, 2025 to 2035
  • Figure 27: North America Market Value (USD Million) by End User, 2025 to 2035
  • Figure 28: North America Market Value (USD Million) by Country, 2025 to 2035
  • Figure 29: North America Market Value (USD Million) Analysis by Country, 2020 to 2035
  • Figure 30: North America Market Volume (Units) Analysis by Country, 2020 to 2035
  • Figure 31: North America Market Value Share (%) and BPS Analysis by Country, 2025 to 2035
  • Figure 32: North America Market Y-o-Y Growth (%) Projections by Country, 2025 to 2035
  • Figure 33: North America Market Value (USD Million) Analysis by Product, 2020 to 2035
  • Figure 34: North America Market Volume (Units) Analysis by Product, 2020 to 2035
  • Figure 35: North America Market Value Share (%) and BPS Analysis by Product, 2025 to 2035
  • Figure 36: North America Market Y-o-Y Growth (%) Projections by Product, 2025 to 2035
  • Figure 37: North America Market Value (USD Million) Analysis by Application, 2020 to 2035
  • Figure 38: North America Market Volume (Units) Analysis by Application, 2020 to 2035
  • Figure 39: North America Market Value Share (%) and BPS Analysis by Application, 2025 to 2035
  • Figure 40: North America Market Y-o-Y Growth (%) Projections by Application, 2025 to 2035
  • Figure 41: North America Market Value (USD Million) Analysis by End User, 2020 to 2035
  • Figure 42: North America Market Volume (Units) Analysis by End User, 2020 to 2035
  • Figure 43: North America Market Value Share (%) and BPS Analysis by End User, 2025 to 2035
  • Figure 44: North America Market Y-o-Y Growth (%) Projections by End User, 2025 to 2035
  • Figure 45: North America Market Attractiveness by Product, 2025 to 2035
  • Figure 46: North America Market Attractiveness by Application, 2025 to 2035
  • Figure 47: North America Market Attractiveness by End User, 2025 to 2035
  • Figure 48: North America Market Attractiveness by Country, 2025 to 2035
  • Figure 49: Latin America Market Value (USD Million) by Product, 2025 to 2035
  • Figure 50: Latin America Market Value (USD Million) by Application, 2025 to 2035
  • Figure 51: Latin America Market Value (USD Million) by End User, 2025 to 2035
  • Figure 52: Latin America Market Value (USD Million) by Country, 2025 to 2035
  • Figure 53: Latin America Market Value (USD Million) Analysis by Country, 2020 to 2035
  • Figure 54: Latin America Market Volume (Units) Analysis by Country, 2020 to 2035
  • Figure 55: Latin America Market Value Share (%) and BPS Analysis by Country, 2025 to 2035
  • Figure 56: Latin America Market Y-o-Y Growth (%) Projections by Country, 2025 to 2035
  • Figure 57: Latin America Market Value (USD Million) Analysis by Product, 2020 to 2035
  • Figure 58: Latin America Market Volume (Units) Analysis by Product, 2020 to 2035
  • Figure 59: Latin America Market Value Share (%) and BPS Analysis by Product, 2025 to 2035
  • Figure 60: Latin America Market Y-o-Y Growth (%) Projections by Product, 2025 to 2035
  • Figure 61: Latin America Market Value (USD Million) Analysis by Application, 2020 to 2035
  • Figure 62: Latin America Market Volume (Units) Analysis by Application, 2020 to 2035
  • Figure 63: Latin America Market Value Share (%) and BPS Analysis by Application, 2025 to 2035
  • Figure 64: Latin America Market Y-o-Y Growth (%) Projections by Application, 2025 to 2035
  • Figure 65: Latin America Market Value (USD Million) Analysis by End User, 2020 to 2035
  • Figure 66: Latin America Market Volume (Units) Analysis by End User, 2020 to 2035
  • Figure 67: Latin America Market Value Share (%) and BPS Analysis by End User, 2025 to 2035
  • Figure 68: Latin America Market Y-o-Y Growth (%) Projections by End User, 2025 to 2035
  • Figure 69: Latin America Market Attractiveness by Product, 2025 to 2035
  • Figure 70: Latin America Market Attractiveness by Application, 2025 to 2035
  • Figure 71: Latin America Market Attractiveness by End User, 2025 to 2035
  • Figure 72: Latin America Market Attractiveness by Country, 2025 to 2035
  • Figure 73: Western Europe Market Value (USD Million) by Product, 2025 to 2035
  • Figure 74: Western Europe Market Value (USD Million) by Application, 2025 to 2035
  • Figure 75: Western Europe Market Value (USD Million) by End User, 2025 to 2035
  • Figure 76: Western Europe Market Value (USD Million) by Country, 2025 to 2035
  • Figure 77: Western Europe Market Value (USD Million) Analysis by Country, 2020 to 2035
  • Figure 78: Western Europe Market Volume (Units) Analysis by Country, 2020 to 2035
  • Figure 79: Western Europe Market Value Share (%) and BPS Analysis by Country, 2025 to 2035
  • Figure 80: Western Europe Market Y-o-Y Growth (%) Projections by Country, 2025 to 2035
  • Figure 81: Western Europe Market Value (USD Million) Analysis by Product, 2020 to 2035
  • Figure 82: Western Europe Market Volume (Units) Analysis by Product, 2020 to 2035
  • Figure 83: Western Europe Market Value Share (%) and BPS Analysis by Product, 2025 to 2035
  • Figure 84: Western Europe Market Y-o-Y Growth (%) Projections by Product, 2025 to 2035
  • Figure 85: Western Europe Market Value (USD Million) Analysis by Application, 2020 to 2035
  • Figure 86: Western Europe Market Volume (Units) Analysis by Application, 2020 to 2035
  • Figure 87: Western Europe Market Value Share (%) and BPS Analysis by Application, 2025 to 2035
  • Figure 88: Western Europe Market Y-o-Y Growth (%) Projections by Application, 2025 to 2035
  • Figure 89: Western Europe Market Value (USD Million) Analysis by End User, 2020 to 2035
  • Figure 90: Western Europe Market Volume (Units) Analysis by End User, 2020 to 2035
  • Figure 91: Western Europe Market Value Share (%) and BPS Analysis by End User, 2025 to 2035
  • Figure 92: Western Europe Market Y-o-Y Growth (%) Projections by End User, 2025 to 2035
  • Figure 93: Western Europe Market Attractiveness by Product, 2025 to 2035
  • Figure 94: Western Europe Market Attractiveness by Application, 2025 to 2035
  • Figure 95: Western Europe Market Attractiveness by End User, 2025 to 2035
  • Figure 96: Western Europe Market Attractiveness by Country, 2025 to 2035
  • Figure 97: Eastern Europe Market Value (USD Million) by Product, 2025 to 2035
  • Figure 98: Eastern Europe Market Value (USD Million) by Application, 2025 to 2035
  • Figure 99: Eastern Europe Market Value (USD Million) by End User, 2025 to 2035
  • Figure 100: Eastern Europe Market Value (USD Million) by Country, 2025 to 2035
  • Figure 101: Eastern Europe Market Value (USD Million) Analysis by Country, 2020 to 2035
  • Figure 102: Eastern Europe Market Volume (Units) Analysis by Country, 2020 to 2035
  • Figure 103: Eastern Europe Market Value Share (%) and BPS Analysis by Country, 2025 to 2035
  • Figure 104: Eastern Europe Market Y-o-Y Growth (%) Projections by Country, 2025 to 2035
  • Figure 105: Eastern Europe Market Value (USD Million) Analysis by Product, 2020 to 2035
  • Figure 106: Eastern Europe Market Volume (Units) Analysis by Product, 2020 to 2035
  • Figure 107: Eastern Europe Market Value Share (%) and BPS Analysis by Product, 2025 to 2035
  • Figure 108: Eastern Europe Market Y-o-Y Growth (%) Projections by Product, 2025 to 2035
  • Figure 109: Eastern Europe Market Value (USD Million) Analysis by Application, 2020 to 2035
  • Figure 110: Eastern Europe Market Volume (Units) Analysis by Application, 2020 to 2035
  • Figure 111: Eastern Europe Market Value Share (%) and BPS Analysis by Application, 2025 to 2035
  • Figure 112: Eastern Europe Market Y-o-Y Growth (%) Projections by Application, 2025 to 2035
  • Figure 113: Eastern Europe Market Value (USD Million) Analysis by End User, 2020 to 2035
  • Figure 114: Eastern Europe Market Volume (Units) Analysis by End User, 2020 to 2035
  • Figure 115: Eastern Europe Market Value Share (%) and BPS Analysis by End User, 2025 to 2035
  • Figure 116: Eastern Europe Market Y-o-Y Growth (%) Projections by End User, 2025 to 2035
  • Figure 117: Eastern Europe Market Attractiveness by Product, 2025 to 2035
  • Figure 118: Eastern Europe Market Attractiveness by Application, 2025 to 2035
  • Figure 119: Eastern Europe Market Attractiveness by End User, 2025 to 2035
  • Figure 120: Eastern Europe Market Attractiveness by Country, 2025 to 2035
  • Figure 121: South Asia and Pacific Market Value (USD Million) by Product, 2025 to 2035
  • Figure 122: South Asia and Pacific Market Value (USD Million) by Application, 2025 to 2035
  • Figure 123: South Asia and Pacific Market Value (USD Million) by End User, 2025 to 2035
  • Figure 124: South Asia and Pacific Market Value (USD Million) by Country, 2025 to 2035
  • Figure 125: South Asia and Pacific Market Value (USD Million) Analysis by Country, 2020 to 2035
  • Figure 126: South Asia and Pacific Market Volume (Units) Analysis by Country, 2020 to 2035
  • Figure 127: South Asia and Pacific Market Value Share (%) and BPS Analysis by Country, 2025 to 2035
  • Figure 128: South Asia and Pacific Market Y-o-Y Growth (%) Projections by Country, 2025 to 2035
  • Figure 129: South Asia and Pacific Market Value (USD Million) Analysis by Product, 2020 to 2035
  • Figure 130: South Asia and Pacific Market Volume (Units) Analysis by Product, 2020 to 2035
  • Figure 131: South Asia and Pacific Market Value Share (%) and BPS Analysis by Product, 2025 to 2035
  • Figure 132: South Asia and Pacific Market Y-o-Y Growth (%) Projections by Product, 2025 to 2035
  • Figure 133: South Asia and Pacific Market Value (USD Million) Analysis by Application, 2020 to 2035
  • Figure 134: South Asia and Pacific Market Volume (Units) Analysis by Application, 2020 to 2035
  • Figure 135: South Asia and Pacific Market Value Share (%) and BPS Analysis by Application, 2025 to 2035
  • Figure 136: South Asia and Pacific Market Y-o-Y Growth (%) Projections by Application, 2025 to 2035
  • Figure 137: South Asia and Pacific Market Value (USD Million) Analysis by End User, 2020 to 2035
  • Figure 138: South Asia and Pacific Market Volume (Units) Analysis by End User, 2020 to 2035
  • Figure 139: South Asia and Pacific Market Value Share (%) and BPS Analysis by End User, 2025 to 2035
  • Figure 140: South Asia and Pacific Market Y-o-Y Growth (%) Projections by End User, 2025 to 2035
  • Figure 141: South Asia and Pacific Market Attractiveness by Product, 2025 to 2035
  • Figure 142: South Asia and Pacific Market Attractiveness by Application, 2025 to 2035
  • Figure 143: South Asia and Pacific Market Attractiveness by End User, 2025 to 2035
  • Figure 144: South Asia and Pacific Market Attractiveness by Country, 2025 to 2035
  • Figure 145: East Asia Market Value (USD Million) by Product, 2025 to 2035
  • Figure 146: East Asia Market Value (USD Million) by Application, 2025 to 2035
  • Figure 147: East Asia Market Value (USD Million) by End User, 2025 to 2035
  • Figure 148: East Asia Market Value (USD Million) by Country, 2025 to 2035
  • Figure 149: East Asia Market Value (USD Million) Analysis by Country, 2020 to 2035
  • Figure 150: East Asia Market Volume (Units) Analysis by Country, 2020 to 2035
  • Figure 151: East Asia Market Value Share (%) and BPS Analysis by Country, 2025 to 2035
  • Figure 152: East Asia Market Y-o-Y Growth (%) Projections by Country, 2025 to 2035
  • Figure 153: East Asia Market Value (USD Million) Analysis by Product, 2020 to 2035
  • Figure 154: East Asia Market Volume (Units) Analysis by Product, 2020 to 2035
  • Figure 155: East Asia Market Value Share (%) and BPS Analysis by Product, 2025 to 2035
  • Figure 156: East Asia Market Y-o-Y Growth (%) Projections by Product, 2025 to 2035
  • Figure 157: East Asia Market Value (USD Million) Analysis by Application, 2020 to 2035
  • Figure 158: East Asia Market Volume (Units) Analysis by Application, 2020 to 2035
  • Figure 159: East Asia Market Value Share (%) and BPS Analysis by Application, 2025 to 2035
  • Figure 160: East Asia Market Y-o-Y Growth (%) Projections by Application, 2025 to 2035
  • Figure 161: East Asia Market Value (USD Million) Analysis by End User, 2020 to 2035
  • Figure 162: East Asia Market Volume (Units) Analysis by End User, 2020 to 2035
  • Figure 163: East Asia Market Value Share (%) and BPS Analysis by End User, 2025 to 2035
  • Figure 164: East Asia Market Y-o-Y Growth (%) Projections by End User, 2025 to 2035
  • Figure 165: East Asia Market Attractiveness by Product, 2025 to 2035
  • Figure 166: East Asia Market Attractiveness by Application, 2025 to 2035
  • Figure 167: East Asia Market Attractiveness by End User, 2025 to 2035
  • Figure 168: East Asia Market Attractiveness by Country, 2025 to 2035
  • Figure 169: Middle East and Africa Market Value (USD Million) by Product, 2025 to 2035
  • Figure 170: Middle East and Africa Market Value (USD Million) by Application, 2025 to 2035
  • Figure 171: Middle East and Africa Market Value (USD Million) by End User, 2025 to 2035
  • Figure 172: Middle East and Africa Market Value (USD Million) by Country, 2025 to 2035
  • Figure 173: Middle East and Africa Market Value (USD Million) Analysis by Country, 2020 to 2035
  • Figure 174: Middle East and Africa Market Volume (Units) Analysis by Country, 2020 to 2035
  • Figure 175: Middle East and Africa Market Value Share (%) and BPS Analysis by Country, 2025 to 2035
  • Figure 176: Middle East and Africa Market Y-o-Y Growth (%) Projections by Country, 2025 to 2035
  • Figure 177: Middle East and Africa Market Value (USD Million) Analysis by Product, 2020 to 2035
  • Figure 178: Middle East and Africa Market Volume (Units) Analysis by Product, 2020 to 2035
  • Figure 179: Middle East and Africa Market Value Share (%) and BPS Analysis by Product, 2025 to 2035
  • Figure 180: Middle East and Africa Market Y-o-Y Growth (%) Projections by Product, 2025 to 2035
  • Figure 181: Middle East and Africa Market Value (USD Million) Analysis by Application, 2020 to 2035
  • Figure 182: Middle East and Africa Market Volume (Units) Analysis by Application, 2020 to 2035
  • Figure 183: Middle East and Africa Market Value Share (%) and BPS Analysis by Application, 2025 to 2035
  • Figure 184: Middle East and Africa Market Y-o-Y Growth (%) Projections by Application, 2025 to 2035
  • Figure 185: Middle East and Africa Market Value (USD Million) Analysis by End User, 2020 to 2035
  • Figure 186: Middle East and Africa Market Volume (Units) Analysis by End User, 2020 to 2035
  • Figure 187: Middle East and Africa Market Value Share (%) and BPS Analysis by End User, 2025 to 2035
  • Figure 188: Middle East and Africa Market Y-o-Y Growth (%) Projections by End User, 2025 to 2035
  • Figure 189: Middle East and Africa Market Attractiveness by Product, 2025 to 2035
  • Figure 190: Middle East and Africa Market Attractiveness by Application, 2025 to 2035
  • Figure 191: Middle East and Africa Market Attractiveness by End User, 2025 to 2035
  • Figure 192: Middle East and Africa Market Attractiveness by Country, 2025 to 2035

Frequently Asked Questions

What was the overall size of the robotic biopsy devices market in 2025?

The overall market size for robotic biopsy devices market was USD 79.02 million in 2025.

How big the robotic biopsy devices market is expected in 2035?

The robotic biopsy devices market is expected to reach USD 181.9 million in 2035.

What will drive the demand for robotic biopsy devices market during the forecast period?

Rising number of cancer survivors undergoing radiation therapy, increasing research in anti-fibrotic drugs, and growing demand for effective post-radiation care solutions will drive market growth.

List the top 5 countries contributing in robotic biopsy devices market?

The top 5 countries which drives the development of robotic biopsy devices market are USA, European Union, Japan, South Korea and UK.

Which segment in type is expected to lead robotic biopsy devices market?

Software and services expected to grow to command significant share over the assessment period.

Explore Similar Insights

Future Market Insights

Robotic Biopsy Devices Market