Reports

- Global Locations -

Headquarters

Future Market Insights, Inc.

Christiana Corporate, 200
Continental Drive, Suite 401,
Newark, Delaware - 19713,
United States

T: +1-347-918-3531

Americas

Future Market Insights, Inc.

616 Corporate Way, Suite 2-9018,
Valley Cottage, NY 10989, United States

MEA

Future Market Insights

1602-6 Jumeirah Bay X2 Tower, Plot No: JLT-PH2-X2A,
Jumeirah Lakes Towers, Dubai,
United Arab Emirates

Europe

Future Market Insights

3rd Floor, 207 Regent Street,
W1B 3HH London
United Kingdom

T: + 44 (0) 20 8123 9659

Asia Pacific

Future Market Insights

IndiaLand Global Tech Park, Unit UG-1, Behind Grand HighStreet, Phase 1, Hinjawadi, MH, Pune – 411057, India

Robotic Assisted Endovascular Systems Market Outlook (2023 to 2033)

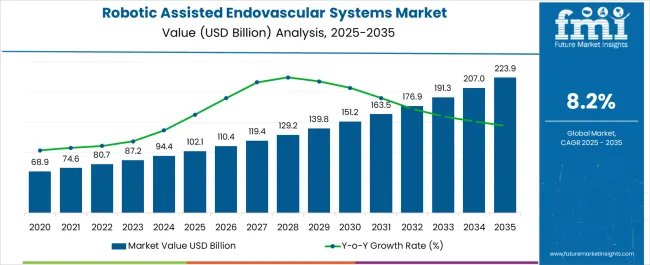
The robotic assisted endovascular systems market size is projected to be worth US$ 94.0 million in 2023. The market is likely to surpass US$ 214.7 million by 2033 at a CAGR of 8.6% during the forecast period. The robotic assisted endovascular systems market refers to the market that involves the use of robotic technology in endovascular procedures. Endovascular procedures are minimally invasive procedures performed inside blood vessels, typically to treat conditions such as cardiovascular diseases, peripheral artery diseases, aneurysms, and other vascular disorders.

Other Drivers Propelling the Demand for Robotic Assisted Endovascular Systems include:

  • There is a higher need for cutting-edge treatment alternatives due to the increasing prevalence of cardiovascular illnesses, peripheral artery diseases, and other vascular disorders.
  • Robotic aided endovascular systems now offer more capabilities due to ongoing advances in robotic technology.
  • More and more surgeons are becoming aware of the possible advantages of adopting robotic systems in endovascular treatments. They are looking for cutting-edge equipment and technology that will boost their efficiency and boost patient outcomes.

Challenges for Companies /Manufacturers in the Robotic Assisted Endovascular Systems Market:

  • Hospitals and healthcare facilities must invest a significant amount of capital in robotic assisted endovascular systems. The robotic system's initial purchase price as well as continuing maintenance and servicing costs may be high.
  • Although there may still be some restrictions on coverage and payment rates for robotic assisted endovascular systems, reimbursement regulations for robotic operations have changed. Hospitals and doctors may experience financial difficulties as a result, which could hinder the adoption and use of these technologies.
  • Robotic aided endovascular systems need specialized knowledge and skills to function well. The use of the robotic systems requires intensive training for surgeons and medical personnel.
  • This cutting-edge robotic technology has significant drawbacks. To begin with, bigger operating rooms are needed to fit the entire system. Additionally, there is a need for staff training and no haptic sensors. Even while robotic surgeons may up for it by becoming more receptive to visual cues, the lack of haptic input may nevertheless lengthen operations, raise the learning curve, and possibly even damage tissue

Opportunities in the Robotic Assisted Endovascular Systems Industry:

  • Emerging markets offer a substantial possibility for the adoption of robotic assisted endovascular systems. The need for cutting-edge medical technologies is anticipated to surge in these areas as healthcare infrastructure develops and disposable incomes increase. Increasing market share and forming alliances in developing nations might create new business opportunities.
  • Robotic systems' ongoing technological development provides potential for innovation and distinctiveness. Market expansion may be facilitated by continued development of robotic platforms with increased imaging capabilities, miniature equipment, improved automation, and integration of artificial intelligence.

Latest Trends in the Robotic Assisted Endovascular Systems Market:

  • The adoption of robotic assisted endovascular systems is steadily increasing. Healthcare providers are recognizing the benefits of these systems, such as improved precision, stability, and dexterity, leading to better patient outcomes.
  • Artificial intelligence is being integrated into robotic systems, enabling advanced image processing, real-time decision-making, and autonomous actions. AI algorithms can assist in tasks such as image segmentation, lesion detection, and treatment planning.
  • There is a growing trend toward miniaturization of robotic systems and instruments used in endovascular procedures. Miniaturized robotic platforms allow for access to smaller vessels and more delicate anatomical structures.
Attributes Details
Robotic Assisted Endovascular Systems Market Size (2023) US$ 94.0 million
Robotic Assisted Endovascular Systems Market Projected Size (2033) US$ 214.7 million
Value CAGR (2023 to 2033) 8.6%

Don't pay for what you don't need

Customize your report by selecting specific countries or regions and save 30%!

2017 to 2022 Robotic Assisted Endovascular Systems Demand Outlook Compared to 2023 to 2033 Forecast

From 2017 to 2022, the global robotic assisted endovascular systems market experienced a CAGR of 6.5%, reaching a market size of US$ 94.0 million in 2023.

From 2017 to 2022, robotic technology began to make its way into the field of endovascular interventions. The first generation of Robotic Assisted Endovascular Systems was introduced, offering improved precision and control during procedures. These early systems primarily focused on cardiovascular interventions, such as percutaneous coronary interventions (PCI) and transcatheter aortic valve replacement (TAVR).

As the technology advanced, more sophisticated robotic systems entered the market, incorporating features such as enhanced imaging capabilities, better ergonomics, and increased automation. The market expanded beyond cardiovascular procedures to include peripheral vascular interventions, such as treating peripheral artery disease (PAD) and performing endovascular aneurysm repair (EVAR).

Future Forecast for Robotic Assisted Endovascular Systems Industry:

Looking ahead, the global robotic assisted endovascular systems industry is expected to rise at a CAGR of 8.6% from 2023 to 2033. During the forecast period, the market size is expected to reach US$ 214.7 million by 2033.

The robotic assisted endovascular systems industry is expected to continue its growth trajectory from 2023 to 2033, driven by increasing adoption of advanced robotic assisted endovascular systems that offers higher efficiency and precision during endovascular procedures. Also, the growing demand for innovative, minimally invasive surgical procedures which reduce patient trauma and recovery time will drive the market’s growth.
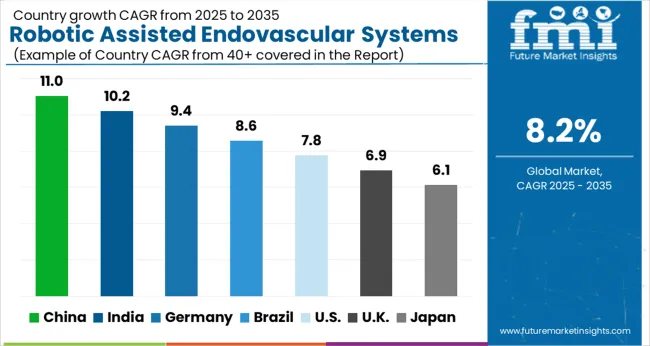
Comparative View of the Robotic Assisted Endovascular Systems Market

Robotic Assisted Endovascular Systems Market:

Attributes Robotic Assisted Endovascular Systems Market
CAGR (2023 to 2033) 8.6%
Market Value (2033) US$ 214.7 million
Opportunity Patient-centric care is a growing trend in healthcare. Robotic Assisted Endovascular Systems can contribute to this approach by offering improved patient outcomes, reduced complications, shorter hospital stays, and faster recovery times. Emphasizing the patient benefits and providing personalized, minimally invasive treatment options can create new opportunities for market growth
Key Trends Collaborative robots, or cobots, are designed to work alongside surgeons rather than replace them. These robots can provide assistance during endovascular procedures, offering improved stability and precision while maintaining surgeon control.

Peripheral Vascular Devices Market:

Attributes Peripheral Vascular Devices Market
CAGR (2023 to 2033) 6.7%
Market Value (2033) US$ 9.1 billion
Opportunity Bio absorbable stents have been made using biodegradable polymers. The idea of a bio absorbable material shows promise, however it has not been proven in randomized controlled experiments, and when compared to endarterectomy and PTA, it has not shown enhanced or similar patency.
Key Trends The need for peripheral vascular devices is being driven by the increasing prevalence of PAD, a disorder marked by the narrowing or blockage of blood vessels in the peripheral arteries. The rising incidence of risk factors including diabetes and obesity as well as the ageing population and sedentary lifestyle all contribute to the rising burden of PAD.

Transcatheter aortic valve replacement (TAVR) Market:

Attributes Transcatheter aortic valve replacement (TAVR) Market
CAGR (2023 to 2033) 14.8%
Market Value (2033) US$ 25.4 billion
Opportunity Due to commercial opportunities being established by market participants as a result of the quick pace of clinical research in TAVR technologies, many heart patients will benefit from TAVR as a treatment for heart valve dysfunction.
Key Trends TAVR has gained significant traction as a minimally invasive alternative to surgical aortic valve replacement (SAVR) for patients with severe aortic stenosis. The adoption of TAVR is increasing due to its benefits, such as shorter hospital stays, faster recovery times, and reduced procedural risks compared to open-heart surgery.
Sabyasachi Ghosh
Sabyasachi Ghosh

Principal Consultant

Talk to Analyst

Find your sweet spots for generating winning opportunities in this market.

Country-Wise Insights

Robotic Assisted Endovascular Systems Market to Surge in the United States Due to Rising Cardiovascular Diseases.

Country The United States
Market Size (US$ million) by End of Forecast Period (2033) US$ 135.9 million
CAGR % 2023 to End of Forecast (2033) 9.6%

The robotic assisted endovascular systems industry in the United States is expected to reach a market size of US$ 135.9 million by 2033, expanding at a CAGR of 9.6%. The United States has a significant burden of cardiovascular and peripheral vascular diseases, including conditions such as coronary artery disease, peripheral artery disease, and aortic aneurysms. The rising prevalence of these diseases is driving the demand for advanced technologies like Robotic Assisted Endovascular Systems that can improve procedural outcomes and patient care.

Rising Awareness About Robotic Assisted Endovascular Systems by Healthcare Professional to Propel the United Kingdom Market Growth

Country The United Kingdom
Market Size (US$ million) by End of Forecast Period (2033) US$ 12.0 million
CAGR % 2023 to End of Forecast (2033) 7.9%

The robotic assisted endovascular systems industry in the United Kingdom is expected to reach a market value of US$ 12.0 million, expanding at a CAGR of 7.9% during the forecast period. Surgeons in the UK are increasingly recognizing the benefits of robotic assistance in endovascular procedures. Robotic systems provide enhanced precision, stability, and control, resulting in improved procedural outcomes, reduced complications, and shorter recovery times for patients. Surgeon demand for these advantages is driving the adoption of Robotic Assisted Endovascular Systems.

Notable Growth Expected in China's Robotic Assisted Endovascular Systems Market as Increasing Healthcare Expenditure.

Country China
Market Size (US$ million) by End of Forecast Period (2033) US$ 4.9 million
CAGR % 2023 to End of Forecast (2033) 6.8%

The robotic assisted endovascular systems industry in China is anticipated to reach a market size of US$ 4.9 million, moving at a CAGR of 6.8% during the forecast period. Increasing healthcare expenditure in China and expanding insurance coverage have made advanced medical technologies more accessible to patients. This includes coverage for robotic-assisted procedures, incentivizing healthcare providers to invest in Robotic Assisted Endovascular Systems. The availability of insurance coverage for these procedures is contributing to the market growth in China.
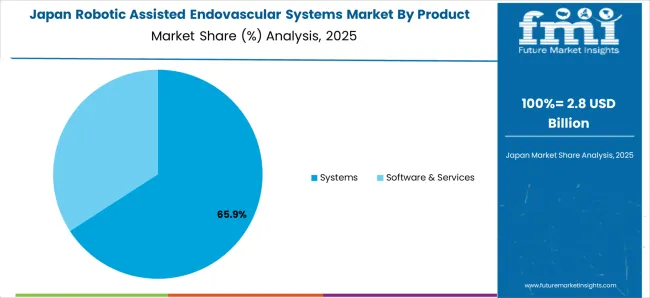
Growing Collaboration to Drive Market Growth in Japan

Country Japan
Market Size (US$ million) by End of Forecast Period (2033) US$ 7.5 million
CAGR % 2023 to End of Forecast (2033) 8.6%

The robotic assisted endovascular systems industry in Japan is estimated to reach a market size of US$ 7.5 million by 2033, thriving at a CAGR of 8.6%. Collaboration between international robotic system manufacturers and Japanese healthcare institutions is playing a significant role in driving the growth of the market. These collaborations focus on technology transfer, research and development, clinical trials, and training programs to promote the adoption and utilization of Robotic Assisted Endovascular Systems in Japan.
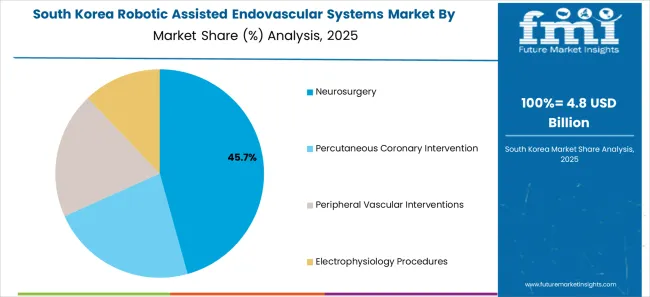
Demand for Robotic Assisted Endovascular Systems is Rising Due to Patient Demand for Advanced Treatment to Fuel Market Growth in South Korea

Country South Korea
Market Size (US$ million) by End of Forecast Period (2033) US$ 2.1 million
CAGR % 2023 to End of Forecast (2033) 4.8%

The robotic assisted endovascular systems industry in South Korea is expected to reach a market size of US$ 2.1 million, expanding at a CAGR of 4.8% during the forecast period. Patients in South Korea are becoming more aware of and demanding advanced treatment options. They seek minimally invasive procedures that offer faster recovery, reduced pain, and improved quality of life compared to traditional open surgeries. Robotic Assisted Endovascular Systems enable minimally invasive interventions, making them appealing to patients and contributing to the growth of the market.

Category-Wise Insights

Systems Products to Dominate Robotic Assisted Endovascular Systems Industry with 8.8% CAGR through 2033

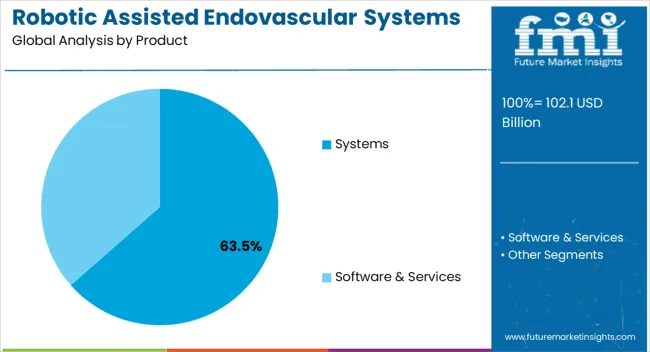
The systems is expected to dominate the robotic assisted endovascular systems industry with a CAGR of 8.8% from 2023 to 2033. They are transforming the way in which medical procedures are performed. These systems are contributing to the growth of this market in many ways as they allow for increased accuracy, faster procedures, and less invasive surgeries.

Endovascular operations are streamlined using robotic equipment, which give surgeons exquisite control and dexterity. They can help with activities including catheter manipulation, guidewire setting, and suturing, which improves the effectiveness of the procedures and cuts down on the time needed to complete them.

How the Percutaneous coronary intervention Applications Are Driving the Robotic Assisted Endovascular Systems Market?

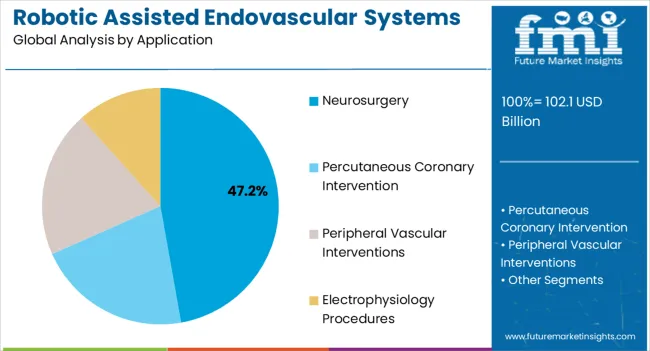
The percutaneous coronary intervention application segments are expected to dominate the robotic assisted endovascular systems industry with a CAGR of 9.9% from 2023 to 2033. This segment captures a significant market share in 2023. By unblocking or widening restricted coronary arteries, percutaneous coronary intervention is a minimally invasive treatment used to treat coronary artery disease. Because it is less invasive than conventional open-heart operations, it has grown in popularity. The need for cutting-edge technology like RAES to further enhance procedural results and patient experience has been fueled by the desire for minimally invasive therapies like percutaneous coronary intervention.

Which End User is Widely Adopted the Robotic Assisted Endovascular Systems?

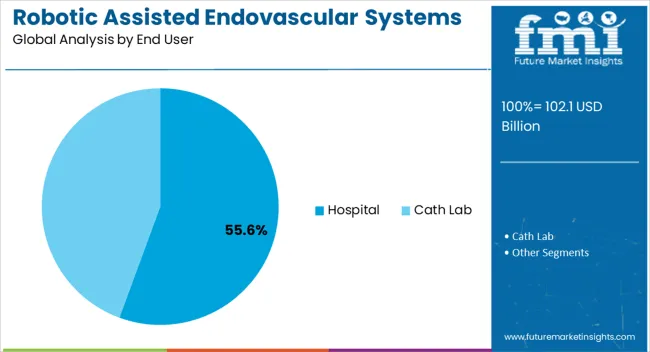
The hospital segment is expected to dominate the robotic assisted endovascular systems industry with a CAGR of 9.0% from 2023 to 2033. Hospitals are leading the way in embracing and putting innovative medical technologies into practice. Hospitals understand the value of integrating robotic-assisted endovascular systems into their facilities because these systems improve precision, accuracy, and patient outcomes. Their investment in RAES technology stimulates demand for these systems, which expands the market.
Get the data you need at a Fraction of the cost

Personalize your report by choosing insights you need
and save 40%!

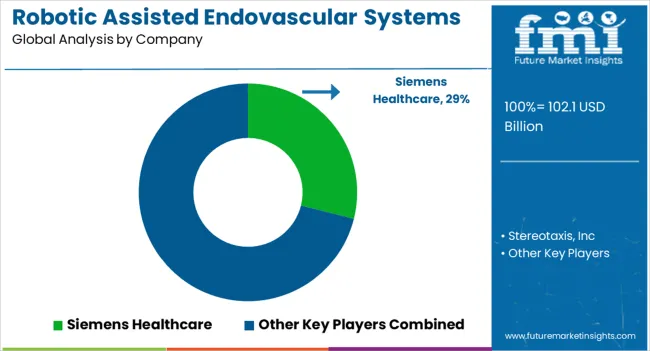
How Key Players Stay Competitive in the Robotic Assisted Endovascular Systems Industry?

The robotic assisted endovascular systems withdrawal device sector is fiercely competitive, with many companies fighting for market dominance. To stay ahead of the competition in such a circumstance, essential players must employ smart techniques.

Key Strategies Used by the Participants

  • Product Development

To produce novel products that increase effectiveness, dependability, and affordability, businesses make substantial expenditures in research and development. Product innovation enables companies to stand out from the competition while also meeting the shifting needs of their customers.

  • Strategic Alliances & Collaborations

Strategic partnerships and alliances with other companies are frequently formed by significant players in an industry to take benefit from each other's advantages and expand their market reach. Through such partnerships, businesses may also obtain access to new technologies and markets.

  • Expansion into Emerging Markets

In emerging economies like China as well as India, the robotic assisted endovascular systems removal device business is rising significantly. To boost their presence in these regions, major companies are expanding their supply chains and building regional manufacturing sites.

  • Acquisitions and mergers

Leading companies in the robotic assisted endovascular systems withdrawal devices industry routinely use mergers and acquisitions to bolster their market positions, broaden their product offerings, and enter new markets.

Key Players in the Robotic Assisted Endovascular Systems Industry

  • Siemens Healthcare
  • Stereotaxis, Inc

Key Developments in the Robotic Assisted Endovascular Systems Market:

  • Cathbot Robot Co., Ltd. (Shanghai Cathbot™), developed a vascular interventional surgical robot. In August 2022, the company announced the conclusion of its clinical trial, making it the first robotic system to have finished a multicenter clinical trial in China, for vascular intervention. Further, the company is a collaboration between French company Robocath S.A.S (Robocath), R-ONETM and Shanghai MicroPort MedBot (Group) Co., Ltd. (MicroPort® MedBot™)
  • In December 2018, 48 CorPath GRX Systems were deployed in hospitals around the United States, and four were installed abroad.

Segmentation Analysis of the Robotic Assisted Endovascular Systems Market

By Product:

  • Systems
  • Software & Services

By Application:

  • Neurosurgery
  • Percutaneous coronary intervention
  • Peripheral vascular interventions
  • Electrophysiology procedures

By End User:

  • Hospital
  • Cath Lab

By Region:

  • North America
  • Latin America
  • Europe
  • East Asia
  • South Asia
  • Oceania
  • The Middle East & Africa

Frequently Asked Questions

How Big is the Robotic Assisted Endovascular Systems Market?

The market is valued at US$ 94.0 million in 2023.

Who are the Key Robotic Assisted Endovascular Systems Market Players?

Key players include Siemens Healthcare, Stereotaxis Inc., and more.

Which Industry is the Key Consumer of Robotic Assisted Endovascular Systems?

Hospitals and labs are key consumers of these systems.

How much can the Robotic Assisted Endovascular Systems Market grow by 2033?

The market is likely to surpass US$ 214.7 million by 2033.

What Key Trends are Driving the Robotic Assisted Endovascular Systems Market?

Trends include AI integration, miniaturization, and collaborative robotics.

Table of Content

1. Executive Summary

    1.1. Global Market Outlook

    1.2. Demand Side Trends

    1.3. Supply Side Trends

    1.4. Analysis and Recommendations

2. Market Overview

    2.1. Market Coverage / Taxonomy

    2.2. Market Definition / Scope / Limitations

    2.3. Inclusions and Exclusions

3. Key Market Trends

    3.1. Key Trends Impacting the Market

    3.2. Product Innovation / Development Trends

4. Value Added Insights

    4.1. Product Adoption / Usage Analysis

    4.2. Product Features/ USPs

    4.3. Installed Base Scenario

    4.4. Technological Roadmap

    4.5. Recent Product Launches/Approvals

    4.6. Reimbursement Landscape, By Key Countries

    4.7. Regulatory Landscape

    4.8. PESTEL Analysis

    4.9. Porter’s Analysis

5. Market Background

    5.1. Macro-Economic Factors

        5.1.1. Global GDP Growth Outlook

        5.1.2. Global Healthcare Expenditure Outlook

        5.1.3. Global Navigation Systems Market Overview

    5.2. Forecast Factors - Relevance & Impact

        5.2.1. Key Player’s Historic Growth

        5.2.2. Increasing Cases of Endovascular Diseases

        5.2.3. Favourable Government Regulations

        5.2.4. Rising Demand for Minimally Invasive Procedures

        5.2.5. Technological Advancement in the Devices

        5.2.6. Increasing Prevalence of Cardiovascular Diseases

        5.2.7. Growing Product Demand For Pain Relief Management

        5.2.8. Increasing Number of Product Launches/Approvals

    5.3. Dynamics

        5.3.1. Drivers

        5.3.2. Restraints

        5.3.3. Opportunity Analysis

6. Global Market Volume (in Units) Analysis 2013 to 2022 and Forecast, 2023 to 2033

    6.1. Historical Volume (in Units) Analysis, 2013 to 2022

    6.2. Current and Future Volume (in Units) Projections, 2023 to 2033

        6.2.1. Y-o-Y Growth Trend Analysis

7. Global Market - Pricing Analysis

    7.1. Regional Pricing Analysis By Product

    7.2. Pricing Break-up

        7.2.1. Manufacturer Level Pricing

        7.2.2. Distributor Level Pricing

    7.3. Global Average Pricing Analysis Benchmark

    7.4. Pricing Assumptions

8. Global Market Demand (in Value or Size in US$ Mn) Analysis 2013 to 2022 and Forecast, 2023 to 2033

    8.1. Historical Market Value (US$ Million) Analysis, 2013 to 2022

    8.2. Current and Future Market Value (US$ Million) Projections, 2023 to 2033

        8.2.1. Y-o-Y Growth Trend Analysis

        8.2.2. Absolute $ Opportunity Analysis

9. Global Market Analysis 2013 to 2022 and Forecast 2023 to 2033, By Product

    9.1. Introduction / Key Findings

    9.2. Historical Market Size (US$ Million) and Volume (Units) Analysis By Product, 2013 to 2022

    9.3. Current and Future Market Size (US$ Million) and Volume (Units) Analysis and Forecast By Product, 2023 to 2033

        9.3.1. Systems

        9.3.2. Software & Services

    9.4. Market Attractiveness Analysis By Product

10. Global Market Analysis 2013 to 2022 and Forecast 2023 to 2033, By Application

    10.1. Introduction / Key Findings

    10.2. Historical Market Size (US$ Million) Analysis By Application, 2013 to 2022

    10.3. Current and Future Market Size (US$ Million) Analysis and Forecast By Application, 2023 to 2033

        10.3.1. Neurosurgery

        10.3.2. Percutaneous Coronary Intervention

        10.3.3. Peripheral Vascular Interventions

        10.3.4. Electrophysiology Procedures

    10.4. Market Attractiveness Analysis By Application

11. Global Market Analysis 2013 to 2022 and Forecast 2023 to 2033, By End User

    11.1. Introduction / Key Findings

    11.2. Historical Market Size (US$ Million) Analysis By End User, 2013 to 2022

    11.3. Current and Future Market Size (US$ Million) Analysis and Forecast By End User, 2023 to 2033

        11.3.1. Hospitals

        11.3.2. Cath Labs

    11.4. Market Attractiveness Analysis By End User

12. Global Market Analysis 2013 to 2022 and Forecast 2023 to 2033, by Region

    12.1. Introduction

    12.2. Historical Market Size (US$ Million) and Volume (Units) Analysis By Region, 2013 to 2022

    12.3. Current and Future Market Size (US$ Million) and Volume (Units) Analysis and Forecast By Region, 2023 to 2033

        12.3.1. North America

        12.3.2. Latin America

        12.3.3. Europe

        12.3.4. South Asia

        12.3.5. East Asia

        12.3.6. Oceania

        12.3.7. Middle East and Africa (MEA)

    12.4. Market Attractiveness Analysis By Region

13. North America Market Analysis 2013 to 2022 and Forecast 2023 to 2033

    13.1. Introduction

    13.2. Historical Market Size (US$ Million) and Volume (Units) Analysis By Market Taxonomy, 2013 to 2022

    13.3. Current and Future Market Size (US$ Million) and Volume (Units) Analysis and Forecast By Market Taxonomy, 2023 to 2033

        13.3.1. By Country

            13.3.1.1. USA

            13.3.1.2. Canada

        13.3.2. By Product

        13.3.3. By Application

        13.3.4. By End User

    13.4. Market Attractiveness Analysis

        13.4.1. By Country

        13.4.2. By Product

        13.4.3. By Application

        13.4.4. By End User

    13.5. Country Level Analysis & Forecast

        13.5.1. USA Market Analysis

            13.5.1.1. . Introduction

            13.5.1.2. Market Analysis and Forecast by Market Taxonomy

                13.5.1.2.1. By Product

                13.5.1.2.2. By Application

                13.5.1.2.3. By End User

        13.5.2. Canada Market Analysis

            13.5.2.1. Introduction

            13.5.2.2. Market Analysis and Forecast by Market Taxonomy

                13.5.2.2.1. By Product

                13.5.2.2.2. By Application

                13.5.2.2.3. By End User

    13.6. Market Trends

    13.7. Key Market Participants - Intensity Mapping

    13.8. Drivers and Restraints - Impact Analysis

14. Latin America Market Analysis 2013 to 2022 and Forecast 2023 to 2033

    14.1. Introduction

    14.2. Historical Market Size (US$ Million) and Volume (Units) Analysis By Market Taxonomy, 2013 to 2022

    14.3. Current and Future Market Size (US$ Million) and Volume (Units) Analysis and Forecast By Market Taxonomy, 2023 to 2033

        14.3.1. By Country

            14.3.1.1. Brazil

            14.3.1.2. Mexico

            14.3.1.3. Argentina

            14.3.1.4. Rest of Latin America

        14.3.2. By Product

        14.3.3. By Application

        14.3.4. By End User

    14.4. Market Attractiveness Analysis

        14.4.1. By Country

        14.4.2. By Product

        14.4.3. By Application

        14.4.4. By End User

    14.5. Country Level Analysis & Forecast

        14.5.1. Brazil Market Analysis

            14.5.1.1. Introduction

            14.5.1.2. Market Analysis and Forecast by Market Taxonomy

                14.5.1.2.1. By Product

                14.5.1.2.2. By Application

                14.5.1.2.3. By End User

        14.5.2. Mexico Market Analysis

            14.5.2.1. Introduction

            14.5.2.2. Market Analysis and Forecast by Market Taxonomy

                14.5.2.2.1. By Product

                14.5.2.2.2. By Application

                14.5.2.2.3. By End User

        14.5.3. Argentina Market Analysis

            14.5.3.1. Introduction

            14.5.3.2. Market Analysis and Forecast by Market Taxonomy

                14.5.3.2.1. By Product

                14.5.3.2.2. By Application

                14.5.3.2.3. By End User

    14.6. Market Trends

    14.7. Key Market Participants - Intensity Mapping

    14.8. Drivers and Restraints - Impact Analysis

15. Europe Market Analysis 2013 to 2022 and Forecast 2023 to 2033

    15.1. Introduction

    15.2. Historical Market Size (US$ Million) and Volume (Units) Analysis By Market Taxonomy, 2013 to 2022

    15.3. Current and Future Market Size (US$ Million) and Volume (Units) Analysis and Forecast By Market Taxonomy, 2023 to 2033

        15.3.1. By Country

            15.3.1.1. Germany

            15.3.1.2. France

            15.3.1.3. Italy

            15.3.1.4. UK

            15.3.1.5. Spain

            15.3.1.6. Russia

            15.3.1.7. BENELUX

            15.3.1.8. Rest of Europe

        15.3.2. By Product

        15.3.3. By Application

        15.3.4. By End User

    15.4. Market Attractiveness Analysis

        15.4.1. By Country

        15.4.2. By Product

        15.4.3. By Application

        15.4.4. By End User

    15.5. Country Level Analysis & Forecast

        15.5.1. Germany Market Analysis

            15.5.1.1. Introduction

            15.5.1.2. Market Analysis and Forecast by Market Taxonomy

                15.5.1.2.1. By Product

                15.5.1.2.2. By Application

                15.5.1.2.3. By End User

        15.5.2. France Market Analysis

            15.5.2.1. Introduction

            15.5.2.2. Market Analysis and Forecast by Market Taxonomy

                15.5.2.2.1. By Product

                15.5.2.2.2. By Application

                15.5.2.2.3. By End User

        15.5.3. Italy Market Analysis

            15.5.3.1. Introduction

            15.5.3.2. Market Analysis and Forecast by Market Taxonomy

                15.5.3.2.1. By Product

                15.5.3.2.2. By Application

                15.5.3.2.3. By End User

        15.5.4. UK Market Analysis

            15.5.4.1. Introduction

            15.5.4.2. Market Analysis and Forecast by Market Taxonomy

                15.5.4.2.1. By Product

                15.5.4.2.2. By Application

                15.5.4.2.3. By End User

        15.5.5. Spain Market Analysis

            15.5.5.1. Introduction

            15.5.5.2. Market Analysis and Forecast by Market Taxonomy

                15.5.5.2.1. By Product

                15.5.5.2.2. By Application

                15.5.5.2.3. By End User

        15.5.6. Russia Market Analysis

            15.5.6.1. Introduction

            15.5.6.2. Market Analysis and Forecast by Market Taxonomy

                15.5.6.2.1. By Product

                15.5.6.2.2. By Application

                15.5.6.2.3. By End User

        15.5.7. BENELUX Market Analysis

            15.5.7.1. Introduction

            15.5.7.2. Market Analysis and Forecast by Market Taxonomy

                15.5.7.2.1. By Product

                15.5.7.2.2. By Application

                15.5.7.2.3. By End User

    15.6. Market Trends

    15.7. Key Market Participants - Intensity Mapping

    15.8. Drivers and Restraints - Impact Analysis

16. South Asia Market Analysis 2013 to 2022 and Forecast 2023 to 2033

    16.1. Introduction

    16.2. Historical Market Size (US$ Million) and Volume (Units) Analysis By Market Taxonomy, 2013 to 2022

    16.3. Current and Future Market Size (US$ Million) and Volume (Units) Analysis and Forecast By Market Taxonomy, 2023 to 2033

        16.3.1. By Country

            16.3.1.1. India

            16.3.1.2. Thailand

            16.3.1.3. Indonesia

            16.3.1.4. Malaysia

            16.3.1.5. Rest of South Asia

        16.3.2. By Product

        16.3.3. By Application

        16.3.4. By End User

    16.4. Market Attractiveness Analysis

        16.4.1. By Country

        16.4.2. By Product

        16.4.3. By Application

        16.4.4. By End User

    16.5. Country Level Analysis & Forecast

        16.5.1. India Market Analysis

            16.5.1.1. . Introduction

            16.5.1.2. Market Analysis and Forecast by Market Taxonomy

                16.5.1.2.1. By Product

                16.5.1.2.2. By Application

                16.5.1.2.3. By End User

        16.5.2. Thailand Market Analysis

            16.5.2.1. . Introduction

            16.5.2.2. Market Analysis and Forecast by Market Taxonomy

                16.5.2.2.1. By Product

                16.5.2.2.2. By Application

                16.5.2.2.3. By End User

        16.5.3. Indonesia Market Analysis

            16.5.3.1. Introduction

            16.5.3.2. Market Analysis and Forecast by Market Taxonomy

                16.5.3.2.1. By Product

                16.5.3.2.2. By Application

                16.5.3.2.3. By End User

        16.5.4. Malaysia Market Analysis

            16.5.4.1. Introduction

            16.5.4.2. Market Analysis and Forecast by Market Taxonomy

                16.5.4.2.1. By Product

                16.5.4.2.2. By Application

                16.5.4.2.3. By End User

    16.6. Market Trends

    16.7. Key Market Participants - Intensity Mapping

    16.8. Drivers and Restraints - Impact Analysis

17. East Asia Market Analysis 2013 to 2022 and Forecast 2023 to 2033

    17.1. Introduction

    17.2. Historical Market Size (US$ Million) and Volume (Units) Analysis By Market Taxonomy, 2013 to 2022

    17.3. Current and Future Market Size (US$ Million) and Volume (Units) Analysis and Forecast By Market Taxonomy, 2023 to 2033

        17.3.1. By Country

            17.3.1.1. China

            17.3.1.2. Japan

            17.3.1.3. South Korea

        17.3.2. By Product

        17.3.3. By Application

        17.3.4. By End User

    17.4. Market Attractiveness Analysis

        17.4.1. By Country

        17.4.2. By Product

        17.4.3. By Application

        17.4.4. By End User

    17.5. Country Level Analysis & Forecast

        17.5.1. China Market Analysis

            17.5.1.1. Introduction

            17.5.1.2. Market Analysis and Forecast by Market Taxonomy

                17.5.1.2.1. By Product

                17.5.1.2.2. By Application

                17.5.1.2.3. By End User

        17.5.2. Japan Market Analysis

            17.5.2.1. Introduction

            17.5.2.2. Market Analysis and Forecast by Market Taxonomy

                17.5.2.2.1. By Product

                17.5.2.2.2. By Application

                17.5.2.2.3. By End User

        17.5.3. South Korea Market Analysis

            17.5.3.1. Introduction

            17.5.3.2. Market Analysis and Forecast by Market Taxonomy

                17.5.3.2.1. By Product

                17.5.3.2.2. By Application

                17.5.3.2.3. By End User

    17.6. Market Trends

    17.7. Key Market Participants - Intensity Mapping

    17.8. Drivers and Restraints - Impact Analysis

18. Oceania Market Analysis 2013 to 2022 and Forecast 2023 to 2033

    18.1. Introduction

    18.2. Historical Market Size (US$ Million) and Volume (Units) Analysis By Market Taxonomy, 2013 to 2022

    18.3. Current and Future Market Size (US$ Million) and Volume (Units) Analysis and Forecast By Market Taxonomy, 2023 to 2033

        18.3.1. By Country

            18.3.1.1. Australia

            18.3.1.2. New Zealand

        18.3.2. By Product

        18.3.3. By Application

        18.3.4. By End User

    18.4. Market Attractiveness Analysis

        18.4.1. By Country

        18.4.2. By Product

        18.4.3. By Application

        18.4.4. By End User

    18.5. Country Level Analysis & Forecast

        18.5.1. Australia Market Analysis

            18.5.1.1. Introduction

            18.5.1.2. Market Analysis and Forecast by Market Taxonomy

                18.5.1.2.1. By Product

                18.5.1.2.2. By Application

                18.5.1.2.3. By End User

        18.5.2. New Zealand Market Analysis

            18.5.2.1. Introduction

            18.5.2.2. Market Analysis and Forecast by Market Taxonomy

                18.5.2.2.1. By Product

                18.5.2.2.2. By Application

                18.5.2.2.3. By End User

    18.6. Market Trends

    18.7. Key Market Participants - Intensity Mapping

    18.8. Drivers and Restraints - Impact Analysis

19. Middle East and Africa Market Analysis 2013 to 2022 and Forecast 2023 to 2033

    19.1. Introduction

    19.2. Historical Market Size (US$ Million) and Volume (Units) Analysis By Market Taxonomy, 2013 to 2022

    19.3. Current and Future Market Size (US$ Million) and Volume (Units) Analysis and Forecast By Market Taxonomy, 2023 to 2033

        19.3.1. By Country

            19.3.1.1. GCC Countries

            19.3.1.2. Türkiye

            19.3.1.3. Northern Africa

            19.3.1.4. South Africa

            19.3.1.5. Rest of Middle East and Africa

        19.3.2. By Product

        19.3.3. By Application

        19.3.4. By End User

    19.4. Market Attractiveness Analysis

        19.4.1. By Country

        19.4.2. By Product

        19.4.3. By Application

        19.4.4. By End User

    19.5. Country Level Analysis & Forecast

        19.5.1. GCC Countries Market Analysis

            19.5.1.1. . Introduction

            19.5.1.2. Market Analysis and Forecast by Market Taxonomy

                19.5.1.2.1. By Product

                19.5.1.2.2. By Application

                19.5.1.2.3. By End User

        19.5.2. Türkiye Market Analysis

            19.5.2.1. Introduction

            19.5.2.2. Market Analysis and Forecast by Market Taxonomy

                19.5.2.2.1. By Product

                19.5.2.2.2. By Application

                19.5.2.2.3. By End User

        19.5.3. Northern Africa Market Analysis

            19.5.3.1. Introduction

            19.5.3.2. Market Analysis and Forecast by Market Taxonomy

                19.5.3.2.1. By Product

                19.5.3.2.2. By Application

                19.5.3.2.3. By End User

        19.5.4. South Africa Market Analysis

            19.5.4.1. Introduction

            19.5.4.2. Market Analysis and Forecast by Market Taxonomy

                19.5.4.2.1. By Product

                19.5.4.2.2. By Application

                19.5.4.2.3. By End User

    19.6. Market Trends

    19.7. Key Market Participants - Intensity Mapping

    19.8. Drivers and Restraints - Impact Analysis

20. Market Structure Analysis

    20.1. Market Analysis by Tier of Companies

    20.2. Market Share Analysis of Top Players

    20.3. Market Presence Analysis

21. Competition Analysis

    21.1. Competition Dashboard

    21.2. Branding and Promotional Strategies, By Key Players

    21.3. Key Development Analysis

    21.4. Competition Deep Dive

        21.4.1. Siemens Healthcare

            21.4.1.1. Overview

            21.4.1.2. Product Portfolio

            21.4.1.3. Key Financials

            21.4.1.4. Sales Footprint

            21.4.1.5. SWOT Analysis

            21.4.1.6. Strategy Overview

                21.4.1.6.1. Marketing Strategy

                21.4.1.6.2. Product Strategy

                21.4.1.6.3. Channel Strategy

        21.4.2. Stereotaxis, Inc

            21.4.2.1. Overview

            21.4.2.2. Product Portfolio

            21.4.2.3. Key Financials

            21.4.2.4. Sales Footprint

            21.4.2.5. SWOT Analysis

            21.4.2.6. Strategy Overview

                21.4.2.6.1. Marketing Strategy

                21.4.2.6.2. Product Strategy

                21.4.2.6.3. Channel Strategy

22. Assumptions and Acronyms Used

23. Research Methodology

List of Tables

Table 01A: Global Market Value (US$ Million) Analysis 2013 to 2022 and Forecast 2023 to 2033, by Product

Table 01B: Global Market Volume (Units) Analysis 2013 to 2022 and Forecast 2023 to 2033, by Product

Table 02: Global Market Value (US$ Million) Analysis 2013 to 2022 and Forecast 2023 to 2033, by Application

Table 03: Global Market Value (US$ Million) Analysis 2013 to 2022 and Forecast 2023 to 2033, by End User

Table 04: Global Market Value (US$ Million) Analysis 2013 to 2022 and Forecast 2023 to 2033, by Region

Table 05: North America Market Value (US$ Million) Analysis 2013 to 2022 and Forecast 2023 to 2033, by Country

Table 06A: North America Market Value (US$ Million) Analysis 2013 to 2022 and Forecast 2023 to 2033, by Product

Table 06B: North America Market Volume (Units) Analysis 2013 to 2022 and Forecast 2023 to 2033, by Product

Table 07: North America Market Value (US$ Million) Analysis 2013 to 2022 and Forecast 2023 to 2033, by Application

Table 08: North America Market Value (US$ Million) Analysis 2013 to 2022 and Forecast 2023 to 2033, by End User

Table 09: Latin America Market Value (US$ Million) Analysis 2013 to 2022 and Forecast 2023 to 2033, by Country

Table 10A: Latin America Market Value (US$ Million) Analysis 2013 to 2022 and Forecast 2023 to 2033, by Product

Table 10B: Latin America Market Volume (Units) Analysis 2013 to 2022 and Forecast 2023 to 2033, by Product

Table 11: Latin America Market Value (US$ Million) Analysis 2013 to 2022 and Forecast 2023 to 2033, by Application

Table 12: Latin America Market Value (US$ Million) Analysis 2013 to 2022 and Forecast 2023 to 2033, by End User

Table 13: Europe Market Value (US$ Million) Analysis 2013 to 2022 and Forecast 2023 to 2033, by Country

Table 14A: Europe Market Value (US$ Million) Analysis 2013 to 2022 and Forecast 2023 to 2033, by Product

Table 14B: Europe Market Volume (Units) Analysis 2013 to 2022 and Forecast 2023 to 2033, by Product

Table 15: Europe Market Analysis 2013 to 2022 and Forecast 2023 to 2033, by Application

Table 16: Europe Market Value (US$ Million) Analysis 2013 to 2022 and Forecast 2023 to 2033, by End User

Table 17: East Asia Market Value (US$ Million) Analysis 2013 to 2022 and Forecast 2023 to 2033, by Country

Table 18A: East Asia Market Value (US$ Million) Analysis 2013 to 2022 and Forecast 2023 to 2033, by Product

Table 18B: East Asia Market Volume (Units) Analysis 2013 to 2022 and Forecast 2023 to 2033, by Product

Table 19: East Asia Market Value (US$ Million) Analysis 2013 to 2022 and Forecast 2023 to 2033, by Application

Table 20: East Asia Market Value (US$ Million) Analysis 2013 to 2022 and Forecast 2023 to 2033, by End User

Table 21: South Asia Market Value (US$ Million) Analysis 2013 to 2022 and Forecast 2023 to 2033, by Country

Table 22A: South Asia Market Value (US$ Million) Analysis 2013 to 2022 and Forecast 2023 to 2033, by Product

Table 22B: South Asia Market Volume (Units) Analysis 2013 to 2022 and Forecast 2023 to 2033, by Product

Table 23: South Asia Market Value (US$ Million) Analysis 2013 to 2022 and Forecast 2023 to 2033, by Application

Table 24: South Asia Market Value (US$ Million) Analysis 2013 to 2022 and Forecast 2023 to 2033, by End User

Table 25: Oceania Market Value (US$ Million) Analysis 2013 to 2022 and Forecast 2023 to 2033, by Country

Table 26A: Oceania Market Value (US$ Million) Analysis 2013 to 2022 and Forecast 2023 to 2033, by Product

Table 26B: Oceania Market Volume (Units) Analysis 2013 to 2022 and Forecast 2023 to 2033, by Product

Table 27: Oceania Market Value (US$ Million) Analysis 2013 to 2022 and Forecast 2023 to 2033, by Application

Table 28: Oceania Market Value (US$ Million) Analysis 2013 to 2022 and Forecast 2023 to 2033, by End User

Table 29: Middle East & Africa Market Value (US$ Million) Analysis 2013 to 2022 and Forecast 2023 to 2033, by Country

Table 30A: Middle East & Africa Market Value (US$ Million) Analysis 2013 to 2022 and Forecast 2023 to 2033, by Product

Table 30B: Middle East and Africa Market Volume (Units) Analysis 2013 to 2022 and Forecast 2023 to 2033, by Product

Table 31: Middle East & Africa Market Value (US$ Million) Analysis 2013 to 2022 and Forecast 2023 to 2033 by Application

Table 32: Middle East & Africa Market Value (US$ Million) Analysis 2013 to 2022 and Forecast 2023 to 2033, by End User

List of Charts

Figure 01A: Global Market Volume (Units), 2013 to 2022

Figure 01B: Global Market Volume (Units) & Y-o-Y Growth (%) Analysis, 2023 to 2033

Figure 02A: Pricing Analysis per unit (US$), in 2022

Figure 02B: Pricing Forecast per unit (US$), in 2033

Figure 03A: Global Market Value (US$ Million) Analysis, 2013 to 2022

Figure 03B: Global Market Forecast & Y-o-Y Growth, 2023 to 2033

Figure 03C: Global Market Absolute $ Opportunity (US$ Million) Analysis, 2022 to 2033

Figure 04: Global Market Value Share (%) Analysis 2023 and 2033, by Product

Figure 05: Global Market Y-o-Y Growth (%) Analysis 2022-2033, by Product

Figure 06: Global Market Attractiveness Analysis 2023 to 2033, by Product

Figure 07: Global Market Value Share (%) Analysis 2023 and 2033, by Application

Figure 08: Global Market Y-o-Y Growth (%) Analysis 2022-2033, by Application

Figure 09: Global Market Attractiveness Analysis 2023 to 2033, by Application

Figure 10: Global Market Value Share (%) Analysis 2023 and 2033, by End User

Figure 11: Global Market Y-o-Y Growth (%) Analysis 2022-2033, by End User

Figure 12: Global Market Attractiveness Analysis 2023 to 2033, by End User

Figure 13: Global Market Value Share (%) Analysis 2023 and 2033, by Region

Figure 14: Global Market Y-o-Y Growth (%) Analysis 2022-2033, by Region

Figure 15: Global Market Attractiveness Analysis 2023 to 2033, by Region

Figure 16: North America Market Value (US$ Million) Analysis, 2013 to 2022

Figure 17: North America Market Value (US$ Million) Forecast, 2023-2033

Figure 18: North America Market Value Share, by Product (2023 E)

Figure 19: North America Market Value Share, by Application (2023 E)

Figure 20: North America Market Value Share, by End User (2023 E)

Figure 21: North America Market Value Share, by Country (2023 E)

Figure 22: North America Market Attractiveness Analysis by Product, 2023 to 2033

Figure 23: North America Market Attractiveness Analysis by Application, 2023 to 2033

Figure 24: North America Market Attractiveness Analysis by End User, 2023 to 2033

Figure 25: North America Market Attractiveness Analysis by Country, 2023 to 2033

Figure 26: USA Market Value Proportion Analysis, 2022

Figure 27: Global Vs. USA Growth Comparison

Figure 28: USA Market Share Analysis (%) by Product, 2022 & 2033

Figure 29: USA Market Share Analysis (%) by Application, 2022 & 2033

Figure 30: USA Market Share Analysis (%) by End User, 2022 & 2033

Figure 31: Canada Market Value Proportion Analysis, 2022

Figure 32: Global Vs. Canada. Growth Comparison

Figure 33: Canada Market Share Analysis (%) by Product, 2022 & 2033

Figure 34: Canada Market Share Analysis (%) by Application, 2022 & 2033

Figure 35: Canada Market Share Analysis (%) by End User, 2022 & 2033

Figure 36: Latin America Market Value (US$ Million) Analysis, 2013 to 2022

Figure 37: Latin America Market Value (US$ Million) Forecast, 2023-2033

Figure 38: Latin America Market Value Share, by Product (2023 E)

Figure 39: Latin America Market Value Share, by Application (2023 E)

Figure 40: Latin America Market Value Share, by End User (2023 E)

Figure 41: Latin America Market Value Share, by Country (2023 E)

Figure 42: Latin America Market Attractiveness Analysis by Product, 2023 to 2033

Figure 43: Latin America Market Attractiveness Analysis by Application, 2023 to 2033

Figure 44: Latin America Market Attractiveness Analysis by End User, 2023 to 2033

Figure 45: Latin America Market Attractiveness Analysis by Country, 2023 to 2033

Figure 46: Mexico Market Value Proportion Analysis, 2022

Figure 47: Global Vs Mexico Growth Comparison

Figure 48: Mexico Market Share Analysis (%) by Product, 2022 & 2033

Figure 49: Mexico Market Share Analysis (%) by Application, 2022 & 2033

Figure 50: Mexico Market Share Analysis (%) by End User, 2022 & 2033

Figure 51: Brazil Market Value Proportion Analysis, 2022

Figure 52: Global Vs. Brazil. Growth Comparison

Figure 53: Brazil Market Share Analysis (%) by Product, 2022 & 2033

Figure 54: Brazil Market Share Analysis (%) by Application, 2022 & 2033

Figure 55: Brazil Market Share Analysis (%) by End User, 2022 & 2033

Figure 56: Argentina Market Value Proportion Analysis, 2022

Figure 57: Global Vs Argentina Growth Comparison

Figure 58: Argentina Market Share Analysis (%) by Product, 2022 & 2033

Figure 59: Argentina Market Share Analysis (%) by Application, 2022 & 2033

Figure 60: Argentina Market Share Analysis (%) by End User, 2022 & 2033

Figure 61: Europe Market Value (US$ Million) Analysis, 2013 to 2022

Figure 62: Europe Market Value (US$ Million) Forecast, 2023-2033

Figure 63: Europe Market Value Share, by Product (2023 E)

Figure 64: Europe Market Value Share, by Application (2023 E)

Figure 65: Europe Market Value Share, by End User (2023 E)

Figure 66: Europe Market Value Share, by Country (2023 E)

Figure 67: Europe Market Attractiveness Analysis by Product, 2023 to 2033

Figure 68: Europe Market Attractiveness Analysis by Application, 2023 to 2033

Figure 69: Europe Market Attractiveness Analysis by End User, 2023 to 2033

Figure 70: Europe Market Attractiveness Analysis by Country, 2023 to 2033

Figure 71: UK Market Value Proportion Analysis, 2022

Figure 72: Global Vs. UK Growth Comparison

Figure 73: UK Market Share Analysis (%) by Product, 2022 & 2033

Figure 74: UK Market Share Analysis (%) by Application, 2022 & 2033

Figure 75: UK Market Share Analysis (%) by End User, 2022 & 2033

Figure 76: Germany Market Value Proportion Analysis, 2022

Figure 77: Global Vs. Germany Growth Comparison

Figure 78: Germany Market Share Analysis (%) by Product, 2022 & 2033

Figure 79: Germany Market Share Analysis (%) by Application, 2022 & 2033

Figure 80: Germany Market Share Analysis (%) by End User, 2022 & 2033

Figure 81: Italy Market Value Proportion Analysis, 2022

Figure 82: Global Vs. Italy Growth Comparison

Figure 83: Italy Market Share Analysis (%) by Product, 2022 & 2033

Figure 84: Italy Market Share Analysis (%) by Application, 2022 & 2033

Figure 85: Italy Market Share Analysis (%) by End User, 2022 & 2033

Figure 86: France Market Value Proportion Analysis, 2022

Figure 87: Global Vs France Growth Comparison

Figure 88: France Market Share Analysis (%) by Product, 2022 & 2033

Figure 89: France Market Share Analysis (%) by Application, 2022 & 2033

Figure 90: France Market Share Analysis (%) by End User, 2022 & 2033

Figure 91: Spain Market Value Proportion Analysis, 2022

Figure 92: Global Vs Spain Growth Comparison

Figure 93: Spain Market Share Analysis (%) by Product, 2022 & 2033

Figure 94: Spain Market Share Analysis (%) by Application, 2022 & 2033

Figure 95: Spain Market Share Analysis (%) by End User, 2022 & 2033

Figure 96: Russia Market Value Proportion Analysis, 2022

Figure 97: Global Vs Russia Growth Comparison

Figure 98: Russia Market Share Analysis (%) by Product, 2022 & 2033

Figure 99: Russia Market Share Analysis (%) by Application, 2022 & 2033

Figure 100: Russia Market Share Analysis (%) by End User, 2022 & 2033

Figure 101: BENELUX Market Value Proportion Analysis, 2022

Figure 102: Global Vs BENELUX Growth Comparison

Figure 103: BENELUX Market Share Analysis (%) by Product, 2022 & 2033

Figure 104: BENELUX Market Share Analysis (%) by Application, 2022 & 2033

Figure 105: BENELUX Market Share Analysis (%) by End User, 2022 & 2033

Figure 106: East Asia Market Value (US$ Million) Analysis, 2013 to 2022

Figure 107: East Asia Market Value (US$ Million) Forecast, 2023-2033

Figure 108: East Asia Market Value Share, by Product (2023 E)

Figure 109: East Asia Market Value Share, by Application (2023 E)

Figure 110: East Asia Market Value Share, by End User (2023 E)

Figure 111: East Asia Market Value Share, by Country (2023 E)

Figure 112: East Asia Market Attractiveness Analysis by Product, 2023 to 2033

Figure 113: East Asia Market Attractiveness Analysis by Application, 2023 to 2033

Figure 114: East Asia Market Attractiveness Analysis by End User, 2023 to 2033

Figure 115: East Asia Market Attractiveness Analysis by Country, 2023 to 2033

Figure 116: China Market Value Proportion Analysis, 2022

Figure 117: Global Vs. China Growth Comparison

Figure 118: China Market Share Analysis (%) by Product, 2022 & 2033

Figure 119: China Market Share Analysis (%) by Application, 2022 & 2033

Figure 120: China Market Share Analysis (%) by End User, 2022 & 2033

Figure 121: Japan Market Value Proportion Analysis, 2022

Figure 122: Global Vs. Japan Growth Comparison

Figure 123: Japan Market Share Analysis (%) by Product, 2022 & 2033

Figure 124: Japan Market Share Analysis (%) by Application, 2022 & 2033

Figure 125: Japan Market Share Analysis (%) by End User, 2022 & 2033

Figure 126: South Korea Market Value Proportion Analysis, 2022

Figure 127: Global Vs South Korea Growth Comparison

Figure 128: South Korea Market Share Analysis (%) by Product, 2022 & 2033

Figure 129: South Korea Market Share Analysis (%) by Application, 2022 & 2033

Figure 130: South Korea Market Share Analysis (%) by End User, 2022 & 2033

Figure 131: South Asia Market Value (US$ Million) Analysis, 2013 to 2022

Figure 132: South Asia Market Value (US$ Million) Forecast, 2023-2033

Figure 133: South Asia Market Value Share, by Product (2023 E)

Figure 134: South Asia Market Value Share, by Application (2023 E)

Figure 135: South Asia Market Value Share, by End User (2023 E)

Figure 136: South Asia Market Value Share, by Country (2023 E)

Figure 137: South Asia Market Attractiveness Analysis by Product, 2023 to 2033

Figure 138: South Asia Market Attractiveness Analysis by Application, 2023 to 2033

Figure 139: South Asia Market Attractiveness Analysis by End User, 2023 to 2033

Figure 140: South Asia Market Attractiveness Analysis by Country, 2023 to 2033

Figure 141: India Market Value Proportion Analysis, 2022

Figure 142: Global Vs. India Growth Comparison

Figure 143: India Market Share Analysis (%) by Product, 2022 & 2033

Figure 144: India Market Share Analysis (%) by Application, 2022 & 2033

Figure 145: India Market Share Analysis (%) by End User, 2022 & 2033

Figure 146: Indonesia Market Value Proportion Analysis, 2022

Figure 147: Global Vs. Indonesia Growth Comparison

Figure 148: Indonesia Market Share Analysis (%) by Product, 2022 & 2033

Figure 149: Indonesia Market Share Analysis (%) by Application, 2022 & 2033

Figure 150: Indonesia Market Share Analysis (%) by End User, 2022 & 2033

Figure 151: Malaysia Market Value Proportion Analysis, 2022

Figure 152: Global Vs. Malaysia Growth Comparison

Figure 153: Malaysia Market Share Analysis (%) by Product, 2022 & 2033

Figure 154: Malaysia Market Share Analysis (%) by Application, 2022 & 2033

Figure 155: Malaysia Market Share Analysis (%) by End User, 2022 & 2033

Figure 156: Thailand Market Value Proportion Analysis, 2022

Figure 157: Global Vs. Thailand Growth Comparison

Figure 158: Thailand Market Share Analysis (%) by Product, 2022 & 2033

Figure 159: Thailand Market Share Analysis (%) by Application, 2022 & 2033

Figure 160: Thailand Market Share Analysis (%) by End User, 2022 & 2033

Figure 161: Oceania Market Value (US$ Million) Analysis, 2013 to 2022

Figure 162: Oceania Market Value (US$ Million) Forecast, 2023-2033

Figure 163: Oceania Market Value Share, by Product (2023 E)

Figure 164: Oceania Market Value Share, by Application (2023 E)

Figure 165: Oceania Market Value Share, by End User (2023 E)

Figure 166: Oceania Market Value Share, by Country (2023 E)

Figure 167: Oceania Market Attractiveness Analysis by Product, 2023 to 2033

Figure 168: Oceania Market Attractiveness Analysis by Application, 2023 to 2033

Figure 169: Oceania Market Attractiveness Analysis by End User, 2023 to 2033

Figure 170: Oceania Market Attractiveness Analysis by Country, 2023 to 2033

Figure 171: Australia Market Value Proportion Analysis, 2022

Figure 172: Global Vs. Australia Growth Comparison

Figure 173: Australia Market Share Analysis (%) by Product, 2022 & 2033

Figure 174: Australia Market Share Analysis (%) by Application, 2022 & 2033

Figure 175: Australia Market Share Analysis (%) by End User, 2022 & 2033

Figure 176: New Zealand Market Value Proportion Analysis, 2022

Figure 177: Global Vs New Zealand Growth Comparison

Figure 178: New Zealand Market Share Analysis (%) by Product, 2022 & 2033

Figure 179: New Zealand Market Share Analysis (%) by Application, 2022 & 2033

Figure 180: New Zealand Market Share Analysis (%) by End User, 2022 & 2033

Figure 181: Middle East & Africa Market Value (US$ Million) Analysis, 2013 to 2022

Figure 182: Middle East & Africa Market Value (US$ Million) Forecast, 2023-2033

Figure 183: Middle East & Africa Market Value Share, by Product (2023 E)

Figure 184: Middle East & Africa Market Value Share, by Application (2023 E)

Figure 185: Middle East & Africa Market Value Share, by End User (2023 E)

Figure 186: Middle East & Africa Market Value Share, by Country (2023 E)

Figure 187: Middle East & Africa Market Attractiveness Analysis by Product, 2023 to 2033

Figure 188: Middle East & Africa Market Attractiveness Analysis by Application, 2023 to 2033

Figure 189: Middle East & Africa Market Attractiveness Analysis by End User, 2023 to 2033

Figure 190: Middle East & Africa Market Attractiveness Analysis by Country, 2023 to 2033

Figure 191: GCC Countries Market Value Proportion Analysis, 2022

Figure 192: Global Vs GCC Countries Growth Comparison

Figure 193: GCC Countries Market Share Analysis (%) by Product, 2022 & 2033

Figure 194: GCC Countries Market Share Analysis (%) by Application, 2022 & 2033

Figure 195: GCC Countries Market Share Analysis (%) by End User, 2022 & 2033

Figure 196: Türkiye Market Value Proportion Analysis, 2022

Figure 197: Global Vs. Türkiye Growth Comparison

Figure 198: Türkiye Market Share Analysis (%) by Product, 2022 & 2033

Figure 199: Türkiye Market Share Analysis (%) by Application, 2022 & 2033

Figure 200: Türkiye Market Share Analysis (%) by End User, 2022 & 2033

Figure 201: South Africa Market Value Proportion Analysis, 2022

Figure 202: Global Vs. South Africa Growth Comparison

Figure 203: South Africa Market Share Analysis (%) by Product, 2022 & 2033

Figure 204: South Africa Market Share Analysis (%) by Application, 2022 & 2033

Figure 205: South Africa Market Share Analysis (%) by End User, 2022 & 2033

Figure 206: Northern Africa Market Value Proportion Analysis, 2022

Figure 207: Global Vs Northern Africa Growth Comparison

Figure 208: Northern Africa Market Share Analysis (%) by Product, 2022 & 2033

Figure 209: Northern Africa Market Share Analysis (%) by Application, 2022 & 2033

Figure 210: Northern Africa Market Share Analysis (%) by End User, 2022 & 2033

Explore Healthcare Insights

View Reports

Robotic Assisted Endovascular Systems Market