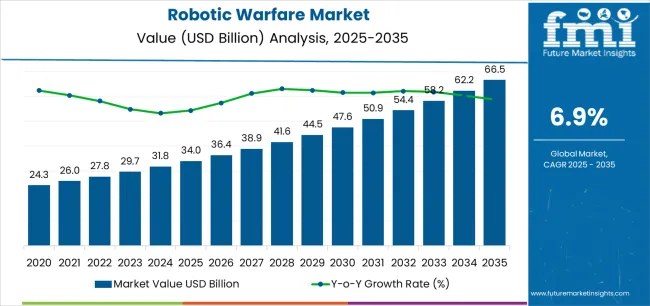
The Robotic Warfare Market is estimated to be valued at USD 34.0 billion in 2025 and is projected to reach USD 66.5 billion by 2035, registering a compound annual growth rate (CAGR) of 6.9% over the forecast period.
The robotic warfare market is expanding rapidly as defense modernization programs, technological integration, and geopolitical tensions drive investment in advanced combat automation. Increasing adoption of robotics for surveillance, logistics, and tactical support has strengthened operational efficiency and reduced human risk on the battlefield. The market’s current trajectory is being shaped by advancements in artificial intelligence, machine learning, and autonomous navigation systems that enhance precision and situational awareness.
Governments and defense agencies are prioritizing the deployment of intelligent systems capable of executing complex missions under minimal supervision. Over the forecast period, rising demand for unmanned platforms, data-driven combat systems, and network-centric warfare capabilities will further accelerate adoption.
Growth rationale is rooted in the necessity for enhanced battlefield agility, reduced personnel dependency, and improved mission success rates Continuous R&D efforts, collaborative defense partnerships, and increased defense budgets are expected to sustain long-term expansion and position robotic warfare technologies as a critical component of future military strategies.
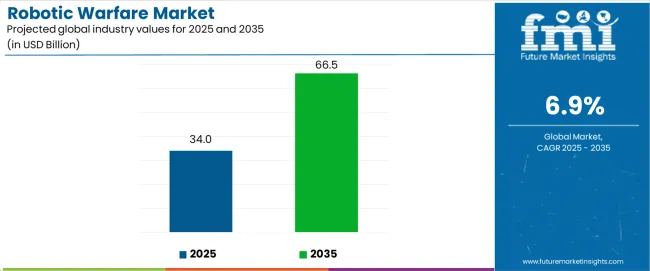
| Metric | Value |
|---|---|
| Robotic Warfare Market Estimated Value in (2025 E) | USD 34.0 billion |
| Robotic Warfare Market Forecast Value in (2035 F) | USD 66.5 billion |
| Forecast CAGR (2025 to 2035) | 6.9% |
The market is segmented by Application, Capability, and Mode of Operation and region. By Application, the market is divided into Combat And Operations, Intelligence, Surveillance And Reconnaissance, Logistics And Support, Search And Rescue, Tracking And Targeting, and Training And Simulation. In terms of Capability, the market is classified into Unmanned Platforms & Systems, Exoskeleton & Wearables, Target Acquisition Systems, and Turret And Weapon Systems. Based on Mode of Operation, the market is segmented into Semi-Autonomous and Autonomous. Regionally, the market is classified into North America, Latin America, Western Europe, Eastern Europe, Balkan & Baltic Countries, Russia & Belarus, Central Asia, East Asia, South Asia & Pacific, and the Middle East & Africa.
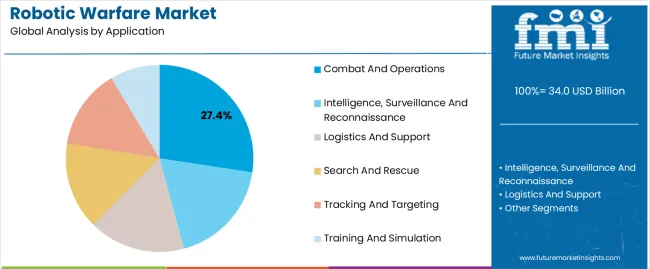
The combat and operations segment, holding 27.40% of the application category, has maintained dominance due to growing reliance on robotics for frontline missions, precision strikes, and tactical support. Its prominence is driven by the ability of robotic systems to perform high-risk tasks under adverse conditions while minimizing human exposure.
Integration of AI-powered decision systems and advanced sensors has enhanced operational responsiveness and mission accuracy. Defense forces are investing heavily in robotic units capable of executing coordinated maneuvers and supporting multi-domain operations.
The increasing complexity of warfare has further encouraged the adoption of robotic systems for reconnaissance, combat logistics, and target engagement Continuous improvements in communication networks, endurance, and payload capabilities are expected to sustain this segment’s growth and reinforce its role as a key operational enabler within modern defense architectures.
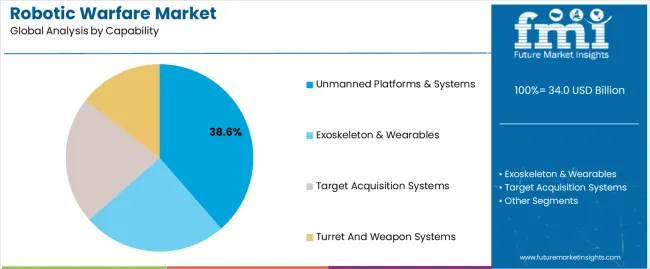
The unmanned platforms and systems segment, accounting for 38.60% of the capability category, has emerged as a leading area of focus as global defense agencies prioritize automation for efficiency, safety, and mission precision. Its dominance is being driven by rising adoption of drones, unmanned ground vehicles, and autonomous marine systems across multiple combat and surveillance applications.
Development of integrated control frameworks and AI-assisted mission planning has enhanced reliability and adaptability in dynamic environments. The scalability of unmanned systems allows seamless deployment across different terrains and operational intensities.
As governments pursue modernization and interoperability, investments in modular unmanned solutions continue to rise This segment’s sustained expansion is expected to be supported by cost optimization, technological standardization, and continuous innovation in remote control and autonomy technologies.
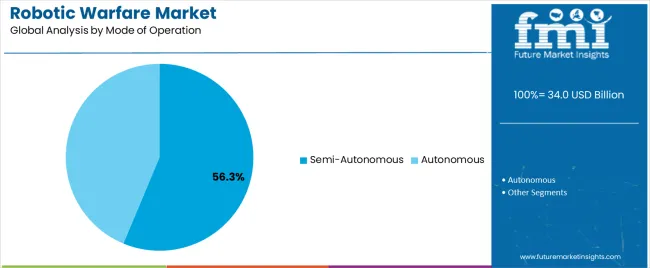
The semi-autonomous segment, representing 56.30% of the mode of operation category, has captured the largest market share due to the balance it offers between human oversight and automated functionality. Its widespread adoption is being driven by regulatory and ethical considerations that favor partial autonomy over full automation in lethal systems.
Semi-autonomous platforms allow operators to maintain control over critical decision points while leveraging automation for navigation, targeting, and situational analysis. Advancements in sensor fusion, communication latency reduction, and AI-assisted command systems have improved performance and reliability.
Military programs across major economies are deploying semi-autonomous vehicles and drones for reconnaissance, combat support, and logistics missions Continued investment in dual-mode systems, capable of transitioning between manual and autonomous control, is expected to strengthen this segment’s market share and reinforce its strategic importance in future warfare operations.
During the historical period from 2020 to 2025, the robotic warfare market witnessed robust growth, indicated by a CAGR of 9%. Increased defense spending, technological advancements, and the adoption of unmanned systems for military applications drove this accelerated growth.
Looking ahead to the forecast period from 2025 to 2035, the market is expected to continue expanding, albeit slightly slower, with a projected CAGR of 7.3%.
This forecasted growth reflects ongoing investments in robotics and autonomous systems by defense organizations worldwide, driven by the need for enhanced military capabilities, including surveillance, reconnaissance, and combat operations.
The historical analysis indicates a period of rapid expansion for the market, characterized by significant technological advancements and increasing adoption by military forces globally.
The forecasted projections suggest continued growth opportunities, albeit slightly moderated, as the market matures and faces evolving geopolitical dynamics and budgetary constraints.
| Historical CAGR from 2020 to 2025 | 9% |
|---|---|
| Forecast CAGR from 2025 to 2035 | 7.3% |
The table showcases the top five countries ranked by revenue, with South Korea holding the top position. South Korea has made significant investments in research and development, particularly in robotics, artificial intelligence, and autonomous systems.
The defense sector is known for its expertise in developing and producing innovative robotic warfare technologies, including unmanned aerial vehicles (UAVs), unmanned ground vehicles (UGVs), and surveillance systems.
The strategic location and security concerns drive the demand for cutting-edge military technologies, positioning the country as a key player in the global market.
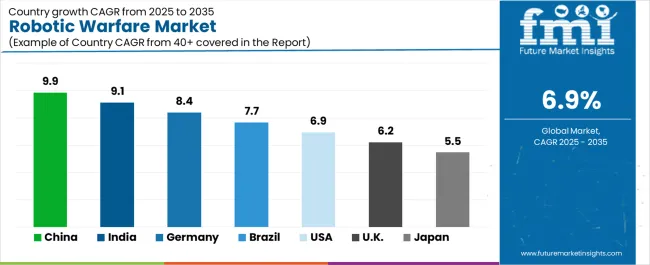
| Countries | Forecast CAGRs from 2025 to 2035 |
|---|---|
| The United States | 7.5% |
| The United Kingdom | 8.4% |
| China | 7.9% |
| Japan | 8.8% |
| South Korea | 9% |
The United States leads in the market due to its extensive military investments, technological prowess, and strategic military engagements worldwide. With a focus on maintaining military superiority and leveraging cutting-edge technology, the United States heavily utilizes robotic warfare systems for surveillance, reconnaissance, and combat operations.
These systems enhance the effectiveness and capabilities of United States military forces across various domains, including air, land, and sea.
The strong presence of the United Kingdom in the market stems from its commitment to modernizing its armed forces and staying at the forefront of defense innovation.
As a key NATO member and global security contributor, the United Kingdom relies on robotic warfare technologies to enhance its military capabilities, improve situational awareness, and mitigate operational risks.
The United Kingdom defense industry is renowned for its expertise in developing advanced unmanned systems, further driving the adoption and utilization of robotic warfare solutions.
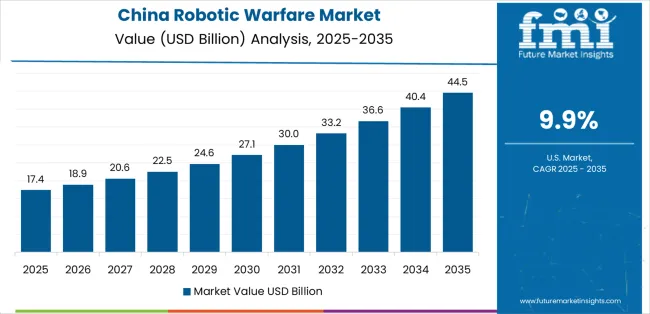
The significant utilization of robotic warfare technologies reflects its growing military ambitions, geopolitical aspirations, and technological advancements. China is investing heavily in defense modernization and developing cutting-edge robotic systems for various military applications as a rising global power.
With a focus on enhancing its military capabilities across air, land, and sea domains, China leverages robotic warfare solutions to strengthen its national security, assert regional influence, and safeguard its strategic interests.
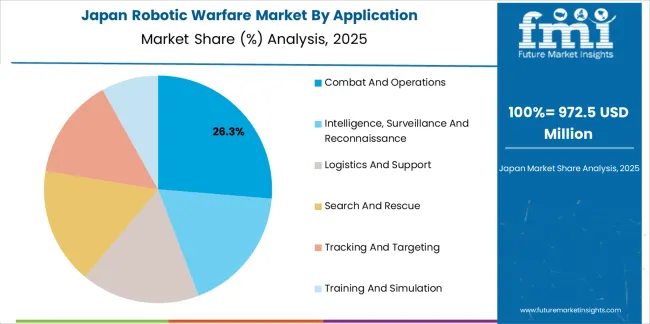
The increasing adoption of robotic warfare technologies is driven by its evolving security challenges, demographic shifts, and technological innovation. As a pacifist nation with constitutional constraints on military activities, Japan relies on robotic warfare systems to enhance its defense capabilities while minimizing risks to personnel.
The defense industry is renowned for its expertise in robotics and autonomous systems, making it a key player in developing and deploying unmanned platforms for defense and security purposes.
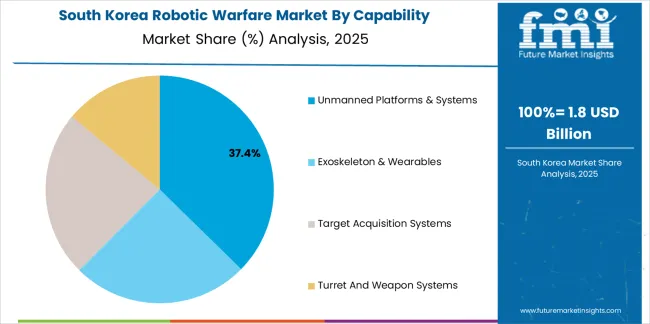
The significant usage of robotic warfare systems is driven by their geopolitical dynamics, regional security threats, and technological prowess. As a key player in the Asia-Pacific region, South Korea faces complex security challenges, including tensions with North Korea and evolving threats in the cyber and maritime domains.
South Korea invests in robotic warfare technologies to address these challenges, enhance its military capabilities, strengthen deterrence, and maintain peace and stability on the Korean Peninsula.
The vibrant defense industry and strong government support for research and development contribute to the leadership in the market.
The below section shows the leading segment. Based on application, the intelligence, surveillance, and reconnaissance segment is registered to expand at 7.1% CAGR by 2035. Based on capability, the unmanned platforms and systems segment is projected to expand at 6.8% CAGR by 2035.
For intelligence, surveillance, and reconnaissance (ISR) applications, a key driver is the increasing emphasis on national security and counterterrorism efforts. Industries such as agriculture, construction, oil and gas, and transportation are increasingly adopting unmanned systems for tasks such as aerial surveys, infrastructure inspection, environmental monitoring, and cargo delivery.
| Category | CAGR from 2025 to 2035 |
|---|---|
| Intelligence, surveillance, and reconnaissance | 7.1% |
| Unmanned platforms and systems | 6.8% |
In terms of application, the intelligence, surveillance, and reconnaissance (ISR) segment is anticipated to grow at a Compound Annual Growth Rate (CAGR) of 7.1% by 2035. This growth is attributed to the increasing demand for advanced ISR capabilities in military operations, border surveillance, and law enforcement.
ISR systems, including unmanned aerial vehicles (UAVs), satellites, and ground-based sensors, play a crucial role in gathering real-time intelligence, monitoring activities, and enhancing situational awareness on the battlefield or in strategic areas.
Regarding capability, the unmanned platforms and systems segment is projected to expand at a CAGR of 6.8% by 2035. This growth is driven by the rising adoption of unmanned platforms, such as drones, unmanned ground vehicles (UGVs), and unmanned underwater vehicles (UUVs), across various military and civilian applications.
Unmanned systems offer several advantages, including reduced operational costs, enhanced safety for personnel, and increased endurance and range compared to manned platforms.
The growing need for autonomous and remotely operated systems to perform missions in hazardous or inaccessible environments further fuels the demand for unmanned platforms and systems, driving market growth in this segment.
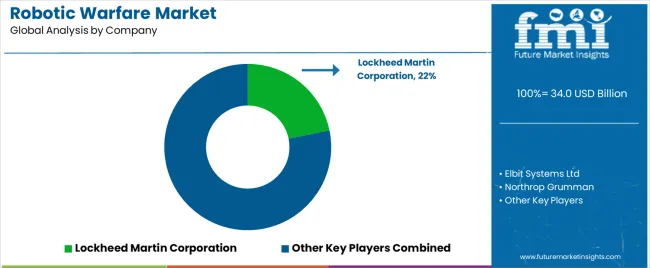
A diverse array of global players, including defense contractors, technology firms, and research institutions, characterizes the competitive landscape of the robotic warfare market.
Emerging players and startups contribute to the competitive dynamics, offering specialized solutions and innovative technologies. Government defense agencies drive demand significantly through defense procurement programs and collaborations with industry partners.
Continuous investments in research and development, along with strategic partnerships, shape the competitive landscape of the market.
Some of the key developments
| Attributes | Details |
|---|---|
| Estimated Market Size in 2025 | USD 31.7 billion |
| Projected Market Valuation in 2035 | USD 64 billion |
| Value-based CAGR 2025 to 2035 | 7.3% |
| Forecast Period | 2025 to 2035 |
| Historical Data Available for | 2020 to 2025 |
| Market Analysis | Value in USD billion |
| Key Regions Covered | North America; Latin America; Western Europe; Eastern Europe; South Asia and Pacific; East Asia; Middle East and Africa |
| Key Market Segments Covered | Application, Capability, Mode of Operation, Region |
| Key Countries Profiled | The United States, Canada, Brazil, Mexico, Rest of Latin America, Germany, The United Kingdom, France, Spain, Italy, Russia, Poland, Czech Republic, Romania, India, Bangladesh, Australia, New Zealand, China, Japan, South Korea, GCC countries, South Africa, Israel |
| Key Companies Profiled | Elbit Systems Ltd; Lockheed Martin Corporation; Northrop Grumman; Rheinmetall AG; Thales Group; QinetiQ |
The global robotic warfare market is estimated to be valued at USD 34.0 billion in 2025.
The market size for the robotic warfare market is projected to reach USD 66.5 billion by 2035.
The robotic warfare market is expected to grow at a 6.9% CAGR between 2025 and 2035.
The key product types in robotic warfare market are combat and operations, intelligence, surveillance and reconnaissance, logistics and support, search and rescue, tracking and targeting and training and simulation.
In terms of capability, unmanned platforms & systems segment to command 38.6% share in the robotic warfare market in 2025.


Our Research Products

The "Full Research Suite" delivers actionable market intel, deep dives on markets or technologies, so clients act faster, cut risk, and unlock growth.

The Leaderboard benchmarks and ranks top vendors, classifying them as Established Leaders, Leading Challengers, or Disruptors & Challengers.

Locates where complements amplify value and substitutes erode it, forecasting net impact by horizon

We deliver granular, decision-grade intel: market sizing, 5-year forecasts, pricing, adoption, usage, revenue, and operational KPIs—plus competitor tracking, regulation, and value chains—across 60 countries broadly.

Spot the shifts before they hit your P&L. We track inflection points, adoption curves, pricing moves, and ecosystem plays to show where demand is heading, why it is changing, and what to do next across high-growth markets and disruptive tech

Real-time reads of user behavior. We track shifting priorities, perceptions of today’s and next-gen services, and provider experience, then pace how fast tech moves from trial to adoption, blending buyer, consumer, and channel inputs with social signals (#WhySwitch, #UX).

Partner with our analyst team to build a custom report designed around your business priorities. From analysing market trends to assessing competitors or crafting bespoke datasets, we tailor insights to your needs.
Supplier Intelligence
Discovery & Profiling
Capacity & Footprint
Performance & Risk
Compliance & Governance
Commercial Readiness
Who Supplies Whom
Scorecards & Shortlists
Playbooks & Docs
Category Intelligence
Definition & Scope
Demand & Use Cases
Cost Drivers
Market Structure
Supply Chain Map
Trade & Policy
Operating Norms
Deliverables
Buyer Intelligence
Account Basics
Spend & Scope
Procurement Model
Vendor Requirements
Terms & Policies
Entry Strategy
Pain Points & Triggers
Outputs
Pricing Analysis
Benchmarks
Trends
Should-Cost
Indexation
Landed Cost
Commercial Terms
Deliverables
Brand Analysis
Positioning & Value Prop
Share & Presence
Customer Evidence
Go-to-Market
Digital & Reputation
Compliance & Trust
KPIs & Gaps
Outputs
Full Research Suite comprises of:
Market outlook & trends analysis
Interviews & case studies
Strategic recommendations
Vendor profiles & capabilities analysis
5-year forecasts
8 regions and 60+ country-level data splits
Market segment data splits
12 months of continuous data updates
DELIVERED AS:
PDF EXCEL ONLINE
Robotic Lawn Mower Market Size and Share Forecast Outlook 2025 to 2035
Robotics Welding Market Size and Share Forecast Outlook 2025 to 2035
Robotic Rehab Tools Market Analysis - Size, Share, and Forecast Outlook 2025 to 2035
Robotics-Assisted Telesurgery Market Size and Share Forecast Outlook 2025 to 2035
Robotic Packaging Machines Market Size and Share Forecast Outlook 2025 to 2035
Robotic Assisted Endovascular Systems Market Size and Share Forecast Outlook 2025 to 2035
Robotic Lung Biopsy Market Size and Share Forecast Outlook 2025 to 2035
Robotics as a Service (RaaS) Market Size and Share Forecast Outlook 2025 to 2035
Robotic X-ray Scanner Market Size and Share Forecast Outlook 2025 to 2035
Robotic Catheterization Systems Market Growth – Innovations, Trends & Forecast 2025-2035
Robotic Aseptic Syringe Filler Capper Market Size and Share Forecast Outlook 2025 to 2035
Robotic Vision Market Size and Share Forecast Outlook 2025 to 2035
Robotics Actuators Market Size and Share Forecast Outlook 2025 to 2035
Robotic Biopsy Devices Market Insights - Trends & Forecast 2025 to 2035
Robotic Palletizers & De-Palletizers Market Growth - Forecast 2025 to 2035
Robotic Vacuum Cleaners Market Growth - Trends & Demand from 2025 to 2035
The Robotics Market Analysis – Size, Share, and Forecast Outlook 2025 to 2035
Robotics Prototyping Market Trends - Growth & Forecast 2025 to 2035
Robotic Process Automation Market by Component, Operation, Industry & Region Forecast till 2025 to 2035
Competitive Landscape of Robotic Vacuum Cleaner Providers

Thank you!
You will receive an email from our Business Development Manager. Please be sure to check your SPAM/JUNK folder too.
Chat With
MaRIA