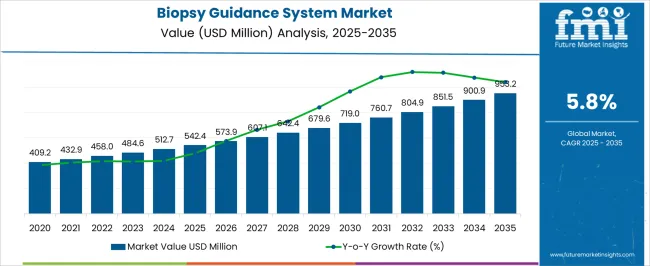
The Biopsy Guidance System Market is estimated to be valued at USD 542.4 million in 2025 and is projected to reach USD 953.2 million by 2035, registering a compound annual growth rate (CAGR) of 5.8% over the forecast period.
| Metric | Value |
|---|---|
| Biopsy Guidance System Market Estimated Value in (2025 E) | USD 542.4 million |
| Biopsy Guidance System Market Forecast Value in (2035 F) | USD 953.2 million |
| Forecast CAGR (2025 to 2035) | 5.8% |
The Biopsy Guidance System market is witnessing consistent expansion as healthcare systems prioritize early diagnosis and minimally invasive procedures for cancer detection and chronic disease management. The increasing global incidence of cancer, combined with a shift toward image-guided precision diagnostics, has accelerated the adoption of biopsy guidance systems.
Clinical innovations, as highlighted in oncology journals and hospital network updates, have strengthened the demand for real-time visualization tools that enhance procedural accuracy while reducing patient risk. Advancements in imaging technology and integration with digital health platforms are also driving growth, particularly in settings where diagnostic speed and accuracy are critical.
Press releases from medical device manufacturers indicate rising investments in research and training to support the adoption of these systems in emerging healthcare markets With a growing emphasis on personalized care and reduced diagnostic turnaround times, the market is expected to evolve further, offering scalable and patient-centered solutions that align with the evolving demands of modern medicine.
The market is segmented by Product Type, Application, and End-User and region. By Product Type, the market is divided into Ultrasound Guided Biopsy, Stereotactic Guided Biopsy, and MRI Guided Biopsy. In terms of Application, the market is classified into Breast Biopsy, Brain Biopsy, and Other Applications. Based on End-User, the market is segmented into Hospitals, Specialty Clinics, Diagnostic Centers, and Research and Academic Institutes. Regionally, the market is classified into North America, Latin America, Western Europe, Eastern Europe, Balkan & Baltic Countries, Russia & Belarus, Central Asia, East Asia, South Asia & Pacific, and the Middle East & Africa.
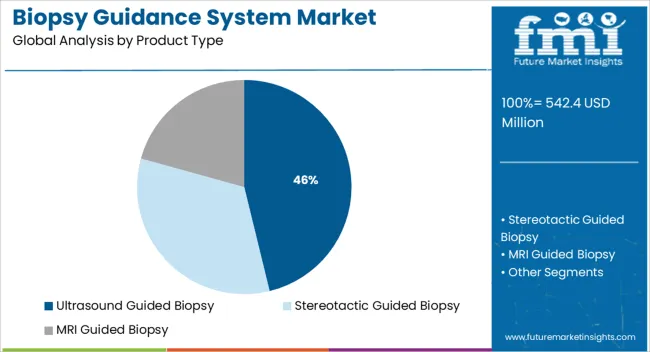
The ultrasound guided biopsy segment is projected to hold 46.2% of the Biopsy Guidance System market revenue share in 2025, making it the leading product type. This dominance is being driven by the widespread use of ultrasound technology in diagnostic imaging due to its real-time capabilities, safety, and cost-effectiveness.
Hospitals and diagnostic centers have increasingly adopted ultrasound guided biopsy systems for soft tissue examinations, where real-time needle placement is critical to procedural success. Reports from clinical institutions emphasize that the non-ionizing nature of ultrasound contributes to its preference in routine and repeat biopsy procedures, particularly in high-risk patient populations.
The segment’s growth has also been supported by the portability of ultrasound systems, allowing their use in a wide range of clinical settings, including point-of-care diagnostics The ability to integrate with digital guidance software has further strengthened clinical confidence, making ultrasound guided biopsy a standard option in image-assisted interventions.
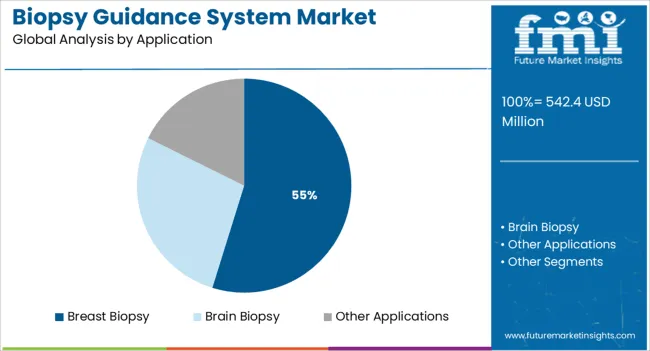
The breast biopsy segment is expected to account for 54.8% of the Biopsy Guidance System market revenue share in 2025, positioning it as the most dominant application. This leadership is being supported by the high global prevalence of breast cancer and the emphasis on early detection through national screening initiatives.
Clinical practice guidelines and oncology program updates have continued to prioritize accurate, minimally invasive biopsy techniques for early-stage diagnosis, which has increased demand for advanced guidance systems. Healthcare providers are utilizing these systems to enhance lesion targeting, reduce sampling errors, and improve diagnostic yield, particularly in dense breast tissues.
The availability of dedicated guidance platforms designed specifically for breast imaging, along with their compatibility with multiple imaging modalities, has further reinforced this segment's position These systems have also gained traction due to their role in reducing the need for surgical biopsies, improving patient experience and reducing procedural costs.
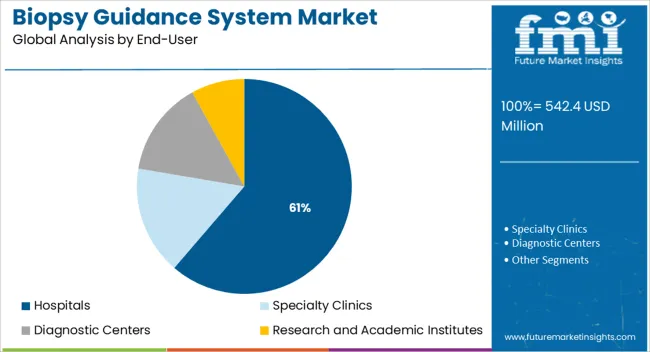
The hospitals segment is projected to dominate the market with a 61.3% revenue share in 2025, attributed to their central role in diagnostics and interventional procedures. Hospitals have remained the primary centers for advanced imaging and biopsy procedures due to their infrastructure, multidisciplinary expertise, and ability to handle high patient volumes. Clinical updates from tertiary care institutions have emphasized the increasing deployment of integrated biopsy guidance systems that support accurate, image-driven diagnostics.
Investment in modernizing diagnostic departments, as seen in public health infrastructure plans and private hospital expansions, has driven procurement of versatile biopsy guidance platforms. Furthermore, hospitals benefit from close collaboration between radiology and pathology units, enabling efficient workflows and faster clinical decisions.
The integration of guidance systems with hospital-wide electronic health records and imaging archives has further supported adoption These factors have ensured that hospitals continue to lead in the implementation and use of biopsy guidance technologies across various clinical disciplines.
As per the Biopsy Guidance System Market research by Future Market Insights - a market research and competitive intelligence provider, historically, from 2020 to 2024, the market value of the Biopsy Guidance System Market increased at around 5.1% CAGR.
The rising prevalence of cancer, the rise in the geriatric population, the rising demand for non-invasive procedures, technological innovations, and government initiatives, are the key drivers for the market. A biopsy is one of the most common procedures for diagnosing cancer and other chronic diseases, and it is used to diagnose breast, brain, skin, and prostate cancers.
The rising incidence of cancer is one of the major drivers of market expansion. Because the biopsy guidance system is one of the most important requirements for the initial diagnosis of cancer, the market is expected to grow at a rapid pace over the forecast period.
As a result of the substantial increase in the incidence of cancer, more advanced technology, safer, and more effective biopsies are being developed, which is driving the biopsy market. Non-invasive procedures are becoming more popular, which is fueling market growth in that area.
Patients owing to the high costs and painful side effects that come with this treatment, resulting in undiagnosed or inadequate diseases later in life, often avoid invasive biopsies. These symptoms consequently increase mortality rates and lead to greater expenses and difficulties in treatment.
The demand for non-invasive procedures is skyrocketing owing to the boost in demand for biopsy guidance systems, resulting in a surge in the need for biopsy guidance systems. Patients recover faster and are less traumatized as a result of these procedures. Owing to these factors, Biopsy Guidance System Market is projected to grow at a CAGR of 5.8 % over the coming 10 years.
When the tumor is located deep within the body, image-guided biopsies are used. Biopsy guidance systems are both cost-effective and simple to operate. They can provide superb real-time details that cause the procedure to be less uncomfortable and more efficient for the patient. Furthermore, these guided biopsies can enable to rapid inspect numerous lesions in the axillary and sub-areolar areas.
The segment is growing due to the rising demand for robotic biopsies due to their less invasive nature. A rising number of product launches, combined with quick FDA approval, are also contributing to the segment's growth.
Increased awareness of biopsy guidance systems, increased healthcare infrastructure development, impressive reimbursement policies, increased investment in healthcare research and development, and an upsurge in the number of hospitals and diagnostic centers are expected to drive demand for biopsy guidance systems during the forecast period.
North America accounts for the largest market share during the forecast period. Because of factors such as improved infrastructure, rising patient awareness, and the presence of key players in the region also the presence of a large number of academic institutes, enhanced healthcare infrastructure, and Research and Development institutes are all contributing to the market's growth. In addition, the USA has a large number of market participants.
On the other hand, the market in the Asia Pacific is expected to grow at the fastest pace with an absolute dollar opportunity of USD 880 Million during the forecast period. The presence of leading manufacturers in countries such as Japan, as well as a growing number of local producers in countries like China and India, are driving the regional market forward.
Over the projected period, the market is expected to be fuelled by an increasing number of healthcare institutions, the rising need for diagnostic centers, and expanding Research and Development projects. The market is expected to grow over the forecast period, owing to an increase in the number of cancer cases and advancements in biopsy guidance systems.
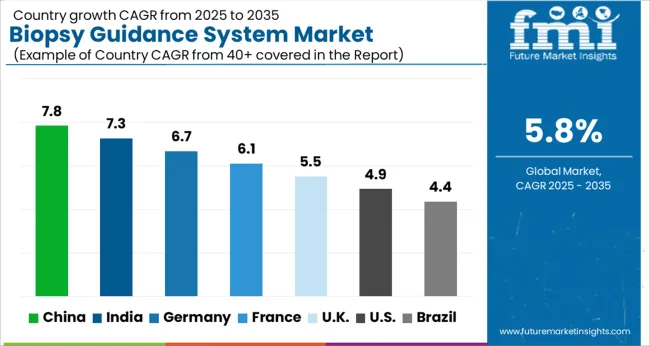
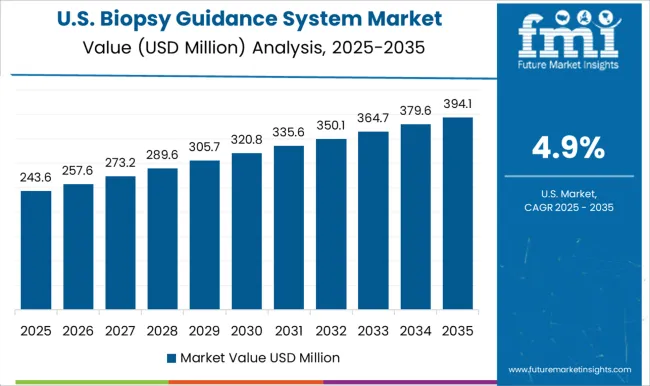
The USA is expected to account for the largest market of USD 953.2 Million by the end of 2035. This is attributable to a significant increase in research & development activities. Furthermore, advances in the healthcare industry have resulted in the development of new technologies and equipment, which is further expected to boost the market in the USA. Furthermore, the presence of well-known corporations, as well as early access to new and developing technologies, is projected to aid the market in the USA in maintaining its global market supremacy in the next years.
The market in China is expected to grow at a CAGR of 7.1% during the forecast period, approaching a market revenue of USD 230.9 Million by 2035. In Asian countries, traditional biopsy techniques such as core-needle biopsies and surgical biopsies continue to dominate the cancer diagnostic market. A significant increase in cancer incidence is a major driver of regional market expansion.
The market in the UK is projected to reach a valuation of USD 89 Million by 2035, growing at a CAGR of 6.5% from 2025 to 2035. During this period, the market is projected to garner an absolute dollar opportunity of USD 41 Million.
In Japan, the market is expected to reach USD 78 Million by 2035. Growing at a CAGR of 7.1% from 2025 to 2035, the market in the country is expected to gross an absolute dollar opportunity of around USD 39 Million.
During the forecast period, the stereotactically guided biopsy segment is anticipated to experience rapid expansion. New product launches, originating with new and improved product efficacy, and the introduction of technological advances using 2D-3D image guidance, will help propel the segment forward.
The combination of increased awareness and the introduction of innovative medical technologies has led to an increased demand for stereotactic-guided biopsies. In addition, the introduction of automated core biopsy guns has boosted the popularity of this method. Several medical facilities have broadened the use of stereotactic-guided biopsy to all challenging mammographic lesions.
Over the forecast period, the ultrasound-guided biopsy segment is expected to increase at the fastest rate. It is the safest and most effective imaging technique for targeting fine-needle aspirations and percutaneous biopsies. Using real-time imaging, it is a secure and controllable method for targeting needles for abdominal and pelvic tissues and masses.
It has several advantages in comparison to CT-guided biopsies, such as portability, cost, and the lack of ionizing radiation. In a safe fashion, the procedure can be carried out on a variety of lesions that are as small as 1 cm. Therefore, an ultrasound-guided biopsy is becoming increasingly popular among patients.
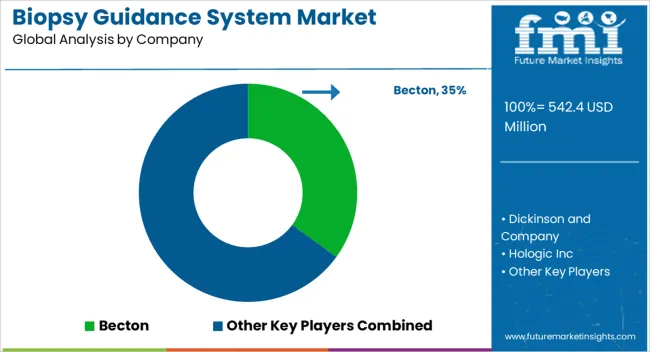
With many local firms vying against multinational competitors, the market is significantly fragmented. To stay competitive in the industry, major businesses are focusing more on research and development of new products.
The prominent players in the Biopsy Guidance System Market are Becton, Dickinson, and Company, Hologic, Inc., Devicor Medical Products, Inc., B. Braun Melsungen AG, and ARGON MEDICAL. Major market players use a variety of methods to preserve their dominance, including high Research and Development activity, global expansion strategies, broad product offers, and frequent introduction of advanced versions of existing items.
Some of the recent developments of key Biopsy Guidance System providers are as follows:
Similarly, the team at Future Market Insights, which is available in the full report, has tracked recent developments related to companies offering Biopsy Guidance Systems.
The global biopsy guidance system market is estimated to be valued at USD 542.4 million in 2025.
The market size for the biopsy guidance system market is projected to reach USD 953.2 million by 2035.
The biopsy guidance system market is expected to grow at a 5.8% CAGR between 2025 and 2035.
The key product types in biopsy guidance system market are ultrasound guided biopsy, stereotactic guided biopsy and mri guided biopsy.
In terms of application, breast biopsy segment to command 54.8% share in the biopsy guidance system market in 2025.


Our Research Products

The "Full Research Suite" delivers actionable market intel, deep dives on markets or technologies, so clients act faster, cut risk, and unlock growth.

The Leaderboard benchmarks and ranks top vendors, classifying them as Established Leaders, Leading Challengers, or Disruptors & Challengers.

Locates where complements amplify value and substitutes erode it, forecasting net impact by horizon

We deliver granular, decision-grade intel: market sizing, 5-year forecasts, pricing, adoption, usage, revenue, and operational KPIs—plus competitor tracking, regulation, and value chains—across 60 countries broadly.

Spot the shifts before they hit your P&L. We track inflection points, adoption curves, pricing moves, and ecosystem plays to show where demand is heading, why it is changing, and what to do next across high-growth markets and disruptive tech

Real-time reads of user behavior. We track shifting priorities, perceptions of today’s and next-gen services, and provider experience, then pace how fast tech moves from trial to adoption, blending buyer, consumer, and channel inputs with social signals (#WhySwitch, #UX).

Partner with our analyst team to build a custom report designed around your business priorities. From analysing market trends to assessing competitors or crafting bespoke datasets, we tailor insights to your needs.
Supplier Intelligence
Discovery & Profiling
Capacity & Footprint
Performance & Risk
Compliance & Governance
Commercial Readiness
Who Supplies Whom
Scorecards & Shortlists
Playbooks & Docs
Category Intelligence
Definition & Scope
Demand & Use Cases
Cost Drivers
Market Structure
Supply Chain Map
Trade & Policy
Operating Norms
Deliverables
Buyer Intelligence
Account Basics
Spend & Scope
Procurement Model
Vendor Requirements
Terms & Policies
Entry Strategy
Pain Points & Triggers
Outputs
Pricing Analysis
Benchmarks
Trends
Should-Cost
Indexation
Landed Cost
Commercial Terms
Deliverables
Brand Analysis
Positioning & Value Prop
Share & Presence
Customer Evidence
Go-to-Market
Digital & Reputation
Compliance & Trust
KPIs & Gaps
Outputs
Full Research Suite comprises of:
Market outlook & trends analysis
Interviews & case studies
Strategic recommendations
Vendor profiles & capabilities analysis
5-year forecasts
8 regions and 60+ country-level data splits
Market segment data splits
12 months of continuous data updates
DELIVERED AS:
PDF EXCEL ONLINE
Biopsy Device Market Forecast and Outlook 2025 to 2035
Microbiopsy Market Size and Share Forecast Outlook 2025 to 2035
Lung Biopsy Systems Market Size and Share Forecast Outlook 2025 to 2035
Breast Biopsy Market Size and Share Forecast Outlook 2025 to 2035
Cancer Biopsy Market - Growth & Technological Innovations 2025 to 2035
Breast Biopsy Devices Market Analysis - Innovations & Forecast 2025 to 2035
Liquid Biopsy Market Analysis - Size, Share, and Forecast Outlook 2025 to 2035
Robotic Biopsy Devices Market Insights - Trends & Forecast 2025 to 2035
MRI Safe Biopsy Needle Market
Robotic Lung Biopsy Market Size and Share Forecast Outlook 2025 to 2035
Aspiration & Biopsy Needles Market Analysis - Trends & Forecast 2025 to 2035
Stereotactic Biopsy Tables Market
MRI Compatible Biopsy Devices Market
Cold Disposable Biopsy Forceps Market Growth – Trends & Forecast 2025 to 2035
Endobronchial Ultrasound Biopsy Market Size and Share Forecast Outlook 2025 to 2035
Ultrasound-Guided Breast Biopsy Market Size and Share Forecast Outlook 2025 to 2035
Epidural Guidance Systems Market Outlook - Share, Growth & Forecast 2025 to 2035
Autonomous Ultrasound Guidance Market Analysis - Size, Share, and Forecast Outlook 2025 to 2035
System-On-Package Market Size and Share Forecast Outlook 2025 to 2035
Systems Administration Management Tools Market Size and Share Forecast Outlook 2025 to 2035

Thank you!
You will receive an email from our Business Development Manager. Please be sure to check your SPAM/JUNK folder too.
Chat With
MaRIA