Reports

- Global Locations -

Headquarters

Future Market Insights, Inc.

Christiana Corporate, 200
Continental Drive, Suite 401,
Newark, Delaware - 19713,
United States

T: +1-845-579-5705

Americas

Future Market Insights, Inc.

616 Corporate Way, Suite 2-9018,
Valley Cottage, NY 10989, United States

T: +1-347-918-3531

MEA

Future Market Insights

1602-6 Jumeirah Bay X2 Tower, Plot No: JLT-PH2-X2A,
Jumeirah Lakes Towers, Dubai,
United Arab Emirates

Europe

Future Market Insights

3rd Floor, 207 Regent Street,
W1B 3HH London
United Kingdom

T: + 44 (0) 20 8123 9659
D: +44 (0) 20 3287 4268

Asia Pacific

Future Market Insights

IndiaLand Global Tech Park, Unit UG-1, Behind Grand HighStreet, Phase 1, Hinjawadi, MH, Pune – 411057, India

A Summary of the Gas Convection Oven Market Developments (2023 to 2033)

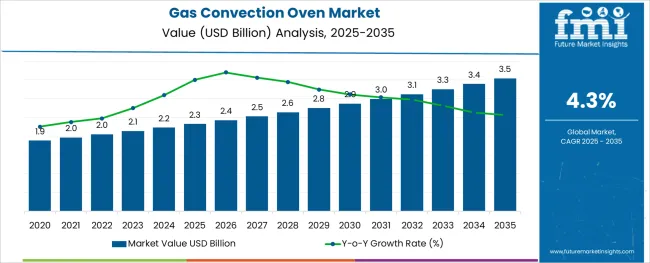
The global gas convection oven market is projected to have a moderate-paced CAGR of 4.3% during the forecast period. The current valuation of the market is US$ 2,137 million in 2023. The market value of the gas convection oven market is anticipated to reach a high of US$ 3,263.3 million by the year 2033. A historical market valuation of US$ 2,026.1 million has been recorded by the experts of Future Market Insights for the concerned market during the base year. This growth is supported by:

  • Increased cooking capabilities of a gas convection oven to process, roast, and heat the food in no time.
  • Advancement of technology and its implication in the gas convection ovens like true convection for faster cooking of food is fueling the sale of gas convection ovens lately.
  • Significant increase in disposable income and rise in the working-class segment in emerging markets is further fueling the adoption of gas convection ovens across the globe.
  • The surging propensity of consumers to spend on appliances that provide them assistance in kitchen chores has generated a rising demand for gas convection ovens.
  • Change in the lifestyle of consumers is encouraging them to opt for stylish and convenient appliances that complement their living standards.
  • The rise in the consumption of frozen food items that are eaten after defrosting and heating, and elevated consumer inclination towards such food is also a factor fueling the growth of the gas convection oven market.
  • The innovation of smart ovens that use radiofrequency technology is an added advantage for baking, heating, boiling, and steaming food, which is attracting customers and is likely to propel the growth of the market in the forthcoming years.
Report Attribute Details
Gas Convection Oven Market Value (2023) US$ 2,137 million
Gas Convection Oven Market Anticipated Value (2033) US$ 3,263.3 million
Gas Convection Oven Projected Growth Rate (2023 to 2033) 4.3%

Although the market is having healthy growth, the expert analysts at Future Market Insights have revealed that certain elements prevailing in the market are likely to hinder the pace of advancement in the forum. These curbing aspects identified are as follows:

  • Prominent use of traditional cooking equipment in less developed regions limits the acceptance of the product and growth of the gas convection oven market.
  • High energy consumption by gas convection ovens acts as one of the major restraining factors for the growth of the global gas convection oven market.

Don't pay for what you don't need

Customize your report by selecting specific countries or regions and save 30%!

Integration of IoT in Gas Convection Ovens - A Windfall for Manufacturers

It has been identified by FMI experts while analyzing the market in-depth that customers are attracted by innovative technology integrated into gas convection ovens and other heating spin-offs. The Internet of Things (IoT) has emerged as a unique integration to these ovens and the sale of IoT ovens is now increasing at a high pace, owing to their ability to get connected with the smartphones and internet. This feature is making an allowance for users to change cooking settings and is creating lucrative opportunities for manufacturers to unravel revenue pockets due to the increase in demand for gas convection ovens.

Peek into the Historical Market Scenario

As per the analysis of FMI, it is identified that the gas convection oven market is witnessing an unprecedented surge over the past few years. There is an approximate rise of US$ 1,126.3 million surge in the total market value from 2022 to 2023. The market during the period 2018 to 2023 registered a CAGR of 3.4%.

The growth of the forum can largely be attributed to the desire for an easy and convenient lifestyle among consumers. The high consumption of ready-to-eat food, pre-packed meal, and fast-food restaurants, coupled with convenience stores has become a habit linked to our current fast-paced lifestyle, which is further bolstering the market size of gas convection ovens.

The number of working-class women is on the rise which leaves them with very less time for cooking with gas convection ovens, and thus gas convection ovens serve as a convenient option. In addition to that, portable gas convection ovens are a blessing and possess the ability to function as a normal one with good battery life and are available at a lower price, which has majorly contributed to the higher demand for this product, boosting the market growth during the period 2018 to 2022.

Nandini Roy Choudhury

Principal Consultant

Talk to Analyst

Find your sweet spots for generating winning opportunities in this market.

Comparative Analysis of Adjacent Markets

Gas Convection Oven Market:

Differentiating Aspects Gas Convection Oven Market
CAGR from 2023 to 2033 4.3%
Current Valuation in 2023 US$ 2137 Million
Projected Valuation in 2033 US$ 3,263.3 Million
Demand Drivers
  • More flexibility in food placement is expected to fuel demand for small gas convection ovens.
  • Ease of cooking multiple and larger dishes more effectively than conventional ovens to jig up sales.

Commercial Oven Market:

Differentiating Aspects Commercial Oven Market
CAGR from 2023 to 2033 4.5%
Current Valuation in 2023 US$ 10,752 Million
Projected Valuation in 2033 US$ 16,697.53 Million
Demand Drivers
  • The convenience of use in both small and large-quantity cooking applications is a key factor fueling the market growth of the product.
  • Robust growth of the food service industry and an increase in the number of QSRs and fast-food chains are propelling the market.
  • The growing inclination toward energy-efficient convection ovens is a key demand driver identified.

Microwave Oven Market:

Differentiating Aspects Microwave Oven Market
CAGR from 2023 to 2033 4.6%
Current Valuation in 2023 US$ 9,781.80 Million
Projected Valuation in 2033 US$ 15,336.84 Million
Demand Drivers
  • New products entering the global microwave oven market are being equipped with new features, for instance, combi ovens (a combination of grill and convection microwave ovens) are witnessing a significant uptake among customers from both household and commercial settings.
  • The growing health risk associated with eating oily food has driven customers toward multi-functional microwave ovens that can assist in oil-free cooking.

Category-wise Insights

Identifying the Domineering Segments in the Forum

Double Door Gas Convection Ovens - By Top Door Type

It has been identified that the double-door kitchen aid gas convection oven segment is likely to exert dominance during the forecast period in the door type category. Currently, this segment is projected to move forward at a moderate pace, registering a CAGR of 4.6%. A historical CAGR of 3.9% has been recorded by FMI during the period 2018 to 2023. The factors attributing to the growth of this segment can be identified as the following:

  • The convenience of cooking two dishes at a time with different temperature settings is making consumers inclined towards this product and boosting the sale for the same.
  • Cooking multiple dishes with different techniques is possible such as broiling at the top oven and toasting at the bottom makes it easier for customers, and is likely to acquire more market shares in the upcoming years.

Free-standing Gas Convection Ovens - By Top Mount Type

The free-standing segment is projected to dominate the top-mount type category for gas convection ovens. This segment is estimated to advance at a steady pace and is likely to record a CAGR of 4.1% through the forecast period. The free-standing segment accounted for a historical CAGR of 3.2% during the period 2018 to 2022. The factors responsible for the advancement of this segment are as follows:
  • The free-standing gas convection ovens are typically less expensive and the installation charges associated with them are comparatively less.
  • Installation is simple as compared to other variants of gas convection ovens, as one need not worry about fitting in around cabinetry, and is gaining quite a momentum in tandem with the changing preferences of consumers across the globe.

Get the data you need at a Fraction of the cost

Personalize your report by choosing insights you need
and save 40%!

Country-wise Insights

Robust Surge in Technological Advances Revamp the Landscape of the Gas Convection Oven Market Across Diverse Geographies

Country United States of America
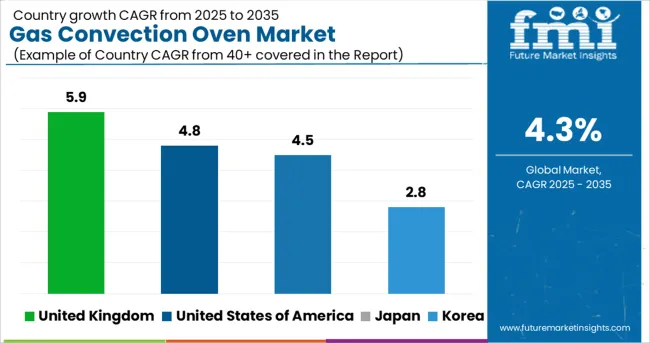
Statistics The USA gas convection oven market is projected to dominate the North American region with a CAGR of 4.8% through 2033. There has been an absolute surge in market valuation of US$ 302.9 million from the base year to the current. The market has been advancing at a CAGR of 4.1% during the period 2018 to 2022 and is estimated to account for a market valuation of US$ 815.8 million by the end of 2033.
Growth Propellants The factors responsible for the growth of the market are:
  • A substantial number of food processing facilities are moving towards automation techniques, expediting the manufacturing process in the USA, which is fueling the market size for gas convection systems.
  • The surge in the food service industry across the country is a key aspect propelling the market growth for the same.
Country United Kingdom
Statistics The UK is anticipated to dominate the European gas convection oven market. The forum is advancing at a moderate pace, recording a CAGR of 5.9% through the forecast period. The UK gas convection oven market is projected to touch a high of US$ 228.4 million by the year 2033. A considerable surge of US$ 100.2 million has been witnessed from the base year to the current year. Historical CAGR: 3.4%
Growth Propellants The factors attributing to the growth of the market are:
  • Rapid urbanization across Europe and increasing disposable income have been the major factors driving the growth of the food service industry in the UK, which in turn is fueling the market growth for the concerned product.
  • presence of more affordable and convenient fast-food outlets and rising advertising and promotional activities by large food service chains are some of the major factors that are contributing to the adoption of gas convection ovens across the food industry verticals.
Country Japan
Statistics The Japanese gas convection oven market is moving forward at an average pace, registering a CAGR of 4.5%. The market is forecast to account for a valuation of US$ 205.5 million by 2033. There has been a considerable surge of US$ 73.1 million from the year 2022-2023. Historical CAGR: 3.4%
Growth Propellants Demand drivers identified in the Japan gas convection oven market are:
  • A high population ratio, coupled with a rise in disposable income and an enhanced standard of living is reshaping the landscape for gas convection ovens.
  • The bakery industry is expanding in Japan, leading to the preparation of cookies, bread, cakes, and more, fostering the demand for gas convection ovens across Japan.
Country Korea
Statistics The Korean gas convection oven market is anticipated to witness notable growth through the forecast period. The market is advancing at a steady pace and is expected to register a CAGR of 2.8% during the period 2023 to 2033. The market is estimated to reach a valuation of US$ 81.5 million by the end of 2033. An approximate US$ 19.6 million surge in market share has been witnessed from 2022 to 2023.
Historical CAGR: 2.7%
Growth Propellants The market is witnessing growth owing to factors like:
  • Increased government support and initiatives for research and development activities are extended towards the manufacturers to further innovate the products and expand the market share for gas convection ovens across Korea.
  • The presence of key players across the country along with consumers seeking convenient cooking solutions is a major cause of growth for the market.

Start-up Ecosystem

New Entrants in the Forum Stir Up the market Dynamics

The new entrants in the gas convection oven market are leveraging advancements in technology to launch new products and gain a competitive advantage. These firms are continually investing in research and development activities to keep themselves in tandem with the changing consumer preferences and end-use industry demands. Efforts are being made to strengthen their foothold in the forum and aid the further progression of the rice processing machines market.

Top Start-ups to Watch For

Tovala - USA-based Start-up

Funding: US$ 61 Million

Provider of connected smart ovens and gas convection ovens. The features include broiling, steaming, convection and microwave heating, toasting in a single pot, scan-to-cook options, and mobile application integration. The company also offers smart meals on a subscription basis that are automatically identified and cooked by the usage of preset cooking cycles. Its app is available on Android and iOS platforms.

June - USA-based Start-up

Funding: 30 Million

Internet-first brand offering smart top gas convection ovens. The oven features include sensors that detect the weight and set the temperature automatically. Its app has features like intelligent alerts, video monitoring, and meal planning. The mobile app is available for Android and iOS users.
Competitive Landscape

Key Players Revolutionize and Unravel Revenue Pockets with their Innovative Attempts

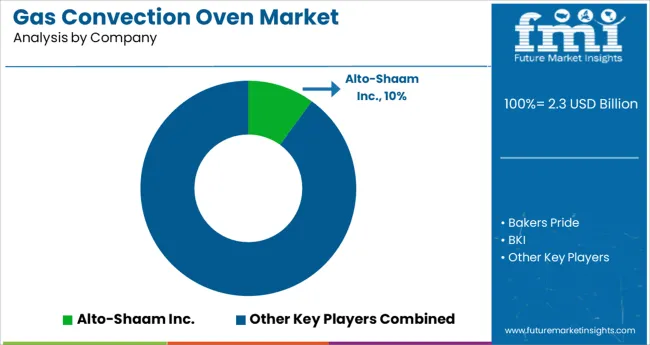
Due to the existence of numerous international and regional companies, the market for gas convection ovens is very competitive. To strengthen their position in the market, major players are implementing a variety of methods, including product portfolio growth and regional development. Leading market players are adopting various business strategies, such as mergers and acquisitions, to expand their geographic presence and consumer base across the world.

Some key players are heavily investing in Research and Development activities to develop energy-efficient gas convection ovens equipped with features such as access to the internet, and are strengthening their market presence.

An Indian brand Tajshree is curating gas convection ovens that are 25 percent faster than normal deck ovens with Baking temperatures that are lower than normal deck ovens. Their gas convection ovens are specially designed with aerodynamics high capacity and low power blowers, along with steaming arrangement incorporations.

Alto-Shaam recently introduced cook & hold ovens, smoker ovens, and Ventech hoods, and is launching with the new Vector H series oven with larger chambers and pioneering Structured Air Technology, allowing the ovens to cook twice as much food up to twice as quickly as their traditional counterparts. This will assist in catering to a large number of customers and expand Alto-Shaam’s offerings.

Recent Developments

  • On September 23, 2020, the Electrolux Group relaunched its Continental brand of home appliances in the Brazilian market, introducing 27 new-generation products such as built-in gas convection ovens, microwaves, and refrigerators with new price ranges, as well as a brand campaign encouraging equality in the home. This will assist in expanding the company’s offerings and cater to a broad range of customers.
  • In May 2018, LG Electronics India announced 20 more exclusive outlets in Andhra Pradesh and Telangana.
  • In February 2017, New Oven Technology has been acquired by Alto-Shaam from Appliance Innovation to commercialize the oven line, which comes with structured air technology.

Some of the key companies proliferating in the market are

  • G.S. BLODGETT
  • Admiral Craft Equipment
  • Alto-Shaam
  • Montague
  • Moffat Group
  • Cadco
  • Lang World
  • BKI
  • Merrychef
  • Southbend

Key Segments in the Gas Convection Oven Market

Based on Type:

  • Countertop Gas Convection Ovens
  • Floor Model Gas Convection Ovens

Based on End Use:

  • Food Processing
  • HoReCa
  • Bakery
  • Household
  • Others

Based On the Distribution Channel:

  • Business to Business
  • Business to Consumer
  • Hypermarkets/Supermarkets
  • Specialty Stores
  • Online Retail
  • Others

Based On Region:

  • North America
  • Latin America
  • Asia Pacific
  • Middle East and Africa (MEA)
  • Europe

Frequently Asked Questions

What is the Growth Outlook for the Gas Convection Oven Market?

The growth outlook for the gas convection oven market is predicted to advance at a CAGR of 4.3% from 2023 to 2033.

Which Region Leads the Gas Convection Oven Market?

The North American region is anticipated to lead the gas convection oven market during the forecast period.

What is the market valuation of the Gas Convection Oven in 2023?

The market valuation of the gas convection oven market stands at US$ 2,137 million in 2023.

How much Growth Potential does the Gas Convection Oven hold?

The gas convection oven market is likely to hold a valuation of US$ 3,263.3 million by 2033.

Which sector is the key driver in the Gas Convection Oven Market?

The restaurant sector is the key driver in the gas convection oven market.

Table of Content

1. Executive Summary | Gas Convection Oven Market

2. Market Overview

    2.1. Market Definition and Introduction

    2.2. Market Taxonomy/ Research Scope

3. Market Background and Foundation Data

    3.1. Global FnB Processing Equipment Industry Outlook

    3.2. Penetration of in Global Market

    3.3. Comparison of Different Types

    3.4. Growth & Development Pattern in Market

    3.5. Market Opportunity Assessment

        3.5.1. Total Available Market (US$ Million)

        3.5.2. Serviceable Addressable Market (US$ Million)

        3.5.3. Serviceable Obtainable Market (US$ Million)

    3.6. Market White Space Assessment

    3.7. Market Dynamics

        3.7.1. Market Growth Drivers

        3.7.2. Market Restraints

        3.7.3. Market Opportunity

        3.7.4. Market Trends

    3.8. PESTLE Analysis

    3.9. Porter`s Five Force Analysis

    3.10. Investment Feasibility Analysis

    3.11. Key Success Factors

    3.12. Industry Value and Supply Chain Analysis

        3.12.1. Value Added at Each Node of Supply Chain

        3.12.2. Gross Profitability Margins (at Every Level)

        3.12.3. List of Key Participants

            3.12.3.1. Component Suppliers

            3.12.3.2. Manufacturers

            3.12.3.3. Mid-Level Participants

            3.12.3.4. End Users (Prominent)

    3.13. Forecast and Macro-economic Factors - Relevance and Impact

4. Global Demand (Units) Analysis and Forecast

    4.1. Historical Market Volume (Units) Analysis, 2018 to 2022

    4.2. Current and Future Market Volume (Units) Projections, 2023 to 2033

    4.3. Y-o-Y Volume Growth Trend Analysis

5. Global Market - Pricing Analysis

    5.1. Product Category and Country-Level Pricing Analysis

    5.2. Global Average Pricing Analysis Benchmark

    5.3. Factors Influencing Pricing

6. Global Market Value (US$ Million) Analysis and Forecast

    6.1. Historical Market Value (US$ Million) Analysis, 2018 to 2022

    6.2. Current and Future Market Value (US$ Million) Projections, 2023 to 2033

        6.2.1. Y-o-Y Growth Trend Analysis

        6.2.2. Absolute $ Opportunity Analysis

7. Global Market Analysis and Forecast, By Door Type

    7.1. Introduction / Key Findings

    7.2. Historical Market Size (US$ Million) and Volume (Units) Analysis By Door Type, 2018 to 2022

    7.3. Current and Future Market Size (US$ Million) Analysis and Volume (Units) Forecast By Door Type, 2023 to 2033

        7.3.1. Single Door

        7.3.2. Double Door

    7.4. Market Attractiveness Analysis Type

8. Global Market Analysis and Forecast, By Capacity

    8.1. Introduction / Key Findings

    8.2. Historical Market Size (US$ Million) and Volume (Units) Analysis By Capacity, 2018 to 2022

    8.3. Current and Future Market Size (US$ Million) Analysis and Volume (Units) Forecast By Capacity, 2023 to 2033

            8.3.1.1. 4 Trays

            8.3.1.2. 6 Trays

            8.3.1.3. 8 Trays

            8.3.1.4. 12 Trays

            8.3.1.5. 24 Trays

            8.3.1.6. Other Combinations

    8.4. Market Attractiveness Analysis By Capacity

9. Global Market Analysis and Forecast, By Mount Type

    9.1. Introduction / Key Findings

    9.2. Historical Market Size (US$ Million) and Volume (Units) Analysis By Mount Type, 2018 to 2022

    9.3. Current and Future Market Size (US$ Million) Analysis and Volume (Units) Forecast By Mount Type, 2023 to 2033

        9.3.1. Countertop

        9.3.2. Freestanding

    9.4. Market Attractiveness Analysis By Mount Type

10. Global Market Analysis and Forecast, By End User

    10.1. Introduction / Key Findings

    10.2. Historical Market Size (US$ Million) and Volume (Units) Analysis By End User, 2018 to 2022

    10.3. Current and Future Market Size (US$ Million) Analysis and Volume (Units) Forecast By End User, 2023 to 2033

        10.3.1. Commercial Sector

        10.3.2. Residential Sector

    10.4. Market Attractiveness Analysis By End User

11. Global Market Analysis and Forecast, By Sales Channel

    11.1. Introduction / Key Findings

    11.2. Historical Market Size (US$ Million) and Volume (Units) Analysis By Sales Channel, 2018 to 2022

    11.3. Current and Future Market Size (US$ Million) Analysis and Volume (Units) Forecast By Sales Channel, 2023 to 2033

        11.3.1. Offline

        11.3.2. Online

    11.4. Market Attractiveness Analysis By Sales Channel

12. Global Market Analysis and Forecast, by Region

    12.1. Introduction

    12.2. Historical Market Size (US$ Million) and Volume (Units) Analysis By Region, 2018 to 2022

    12.3. Current Market Size (US$ Million) Analysis and Volume (Units) Forecast By Region, 2023 to 2033

        12.3.1. North America

        12.3.2. Latin America

        12.3.3. Europe

        12.3.4. East Asia

        12.3.5. South Asia & Oceania

        12.3.6. Middle East & Africa

    12.4. Market Attractiveness Analysis By Region

13. North America Market Analysis and Forecast

    13.1. Introduction / Key Findings

    13.2. Pricing Analysis

    13.3. Historical Market Size (US$ Million) and Volume (Units) Trend Analysis By Market Taxonomy, 2018 to 2022

    13.4. Market Size (US$ Million) and Volume (Units) Forecast By Market Taxonomy, 2023 to 2033

        13.4.1. By Country

            13.4.1.1. United States of America

            13.4.1.2. Canada

        13.4.2. By Door Type

        13.4.3. By Capacity

        13.4.4. By Mount Type

        13.4.5. By End User

        13.4.6. By Sales Channel

    13.5. Market Attractiveness Analysis

        13.5.1. By Country

        13.5.2. By Door Type

        13.5.3. By Capacity

        13.5.4. By Mount Type

        13.5.5. By End User

        13.5.6. By Sales Channel

14. Latin America Market Analysis and Forecast

    14.1. Introduction / Key Findings

    14.2. Pricing Analysis

    14.3. Historical Market Size (US$ Million) and Volume (Units) Trend Analysis By Market Taxonomy, 2018 to 2022

    14.4. Market Size (US$ Million) and Volume (Units) Forecast By Market Taxonomy, 2023 to 2033

        14.4.1. By Country

            14.4.1.1. Brazil

            14.4.1.2. Mexico

            14.4.1.3. Argentina

            14.4.1.4. Rest of Latin America

        14.4.2. By Door Type

        14.4.3. By Capacity

        14.4.4. By Mount Type

        14.4.5. By End User

        14.4.6. By Sales Channel

    14.5. Market Attractiveness Analysis

        14.5.1. By Country

        14.5.2. By Door Type

        14.5.3. By Capacity

        14.5.4. By Mount Type

        14.5.5. By End User

        14.5.6. By Sales Channel

15. Europe Market Analysis and Forecast

    15.1. Introduction / Key Findings

    15.2. Pricing Analysis

    15.3. Historical Market Size (US$ Million) and Volume (Units) Trend Analysis By Market Taxonomy, 2018 to 2022

    15.4. Market Size (US$ Million) and Volume (Units) Forecast By Market Taxonomy, 2023 to 2033

        15.4.1. By Country

            15.4.1.1. Germany

            15.4.1.2. Italy

            15.4.1.3. France

            15.4.1.4. United Kingdom

            15.4.1.5. Spain

            15.4.1.6. BENELUX

            15.4.1.7. Russia

            15.4.1.8. Rest of Europe

        15.4.2. By Door Type

        15.4.3. By Capacity

        15.4.4. By Mount Type

        15.4.5. By End User

        15.4.6. By Sales Channel

    15.5. Market Attractiveness Analysis

        15.5.1. By Country

        15.5.2. By Door Type

        15.5.3. By Capacity

        15.5.4. By Mount Type

        15.5.5. By End User

        15.5.6. By Sales Channel

16. East Asia Market Analysis and Forecast

    16.1. Introduction / Key Findings

    16.2. Pricing Analysis

    16.3. Historical Market Size (US$ Million) and Volume (Units) Trend Analysis By Market Taxonomy, 2018 to 2022

    16.4. Market Size (US$ Million) and Volume (Units) Forecast By Market Taxonomy, 2023 to 2033

        16.4.1. By Country

            16.4.1.1. China

            16.4.1.2. Japan

            16.4.1.3. South Korea

        16.4.2. By Door Type

        16.4.3. By Capacity

        16.4.4. By Mount Type

        16.4.5. By End User

        16.4.6. By Sales Channel

    16.5. Market Attractiveness Analysis

        16.5.1. By Country

        16.5.2. By Door Type

        16.5.3. By Capacity

        16.5.4. By Mount Type

        16.5.5. By End User

        16.5.6. By Sales Channel

17. South Asia & Oceania Market Analysis and Forecast

    17.1. Introduction / Key Findings

    17.2. Pricing Analysis

    17.3. Historical Market Size (US$ Million) and Volume (Units) Trend Analysis By Market Taxonomy, 2018 to 2022

    17.4. Market Size (US$ Million) and Volume (Units) Forecast By Market Taxonomy, 2023 to 2033

        17.4.1. By Country

            17.4.1.1. India

            17.4.1.2. Thailand

            17.4.1.3. Indonesia

            17.4.1.4. Malaysia

            17.4.1.5. Australia & New Zealand

            17.4.1.6. Rest of South Asia & Oceania

        17.4.2. By Door Type

        17.4.3. By Capacity

        17.4.4. By Mount Type

        17.4.5. By End User

        17.4.6. By Sales Channel

    17.5. Market Attractiveness Analysis

        17.5.1. By Country

        17.5.2. By Door Type

        17.5.3. By Capacity

        17.5.4. By Mount Type

        17.5.5. By End User

        17.5.6. By Sales Channel

18. Middle East & Africa Market Analysis and Forecast

    18.1. Introduction / Key Findings

    18.2. Pricing Analysis

    18.3. Historical Market Size (US$ Million) and Volume (Units) Trend Analysis By Market Taxonomy, 2018 to 2022

    18.4. Market Size (US$ Million) and Volume (Units) Forecast By Market Taxonomy, 2023 to 2033

        18.4.1. By Country

            18.4.1.1. GCC Countries

            18.4.1.2. Turkey

            18.4.1.3. Northern Africa

            18.4.1.4. South Africa

            18.4.1.5. Rest of Middle East and Africa

        18.4.2. By Door Type

        18.4.3. By Capacity

        18.4.4. By Mount Type

        18.4.5. By End User

        18.4.6. By Sales Channel

    18.5. Market Attractiveness Analysis

        18.5.1. By Country

        18.5.2. By Door Type

        18.5.3. By Capacity

        18.5.4. By Mount Type

        18.5.5. By End User

        18.5.6. By Sales Channel

19. Country-level Market Analysis and Forecast

    19.1. Introduction / Key Findings

        19.1.1. Market Value Proportion Analysis, By Key Countries

        19.1.2. Global Vs. Country Growth Comparison

    19.2. US Market Analysis

        19.2.1. Value Proportion Analysis by Market Taxonomy

        19.2.2. Volume (Units) and Value (US$ Million) Analysis and Forecast by Market Taxonomy, 2018 to 2033

            19.2.2.1. By Door Type

            19.2.2.2. By Capacity

            19.2.2.3. By Mount Type

            19.2.2.4. By End User

            19.2.2.5. By Sales Channel

    19.3. Canada Market Analysis

        19.3.1. Value Proportion Analysis by Market Taxonomy

        19.3.2. Volume (Units) and Value (US$ Million) Analysis and Forecast by Market Taxonomy, 2018 to 2033

            19.3.2.1. By Door Type

            19.3.2.2. By Capacity

            19.3.2.3. By Mount Type

            19.3.2.4. By End User

            19.3.2.5. By Sales Channel

    19.4. Brazil Market Analysis

        19.4.1. Value Proportion Analysis by Market Taxonomy

        19.4.2. Volume (Units) and Value (US$ Million) Analysis and Forecast by Market Taxonomy, 2018 to 2033

            19.4.2.1. By Door Type

            19.4.2.2. By Capacity

            19.4.2.3. By Mount Type

            19.4.2.4. By End User

            19.4.2.5. By Sales Channel

    19.5. Mexico Market Analysis

        19.5.1. Value Proportion Analysis by Market Taxonomy

        19.5.2. Volume (Units) and Value (US$ Million) Analysis and Forecast by Market Taxonomy, 2018 to 2033

            19.5.2.1. By Door Type

            19.5.2.2. By Capacity

            19.5.2.3. By Mount Type

            19.5.2.4. By End User

            19.5.2.5. By Sales Channel

    19.6. Argentina Market Analysis

        19.6.1. Value Proportion Analysis by Market Taxonomy

        19.6.2. Volume (Units) and Value (US$ Million) Analysis and Forecast by Market Taxonomy, 2018 to 2033

            19.6.2.1. By Door Type

            19.6.2.2. By Capacity

            19.6.2.3. By Mount Type

            19.6.2.4. By End User

            19.6.2.5. By Sales Channel

    19.7. Germany Market Analysis

        19.7.1. Value Proportion Analysis by Market Taxonomy

        19.7.2. Volume (Units) and Value (US$ Million) Analysis and Forecast by Market Taxonomy, 2018 to 2033

            19.7.2.1. By Door Type

            19.7.2.2. By Capacity

            19.7.2.3. By Mount Type

            19.7.2.4. By End User

            19.7.2.5. By Sales Channel

    19.8. France Market Analysis

        19.8.1. Value Proportion Analysis by Market Taxonomy

        19.8.2. Volume (Units) and Value (US$ Million) Analysis and Forecast by Market Taxonomy, 2018 to 2033

            19.8.2.1. By Door Type

            19.8.2.2. By Capacity

            19.8.2.3. By Mount Type

            19.8.2.4. By End User

            19.8.2.5. By Sales Channel

    19.9. Italy Market Analysis

        19.9.1. Value Proportion Analysis by Market Taxonomy

        19.9.2. Volume (Units) and Value (US$ Million) Analysis and Forecast by Market Taxonomy, 2018 to 2033

            19.9.2.1. By Door Type

            19.9.2.2. By Capacity

            19.9.2.3. By Mount Type

            19.9.2.4. By End User

            19.9.2.5. By Sales Channel

    19.10. Spain Market Analysis

        19.10.1. Value Proportion Analysis by Market Taxonomy

        19.10.2. Volume (Units) and Value (US$ Million) Analysis and Forecast by Market Taxonomy, 2018 to 2033

            19.10.2.1. By Door Type

            19.10.2.2. By Capacity

            19.10.2.3. By Mount Type

            19.10.2.4. By End User

            19.10.2.5. By Sales Channel

    19.11. BENELUX Market Analysis

        19.11.1. Value Proportion Analysis by Market Taxonomy

        19.11.2. Volume (Units) and Value (US$ Million) Analysis and Forecast by Market Taxonomy, 2018 to 2033

            19.11.2.1. By Door Type

            19.11.2.2. By Capacity

            19.11.2.3. By Mount Type

            19.11.2.4. By End User

            19.11.2.5. By Sales Channel

    19.12. Russia Market Analysis

        19.12.1. Value Proportion Analysis by Market Taxonomy

        19.12.2. Volume (Units) and Value (US$ Million) Analysis and Forecast by Market Taxonomy, 2018 to 2033

            19.12.2.1. By Door Type

            19.12.2.2. By Capacity

            19.12.2.3. By Mount Type

            19.12.2.4. By End User

            19.12.2.5. By Sales Channel

    19.13. United Kingdom Market Analysis

        19.13.1. Value Proportion Analysis by Market Taxonomy

        19.13.2. Volume (Units) and Value (US$ Million) Analysis and Forecast by Market Taxonomy, 2018 to 2033

            19.13.2.1. By Door Type

            19.13.2.2. By Capacity

            19.13.2.3. By Mount Type

            19.13.2.4. By End User

            19.13.2.5. By Sales Channel

    19.14. China Market Analysis

        19.14.1. Value Proportion Analysis by Market Taxonomy

        19.14.2. Volume (Units) and Value (US$ Million) Analysis and Forecast by Market Taxonomy, 2018 to 2033

            19.14.2.1. By Door Type

            19.14.2.2. By Capacity

            19.14.2.3. By Mount Type

            19.14.2.4. By End User

            19.14.2.5. By Sales Channel

    19.15. Japan Market Analysis

        19.15.1. Value Proportion Analysis by Market Taxonomy

        19.15.2. Volume (Units) and Value (US$ Million) Analysis and Forecast by Market Taxonomy, 2018 to 2033

            19.15.2.1. By Door Type

            19.15.2.2. By Capacity

            19.15.2.3. By Mount Type

            19.15.2.4. By End User

            19.15.2.5. By Sales Channel

    19.16. South Korea Market Analysis

        19.16.1. Value Proportion Analysis by Market Taxonomy

        19.16.2. Volume (Units) and Value (US$ Million) Analysis and Forecast by Market Taxonomy, 2018 to 2033

            19.16.2.1. By Door Type

            19.16.2.2. By Capacity

            19.16.2.3. By Mount Type

            19.16.2.4. By End User

            19.16.2.5. By Sales Channel

    19.17. India Market Analysis

        19.17.1. Value Proportion Analysis by Market Taxonomy

        19.17.2. Volume (Units) and Value (US$ Million) Analysis and Forecast by Market Taxonomy, 2018 to 2033

            19.17.2.1. By Door Type

            19.17.2.2. By Capacity

            19.17.2.3. By Mount Type

            19.17.2.4. By End User

            19.17.2.5. By Sales Channel

    19.18. ASEAN Countries Market Analysis

        19.18.1. Value Proportion Analysis by Market Taxonomy

        19.18.2. Volume (Units) and Value (US$ Million) Analysis and Forecast by Market Taxonomy, 2018 to 2033

            19.18.2.1. By Door Type

            19.18.2.2. By Capacity

            19.18.2.3. By Mount Type

            19.18.2.4. By End User

            19.18.2.5. By Sales Channel

    19.19. Australia Market Analysis

        19.19.1. Value Proportion Analysis by Market Taxonomy

        19.19.2. Volume (Units) and Value (US$ Million) Analysis and Forecast by Market Taxonomy, 2018 to 2033

            19.19.2.1. By Door Type

            19.19.2.2. By Capacity

            19.19.2.3. By Mount Type

            19.19.2.4. By End User

            19.19.2.5. By Sales Channel

    19.20. GCC Countries Market Analysis

        19.20.1. Value Proportion Analysis by Market Taxonomy

        19.20.2. Volume (Units) and Value (US$ Million) Analysis and Forecast by Market Taxonomy, 2018 to 2033

            19.20.2.1. By Door Type

            19.20.2.2. By Capacity

            19.20.2.3. By Mount Type

            19.20.2.4. By End User

            19.20.2.5. By Sales Channel

    19.21. Turkey Market Analysis

        19.21.1. Value Proportion Analysis by Market Taxonomy

        19.21.2. Volume (Units) and Value (US$ Million) Analysis and Forecast by Market Taxonomy, 2018 to 2033

            19.21.2.1. By Door Type

            19.21.2.2. By Capacity

            19.21.2.3. By Mount Type

            19.21.2.4. By End User

            19.21.2.5. By Sales Channel

    19.22. South Africa Market Analysis

        19.22.1. Value Proportion Analysis by Market Taxonomy

        19.22.2. Volume (Units) and Value (US$ Million) Analysis and Forecast by Market Taxonomy, 2018 to 2033

            19.22.2.1. By Door Type

            19.22.2.2. By Capacity

            19.22.2.3. By Mount Type

            19.22.2.4. By End User

            19.22.2.5. By Sales Channel

20. Market Structure Analysis

    20.1. Market Analysis by Tier of Companies

    20.2. Market Concentration of Players

    20.3. Market Share Analysis of Top Players

    20.4. Market Presence Analysis

21. Competition Analysis

    21.1. Competition Dashboard

    21.2. Competition Benchmarking of Products

    21.3. Competition Deep Dive

        21.3.1. Alto-Shaam

            21.3.1.1. Overview

            21.3.1.2. Product Portfolio

            21.3.1.3. Key Financials

            21.3.1.4. Sales Footprint

            21.3.1.5. SWOT Analysis

            21.3.1.6. Key Developments

            21.3.1.7. Strategy Overview

        21.3.2. Bakers Pride

            21.3.2.1. Overview

            21.3.2.2. Product Portfolio

            21.3.2.3. Key Financials

            21.3.2.4. Sales Footprint

            21.3.2.5. SWOT Analysis

            21.3.2.6. Key Developments

            21.3.2.7. Strategy Overview

        21.3.3. BKI

            21.3.3.1. Overview

            21.3.3.2. Product Portfolio

            21.3.3.3. Key Financials

            21.3.3.4. Sales Footprint

            21.3.3.5. SWOT Analysis

            21.3.3.6. Key Developments

            21.3.3.7. Strategy Overview

        21.3.4. Cadco

            21.3.4.1. Overview

            21.3.4.2. Product Portfolio

            21.3.4.3. Key Financials

            21.3.4.4. Sales Footprint

            21.3.4.5. SWOT Analysis

            21.3.4.6. Key Developments

            21.3.4.7. Strategy Overview

        21.3.5. Duke Manufacturing

            21.3.5.1. Overview

            21.3.5.2. Product Portfolio

            21.3.5.3. Key Financials

            21.3.5.4. Sales Footprint

            21.3.5.5. SWOT Analysis

            21.3.5.6. Key Developments

            21.3.5.7. Strategy Overview

        21.3.6. Garland Group

            21.3.6.1. Overview

            21.3.6.2. Product Portfolio

            21.3.6.3. Key Financials

            21.3.6.4. Sales Footprint

            21.3.6.5. SWOT Analysis

            21.3.6.6. Key Developments

            21.3.6.7. Strategy Overview

        21.3.7. Hobart

            21.3.7.1. Overview

            21.3.7.2. Product Portfolio

            21.3.7.3. Key Financials

            21.3.7.4. Sales Footprint

            21.3.7.5. SWOT Analysis

            21.3.7.6. Key Developments

            21.3.7.7. Strategy Overview

        21.3.8. Imperial Commercial Cooking Equipment

            21.3.8.1. Overview

            21.3.8.2. Product Portfolio

            21.3.8.3. Key Financials

            21.3.8.4. Sales Footprint

            21.3.8.5. SWOT Analysis

            21.3.8.6. Key Developments

            21.3.8.7. Strategy Overview

        21.3.9. Lang World

            21.3.9.1. Overview

            21.3.9.2. Product Portfolio

            21.3.9.3. Key Financials

            21.3.9.4. Sales Footprint

            21.3.9.5. SWOT Analysis

            21.3.9.6. Key Developments

            21.3.9.7. Strategy Overview

        21.3.10. Montague

            21.3.10.1. Overview

            21.3.10.2. Product Portfolio

            21.3.10.3. Key Financials

            21.3.10.4. Sales Footprint

            21.3.10.5. SWOT Analysis

            21.3.10.6. Key Developments

            21.3.10.7. Strategy Overview

        21.3.11. Star Manufacturing International

            21.3.11.1. Overview

            21.3.11.2. Product Portfolio

            21.3.11.3. Key Financials

            21.3.11.4. Sales Footprint

            21.3.11.5. SWOT Analysis

            21.3.11.6. Key Developments

            21.3.11.7. Strategy Overview

        21.3.12. Toastmaster

            21.3.12.1. Overview

            21.3.12.2. Product Portfolio

            21.3.12.3. Key Financials

            21.3.12.4. Sales Footprint

            21.3.12.5. SWOT Analysis

            21.3.12.6. Key Developments

            21.3.12.7. Strategy Overview

        21.3.13. TurboChef Technologies

            21.3.13.1. Overview

            21.3.13.2. Product Portfolio

            21.3.13.3. Key Financials

            21.3.13.4. Sales Footprint

            21.3.13.5. SWOT Analysis

            21.3.13.6. Key Developments

            21.3.13.7. Strategy Overview

        21.3.14. Vulcan

            21.3.14.1. Overview

            21.3.14.2. Product Portfolio

            21.3.14.3. Key Financials

            21.3.14.4. Sales Footprint

            21.3.14.5. SWOT Analysis

            21.3.14.6. Key Developments

            21.3.14.7. Strategy Overview

        21.3.15. Other Prominent Players

            21.3.15.1. Overview

            21.3.15.2. Product Portfolio

            21.3.15.3. Key Financials

            21.3.15.4. Sales Footprint

            21.3.15.5. SWOT Analysis

            21.3.15.6. Key Developments

            21.3.15.7. Strategy Overview

22. Assumptions & Acronyms Used

23. Research Methodology

List of Tables

Table 1: Global Market Value (US$ Million) Analysis, By Door Type, 2018  to 2022

Table 2: Global Market Value (US$ Million) Analysis, By Door Type, 2023  to 2033

Table 3: Global Market Value (US$ Million) Analysis, By Capacity, 2018  to 2022

Table 4: Global Market Value (US$ Million) Analysis, By Capacity, 2023  to 2033

Table 5: Global Market Value (US$ Million) Analysis, by Mount Type, 2018  to 2022

Table 6: Global Market Value (US$ Million) Analysis, by Mount Type, 2023  to 2033

Table 7: Global Market Value (US$ Million) Analysis, by End User, 2018  to 2022

Table 8: Global Market Value (US$ Million) Analysis, by End User, 2023  to 2033

Table 9: Global Market Value (US$ Million) Analysis, by Sales Channel, 2018  to 2022

Table 10: Global Market Value (US$ Million) Analysis, by Sales Channel, 2023  to 2033

Table 11: Global Market Value (US$ Million) Analysis, by Region, 2018  to 2022

Table 12: Global Market Value (US$ Million) Analysis, by Region, 2023  to 2033

Table 13: North America Market Value (US$ Million) Analysis, By Door Type, 2018  to 2022

Table 14: North America Market Value (US$ Million) Analysis, By Door Type, 2023  to 2033

Table 15: North America Market Value (US$ Million) Analysis, By Capacity, 2018  to 2022

Table 16: North America Market Value (US$ Million) Analysis, By Capacity, 2023  to 2033

Table 17: North America Market Value (US$ Million) Analysis, by Capacity, 2018  to 2022

Table 18: North America Market Value (US$ Million) Analysis, by Capacity, 2023  to 2033

Table 19: North America Market Value (US$ Million) Analysis, by Mount Type, 2018  to 2022

Table 20: North America Market Value (US$ Million) Analysis, by Mount Type, 2023  to 2033

Table 21: North America Market Value (US$ Million) Analysis, by Sales Channel, 2018  to 2022

Table 22: North America Market Value (US$ Million) Analysis, by Sales Channel, 2023  to 2033

Table 23: North America Market Value (US$ Million) Analysis, by Region, 2018  to 2022

Table 24: North America Market Value (US$ Million) Analysis, by Region, 2023  to 2033

Table 25: Latin America Market Value (US$ Million) Analysis, By Door Type, 2018  to 2022

Table 26: Latin America Market Value (US$ Million) Analysis, By Door Type, 2023  to 2033

Table 27: Latin America Market Value (US$ Million) Analysis, By Capacity, 2018  to 2022

Table 28: Latin America Market Value (US$ Million) Analysis, By Capacity, 2023  to 2033

Table 29: Latin America Market Value (US$ Million) Analysis, by Capacity, 2018  to 2022

Table 30: Latin America Market Value (US$ Million) Analysis, by Capacity, 2023  to 2033

Table 31: Latin America Market Value (US$ Million) Analysis, by Mount Type, 2018  to 2022

Table 32: Latin America Market Value (US$ Million) Analysis, by Mount Type, 2023  to 2033

Table 33: Latin America Market Value (US$ Million) Analysis, by Sales Channel, 2018  to 2022

Table 34: Latin America Market Value (US$ Million) Analysis, by Sales Channel, 2023  to 2033

Table 35: Latin America Market Value (US$ Million) Analysis, by Region, 2018  to 2022

Table 36: Latin America Market Value (US$ Million) Analysis, by Region, 2023  to 2033

Table 37: Europe Market Value (US$ Million) Analysis, By Door Type, 2018  to 2022

Table 38: Europe Market Value (US$ Million) Analysis, By Door Type, 2023  to 2033

Table 39: Europe Market Value (US$ Million) Analysis, By Capacity, 2018  to 2022

Table 40: Europe Market Value (US$ Million) Analysis, By Capacity, 2023  to 2033

Table 41: Europe Market Value (US$ Million) Analysis, by Capacity, 2018  to 2022

Table 42: Europe Market Value (US$ Million) Analysis, by Capacity, 2023  to 2033

Table 43: Europe Market Value (US$ Million) Analysis, by Mount Type, 2018  to 2022

Table 44: Europe Market Value (US$ Million) Analysis, by Mount Type, 2023  to 2033

Table 45: Europe Market Value (US$ Million) Analysis, by Sales Channel, 2018  to 2022

Table 46: Europe Market Value (US$ Million) Analysis, by Sales Channel, 2023  to 2033

Table 47: Europe Market Value (US$ Million) Analysis, by Region, 2018  to 2022

Table 48: Europe Market Value (US$ Million) Analysis, by Region, 2023  to 2033

Table 49: East Asia Market Value (US$ Million) Analysis, By Door Type, 2018  to 2022

Table 50: East Asia Market Value (US$ Million) Analysis, By Door Type, 2023  to 2033

Table 51: East Asia Market Value (US$ Million) Analysis, By Capacity, 2018  to 2022

Table 52: East Asia Market Value (US$ Million) Analysis, By Capacity, 2023  to 2033

Table 53: East Asia Market Value (US$ Million) Analysis, by Capacity, 2018  to 2022

Table 54: East Asia Market Value (US$ Million) Analysis, by Capacity, 2023  to 2033

Table 55: East Asia Market Value (US$ Million) Analysis, by Mount Type, 2018  to 2022

Table 56: East Asia Market Value (US$ Million) Analysis, by Mount Type, 2023  to 2033

Table 57: East Asia Market Value (US$ Million) Analysis, by Sales Channel, 2018  to 2022

Table 58: East Asia Market Value (US$ Million) Analysis, by Sales Channel, 2023  to 2033

Table 59: East Asia Market Value (US$ Million) Analysis, by Region, 2018  to 2022

Table 60: East Asia Market Value (US$ Million) Analysis, by Region, 2023  to 2033

Table 61: South Asia & Oceania Market Value (US$ Million) Analysis, By Door Type, 2018  to 2022

Table 62: South Asia & Oceania Market Value (US$ Million) Analysis, By Door Type, 2023  to 2033

Table 63: South Asia & Oceania Market Value (US$ Million) Analysis, By Capacity, 2018  to 2022

Table 64: South Asia & Oceania Market Value (US$ Million) Analysis, By Capacity, 2023  to 2033

Table 65: South Asia & Oceania Market Value (US$ Million) Analysis, by Capacity, 2018  to 2022

Table 66: South Asia & Oceania Market Value (US$ Million) Analysis, by Capacity, 2023  to 2033

Table 67: South Asia & Oceania Market Value (US$ Million) Analysis, by Mount Type, 2018  to 2022

Table 68: South Asia & Oceania Market Value (US$ Million) Analysis, by Mount Type, 2023  to 2033

Table 69: South Asia & Oceania Market Value (US$ Million) Analysis, by Sales Channel, 2018  to 2022

Table 70: South Asia & Oceania Market Value (US$ Million) Analysis, by Sales Channel, 2023  to 2033

Table 71: South Asia & Oceania Market Value (US$ Million) Analysis, by Region, 2018  to 2022

Table 72: South Asia & Oceania Market Value (US$ Million) Analysis, by Region, 2023  to 2033

Table 73: MEA Market Value (US$ Million) Analysis, By Door Type, 2018  to 2022

Table 74: MEA Market Value (US$ Million) Analysis, By Door Type, 2023  to 2033

Table 75: MEA Market Value (US$ Million) Analysis, By Capacity, 2018  to 2022

Table 76: MEA Market Value (US$ Million) Analysis, By Capacity, 2023  to 2033

Table 77: MEA Market Value (US$ Million) Analysis, by Capacity, 2018  to 2022

Table 78: MEA Market Value (US$ Million) Analysis, by Capacity, 2023  to 2033

Table 79: MEA Market Value (US$ Million) Analysis, by Mount Type, 2018  to 2022

Table 80: MEA Market Value (US$ Million) Analysis, by Mount Type, 2023  to 2033

Table 81: MEA Market Value (US$ Million) Analysis, by Sales Channel, 2018  to 2022

Table 82: MEA Market Value (US$ Million) Analysis, by Sales Channel, 2023  to 2033

Table 83: MEA Market Value (US$ Million) Analysis, by Region, 2018  to 2022

Table 84: MEA Market Value (US$ Million) Analysis, by Region, 2023  to 2033

List of Charts

Figure 1: Global Market Value (US$ Million) Historical Analysis, 2018 to 2022

Figure 2: Global Market Value (US$ Million) Forecast and Analysis, 2023 to 2033

Figure 3: Global Market Value Y-o-Y Growth and Forecast, 2019 to 2033

Figure 4: Global Market Incremental $ Opportunity, 2023 to 2033

Figure 5: Global Market Share and BPS Analysis by Door Type, 2023  to  2033

Figure 6: Global Market Y-o-Y Growth Projections by Door Type, 2023 to 2033

Figure 7: Global Market Attractiveness Analysis by Door Type, 2023 to 2033

Figure 8: Global Market Share and BPS Analysis by End User, 2023  to  2033

Figure 9: Global Market Y-o-Y Growth Projections by End User, 2023 to 2033

Figure 10: Global Market Attractiveness Analysis by End User, 2023 to 2033

Figure 11: Global Market Share and BPS Analysis by Sales Channel, 2023  to  2033

Figure 12: Global Market Y-o-Y Growth Projections by Sales Channel, 2023 to 2033

Figure 13: Global Market Attractiveness Analysis by Sales Channel, 2023 to 2033

Figure 14: Global Market Share and BPS Analysis by Region, 2023  to  2033

Figure 15: Global Market Y-o-Y Growth Projections by Region, 2023 to 2033

Figure 16: Global Market Attractiveness Analysis by Region, 2023 to 2033

Figure 17: North America Market Value (US$ Million) Historical Analysis, 2018 to 2022

Figure 18: North America Market Value (US$ Million) Forecast and Analysis, 2023 to 2033

Figure 19: North America Market Value Y-o-Y Growth and Forecast, 2019 to 2033

Figure 20: North America Market Incremental $ Opportunity, 2023 to 2033

Figure 21: North America Market Share Analysis by Country, 2023  to  2033

Figure 22: North America Market Y-o-Y Growth Projection by Country, 2023 to 2033

Figure 23: North America Market Attractiveness Analysis by Country, 2023 to 2033

Figure 24: North America Market Share and BPS Analysis by Door Type, 2023  to  2033

Figure 25: North America Market Y-o-Y Growth Projections by Door Type, 2023 to 2033

Figure 26: North America Market Attractiveness Analysis by Door Type, 2023 to 2033

Figure 27: North America Market Share and BPS Analysis by Capacity, 2023  to  2033

Figure 28: North America Market Y-o-Y Growth Projections by Capacity, 2023 to 2033

Figure 29: North America Market Attractiveness Analysis by Capacity, 2023 to 2033

Figure 30: North America Market Share and BPS Analysis by Mount Type, 2023  to  2033

Figure 31: North America Market Y-o-Y Growth Projections by Mount Type, 2023 to 2033

Figure 32: North America Market Attractiveness Analysis by Mount Type, 2023 to 2033

Figure 33: North America Market Share and BPS Analysis by End User, 2023  to  2033

Figure 34: North America Market Y-o-Y Growth Projections by End User, 2023 to 2033

Figure 35: North America Market Attractiveness Analysis by End User, 2023 to 2033

Figure 36: North America Market Share and BPS Analysis by Sales Channel, 2023  to  2033

Figure 37: North America Market Y-o-Y Growth Projections by Sales Channel, 2023 to 2033

Figure 38: North America Market Attractiveness Analysis by Sales Channel, 2023 to 2033

Figure 39: Latin America Market Value (US$ Million) Historical Analysis, 2018 to 2022

Figure 40: Latin America Market Value (US$ Million) Forecast and Analysis, 2023 to 2033

Figure 41: Latin America Market Value Y-o-Y Growth and Forecast, 2019 to 2033

Figure 42: Latin America Market Incremental $ Opportunity, 2023 to 2033

Figure 43: Latin America Market Share Analysis by Country, 2023  to  2033

Figure 44: Latin America Market Y-o-Y Growth Projection by Country, 2023 to 2033

Figure 45: Latin America Market Attractiveness Analysis by Country, 2023 to 2033

Figure 46: Latin America Market Share and BPS Analysis by Door Type, 2023  to  2033

Figure 47: Latin America Market Y-o-Y Growth Projections by Door Type, 2023 to 2033

Figure 48: Latin America Market Attractiveness Analysis by Door Type, 2023 to 2033

Figure 49: Latin America Market Share and BPS Analysis by Capacity, 2023  to  2033

Figure 50: Latin America Market Y-o-Y Growth Projections by Capacity, 2023 to 2033

Figure 51: Latin America Market Attractiveness Analysis by Capacity, 2023 to 2033

Figure 52: Latin America Market Share and BPS Analysis by Mount Type, 2023  to  2033

Figure 53: Latin America Market Y-o-Y Growth Projections by Mount Type, 2023 to 2033

Figure 54: Latin America Market Attractiveness Analysis by Mount Type, 2023 to 2033

Figure 55: Latin America Market Share and BPS Analysis by End User, 2023  to  2033

Figure 56: Latin America Market Y-o-Y Growth Projections by End User, 2023 to 2033

Figure 57: Latin America Market Attractiveness Analysis by End User, 2023 to 2033

Figure 58: Latin America Market Share and BPS Analysis by Sales Channel, 2023  to  2033

Figure 59: Latin America Market Y-o-Y Growth Projections by Sales Channel, 2023 to 2033

Figure 60: Latin America Market Attractiveness Analysis by Sales Channel, 2023 to 2033

Figure 61: Europe Market Value (US$ Million) Historical Analysis, 2018 to 2022

Figure 62: Europe Market Value (US$ Million) Forecast and Analysis, 2023 to 2033

Figure 63: Europe Market Value Y-o-Y Growth and Forecast, 2019 to 2033

Figure 64: Europe Market Incremental $ Opportunity, 2023 to 2033

Figure 65: Europe Market Share Analysis by Country, 2023  to  2033

Figure 66: Europe Market Y-o-Y Growth Projection by Country, 2023 to 2033

Figure 67: Europe Market Attractiveness Analysis by Country, 2023 to 2033

Figure 68: Europe Market Share and BPS Analysis by Door Type, 2023  to  2033

Figure 69: Europe Market Y-o-Y Growth Projections by Door Type, 2023 to 2033

Figure 70: Europe Market Attractiveness Analysis by Door Type, 2023 to 2033

Figure 71: Europe Market Share and BPS Analysis by Capacity, 2023  to  2033

Figure 72: Europe Market Y-o-Y Growth Projections by Capacity, 2023 to 2033

Figure 73: Europe Market Attractiveness Analysis by Capacity, 2023 to 2033

Figure 74: Europe Market Share and BPS Analysis by Mount Type, 2023  to  2033

Figure 75: Europe Market Y-o-Y Growth Projections by Mount Type, 2023 to 2033

Figure 76: Europe Market Attractiveness Analysis by Mount Type, 2023 to 2033

Figure 77: Europe Market Share and BPS Analysis by End User, 2023  to  2033

Figure 78: Europe Market Y-o-Y Growth Projections by End User, 2023 to 2033

Figure 79: Europe Market Attractiveness Analysis by End User, 2023 to 2033

Figure 80: Europe Market Share and BPS Analysis by Sales Channel, 2023  to  2033

Figure 81: Europe Market Y-o-Y Growth Projections by Sales Channel, 2023 to 2033

Figure 82: Europe Market Attractiveness Analysis by Sales Channel, 2023 to 2033

Figure 83: East Asia Market Value (US$ Million) Historical Analysis, 2018 to 2022

Figure 84: East Asia Market Value (US$ Million) Forecast and Analysis, 2023 to 2033

Figure 85: East Asia Market Value Y-o-Y Growth and Forecast, 2019 to 2033

Figure 86: East Asia Market Incremental $ Opportunity, 2023 to 2033

Figure 87: East Asia Market Share Analysis by Country, 2023  to  2033

Figure 88: East Asia Market Y-o-Y Growth Projection by Country, 2023 to 2033

Figure 89: East Asia Market Attractiveness Analysis by Country, 2023 to 2033

Figure 90: East Asia Market Share and BPS Analysis by Door Type, 2023  to  2033

Figure 91: East Asia Market Y-o-Y Growth Projections by Door Type, 2023 to 2033

Figure 92: East Asia Market Attractiveness Analysis by Door Type, 2023 to 2033

Figure 93: East Asia Market Share and BPS Analysis by Capacity, 2023  to  2033

Figure 94: East Asia Market Y-o-Y Growth Projections by Capacity, 2023 to 2033

Figure 95: East Asia Market Attractiveness Analysis by Capacity, 2023 to 2033

Figure 96: East Asia Market Share and BPS Analysis by Mount Type, 2023  to  2033

Figure 97: East Asia Market Y-o-Y Growth Projections by Mount Type, 2023 to 2033

Figure 98: East Asia Market Attractiveness Analysis by Mount Type, 2023 to 2033

Figure 99: East Asia Market Share and BPS Analysis by End User, 2023  to  2033

Figure 100: East Asia Market Y-o-Y Growth Projections by End User, 2023 to 2033

Figure 101: East Asia Market Attractiveness Analysis by End User, 2023 to 2033

Figure 102: East Asia Market Share and BPS Analysis by Sales Channel, 2023  to  2033

Figure 103: East Asia Market Y-o-Y Growth Projections by Sales Channel, 2023 to 2033

Figure 104: East Asia Market Attractiveness Analysis by Sales Channel, 2023 to 2033

Figure 105: South Asia & Oceania Market Value (US$ Million) Historical Analysis, 2018 to 2022

Figure 106: South Asia & Oceania Market Value (US$ Million) Forecast and Analysis, 2023 to 2033

Figure 107: South Asia & Oceania Market Value Y-o-Y Growth and Forecast, 2019 to 2033

Figure 108: South Asia & Oceania Market Incremental $ Opportunity, 2023 to 2033

Figure 109: South Asia & Oceania Market Share Analysis by Country, 2023  to  2033

Figure 110: South Asia & Oceania Market Y-o-Y Growth Projection by Country, 2023 to 2033

Figure 111: South Asia & Oceania Market Attractiveness Analysis by Country, 2023 to 2033

Figure 112: South Asia & Oceania Market Share and BPS Analysis by Door Type, 2023  to  2033

Figure 113: South Asia & Oceania Market Y-o-Y Growth Projections by Door Type, 2023 to 2033

Figure 114: South Asia & Oceania Market Attractiveness Analysis by Door Type, 2023 to 2033

Figure 115: South Asia & Oceania Market Share and BPS Analysis by Capacity, 2023  to  2033

Figure 116: South Asia & Oceania Market Y-o-Y Growth Projections by Capacity, 2023 to 2033

Figure 117: South Asia & Oceania Market Attractiveness Analysis by Capacity, 2023 to 2033

Figure 118: South Asia & Oceania Market Share and BPS Analysis by Mount Type, 2023  to  2033

Figure 119: South Asia & Oceania Market Y-o-Y Growth Projections by Mount Type, 2023 to 2033

Figure 120: South Asia & Oceania Market Attractiveness Analysis by Mount Type, 2023 to 2033

Figure 121: South Asia & Oceania Market Share and BPS Analysis by End User, 2023  to  2033

Figure 122: South Asia & Oceania Market Y-o-Y Growth Projections by End User, 2023 to 2033

Figure 123: South Asia & Oceania Market Attractiveness Analysis by End User, 2023 to 2033

Figure 124: South Asia & Oceania Market Share and BPS Analysis by Sales Channel, 2023  to  2033

Figure 125: South Asia & Oceania Market Y-o-Y Growth Projections by Sales Channel, 2023 to 2033

Figure 126: South Asia & Oceania Market Attractiveness Analysis by Sales Channel, 2023 to 2033

Figure 127: MEA Market Value (US$ Million) Historical Analysis, 2018 to 2022

Figure 128: MEA Market Value (US$ Million) Forecast and Analysis, 2023 to 2033

Figure 129: MEA Market Value Y-o-Y Growth and Forecast, 2019 to 2033

Figure 130: MEA Market Incremental $ Opportunity, 2023 to 2033

Figure 131: MEA Market Share Analysis by Country, 2023  to  2033

Figure 132: MEA Market Y-o-Y Growth Projection by Country, 2023 to 2033

Figure 133: MEA Market Attractiveness Analysis by Country, 2023 to 2033

Figure 134: MEA Market Share and BPS Analysis by Door Type, 2023  to  2033

Figure 135: MEA Market Y-o-Y Growth Projections by Door Type, 2023 to 2033

Figure 136: MEA Market Attractiveness Analysis by Door Type, 2023 to 2033

Figure 137: MEA Market Share and BPS Analysis by Capacity, 2023  to  2033

Figure 138: MEA Market Y-o-Y Growth Projections by Capacity, 2023 to 2033

Figure 139: MEA Market Attractiveness Analysis by Capacity, 2023 to 2033

Figure 140: MEA Market Share and BPS Analysis by Mount Type, 2023  to  2033

Figure 141: MEA Market Y-o-Y Growth Projections by Mount Type, 2023 to 2033

Figure 142: MEA Market Attractiveness Analysis by Mount Type, 2023 to 2033

Figure 143: MEA Market Share and BPS Analysis by End User, 2023  to  2033

Figure 144: MEA Market Y-o-Y Growth Projections by End User, 2023 to 2033

Figure 145: MEA Market Attractiveness Analysis by End User, 2023 to 2033

Figure 146: MEA Market Share and BPS Analysis by Sales Channel, 2023  to  2033

Figure 147: MEA Market Y-o-Y Growth Projections by Sales Channel, 2023 to 2033

Figure 148: MEA Market Attractiveness Analysis by Sales Channel, 2023 to 2033

Explore Process Automation Insights

View Reports

Gas Convection Oven Market