Gastric Space-Occupying Devices Market Outlook (2022 to 2032)

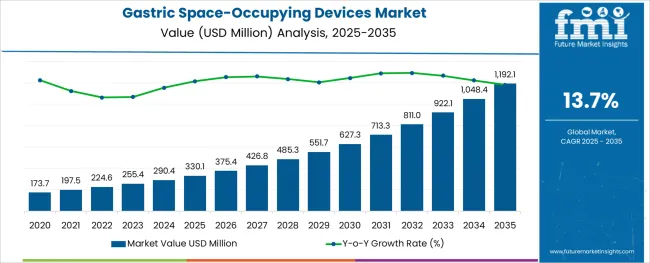
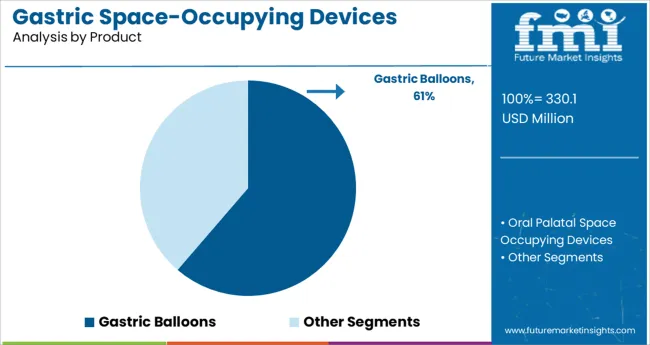
The global gastric space-occupying devices market was valued at USD 197.5 Million in 2021. As per the report, demand in the market will increase at an impressive 13.7% CAGR over the forecast period, with the market size reaching USD 810.8 Million by 2032. Gastric balloons are leading the market in terms of product with a market share of around 97.0% in 2021.

Attributes Key Statistics
Gastric Space-Occupying Devices Market Base Year Value (2021) USD 197.5 million
Estimated Market Size (2022) USD 224.6 million
Projected Market Valuation (2032) USD 810.8 million
Value-based CAGR (2022 to 2032) 13.7%
Market Share of Top 5 Countries 52.0%

Despite advancements in lifestyle interventions, obesity management pharmacotherapies and metabolic or bariatric surgery, the healthcare burden due to obesity continues to increase. Thus, endoscopic bariatric therapies (EBTs) are gaining traction as they are effective, safe, reversible, and economical. These therapies allow treatment of individuals that are unable to undergo bariatric surgery. Among the endoscopic modalities, the employment of a space-occupying device is one of the most ancient and effective therapies.

Considering the large market size of obesity treatment and the small percentage of patients treated with drugs or bariatric surgery, gastric space-occupying devices can play a major role in the management of obesity.

2017 to 2021 Gastric Space-Occupying Devices Market Historic Outlook Vs 2022 to 2032 Forecast

The market value for gastric space-occupying devices was approximately 5.5% of the overall USD 3.6 Billion worth weight loss management market in 2021. Sales of gastric space-occupying devices increased at a CAGR of 5.4% between 2017 to 2021, owing to high demand for minimally invasive surgeries for obesity management.

The global prevalence of obesity almost tripled between 1975 and 2020. In 2020, globally over 2 billion adults were overweight (body mass index (BMI) > 25) and more than 600 million were obese (BMI > 30). In Europe, nearly 50% of the population is overweight and more than 30% is obese.

Obesity, along with its obesity-related disorders such as diabetes, hypertension, non-alcoholic fatty liver disease, hyperlipidemia, and obstructive sleep apnea has become a global burden. If the incidence of obesity continues on its current trajectory, nearly half of the adult population will have obesity issues by 2030.

Although widely accessible for managing obesity, traditional therapeutic modalities including lifestyle change and dietary counselling are less effective. Contrarily, patients who have not improved after receiving more conventional medical care but prefer not to undergo surgery can consider anti-obesity medical devices.

Gastric space-occupying devices are positioned to bridge the gap between more conservative treatments and more aggressive interventions such as bariatric surgery. Gastric space-occupying device therapy is more advantageous when compared to bariatric surgery, as they are less invasive in nature, and promote ease of performance, and reversibility.

These devices are available upon prescription or as over-the-counter products. Thus, several advantages of these medical devices are expected to increase the demand for gastric space-occupying devices during the forecast period.

Owing to the rising prevalence of obesity and growing demand for minimally invasive surgical procedures in obesity treatment, demand in the global gastric space-occupying devices market is anticipated to grow at a CAGR of 13.7% during the forecast period.

What are the Key Opportunities for the Gastric Space-Occupying Devices Manufacturers?

Endoscopic bariatric therapies can be a sustainable treatment option for obesity management. Along with safety and efficacy of data, these therapies will be the most successful treatment in the next few years. Several researchers are focusing on the tandem and progressive use of a combination of space-occupying endoscopic devices and weight loss drug treatment to enhance the stability of weight loss with a long-lasting effect on obesity and associated diseases.

The global healthcare burden due to obesity accounts for around USD 2 trillion yearly or around 2.8% of GDP. This is approximately equal to the worldwide effect of smoking or armed violence, war, and terrorism (McKinsey Global Institute, 2014). The tax on obesity in healthcare systems alone is between 2% and 7% of all healthcare expenditures in developed countries. These figures indicate that obesity is considered one of the top 3 community problems.

To manage the obesity-related healthcare burden, governments are taking initiatives to create awareness among people which will create opportunities for key players to be actively involved in the development and launch of cost-effective solutions for obesity management.

Which Factors are Restraining Demand for Gastric Space-Occupying Devices?

The key challenges in the development of gastric space-occupying devices are the lack of specific regulatory guidance and inconsistencies in the time and cost of approval processes in different countries.

Awareness is also an obstacle in the adoption of gastric space-occupying devices. In the realm of weight-loss management, they are still relatively unknown to a large part of the population.

Additionally, increasing product recalls are also hampering growth to an extent. Several gastric space-occupying devices have been withdrawn by manufacturers from the market in the USA after approval by the FDA (e.g., ReShape integrated dual balloon system and Garren gastric bubble.

The use of gastric space-occupying devices is a relatively new technology for weight-loss treatment. Lack of reimbursement for such procedures in most countries can potentially hinder growth. Mostly, health insurance plans have fitness criteria of BMI of 35 or 45 for providing reimbursement for obesity management treatments. Though, patients are eligible for gastric space-occupying devices treatment at BMI 27 and are thus not reimbursed.

Furthermore, most countries treat gastric space-occupying devices as a primary procedure which is in the investigational stage. The therapy is not included in the reimbursement policies of Medicaid (CMC) and Medicare in the USA with a similar scenario existing in Australia, Canada, and other countries in Asia and Europe.
Country-wise Insights

What is the USA Gastric Space-Occupying Devices Market Outlook?

High Incidence of Obesity Related Disorders in USA is Spurring Demand for Gastric Space-Occupying Devices

The USA dominated the North America market in 2021, holding about 83.3% of the market share. As per the report, the trend is expected to continue over the assessment period increasing demand for minimally invasive surgeries for obesity management

In 2017, the American Society for Metabolic and Bariatric Surgery (ASMBS) included gastric space-occupying devices in the list of procedures and devices approved by the society as a treatment option. The sanction and endorsements of this treatment by the ASMBS are expected to increase the adoption of gastric space-occupying devices in the USA.

What is Driving the UK Gastric Space-Occupying Devices Market?

Rapid Adoption of Anti-Obesity Medica Devices in the UK Will Boost Sales

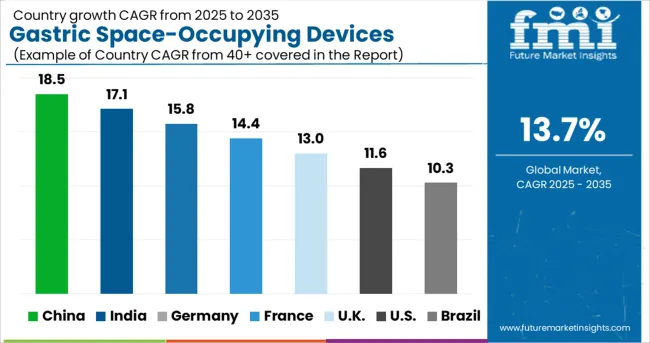
Demand in the UK market is set to increase at a CAGR of 12.5% in the Europe gastric space-occupying devices market during the forecast period.

Non-invasiveness often favoured by both clinicians and patients in the UK Similarly, innovation and techniques to challenge obesity are increasing in the country, and several key players are competing by innovating.

High adoption of obesity management treatments, and the availability of skilled professionals are some of the key factors contributing to the growth in the market.

What Makes the China Gastric Space-Occupying Devices Market Attractive?

Rising Preference for Minimally Invasive Surgeries in China Will Fuel Sales

Sales in the China market are expected to increase at a 14.4% CAGR over the assessment period.

In the past four years, the rates of obesity in China have rapidly increased, along with economic growth, urbanisation, and globalisation. According to the Chinese Residents Chronic Diseases and Nutrition report, in China over 50% of adults and 20% of school-age children were found to be obese in 2020. This figure indicates the need for obesity management and increased demand for EBT, which is ultimately fueling demand for gastric space-occupying devices.

Furthermore, several government initiatives to create awareness are also supplementing the growth in the market. For instane, The Obesity Prevention and Control Society of Chinese Nutrition Society (OPCS-CNS) has collaborated with other government bodies to carry out a series of activities to inspire individuals to pay attention to the obesity problem and take more practical actions.

Category-wise Insights

Which is the Most Popular Product in the Gastric Space-Occupying Devices Market?

Demand for Gastric Balloons Will Gain Momentum

Based on product type, sales of gastric balloons held the highest market share of about 97.0% in the market in 2021 and are expected to grow at a CAGR of 13.67% over the forecast period. Through endoscopy, gastric balloons are inserted into the body and offer weight loss of up to 7 to 8 pounds.

An average 7-pound weight loss is possible with the Orbera gastric balloon. The Obalon gastric balloon, on the other hand, offers an average of 7.4 pounds, or 3.42 percent of their total body weight.

Who is the Leading End User of Gastric Space-Occupying Devices Globally?

Adoption of Obesity Management Pharmacotherapies in Hospitals Will Remain High

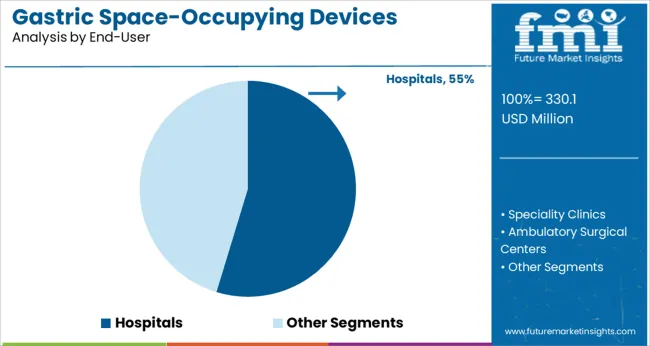
Hospitals held the highest share of 59.0% in 2021. Rising prevalence of obesity, along with growing healthcare investments across the globe, and government policies for the execution of superior patient care are driving sales in this segment.

Similarly, new clinical trials conducted in multi-speciality hospitals will provide opportunities to the patients to explore new experimental therapies, thus boosting demand.
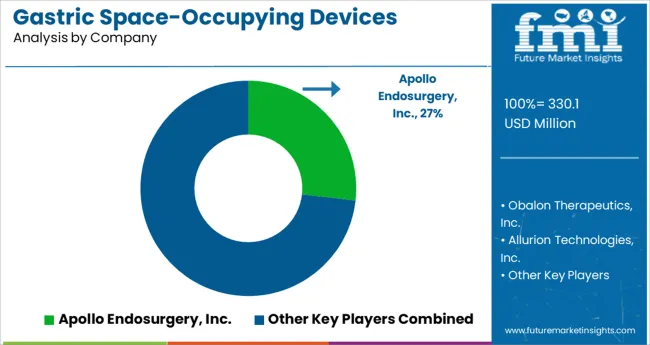
Competitive Landscape

The gastric space-occupying devices market is fairly consolidated and led by few market players. These players are focusing on product development and expansion strategies to gain traction in the market. For instance:

  • In July 2020, Allurion Technologies expanded business in Asia with the launch of the Elipse Program in Malaysia, Hong Kong, and Singapore. Along with its achievement in Europe, the Middle East, and Latin America, the company’s entry into the Asian region will influence the lives of more than 1 billion people who are overweight or obese in a region that previously had limited access to minimally invasive treatments for obesity management.

Report Scope

Attribute Details
Estimated Market Size (2022) US$ 224.6 million
Projected Market Valuation (2032) US$ 810.8 million
Value-based CAGR (2022 to 2032) 13.7%
Forecast Period 2017 to 2021
Historical Data Available for 2022 to 2032
Market Analysis US$ million for Value
Key Regions Covered North America; Latin America; Europe; South Asia; East Asia; Oceania; and Middle East & Africa
Key Countries Covered The USA, Canada, Brazil, Mexico, Argentina, the UK, Germany, Italy, Russia, Spain, France, BENELUX, India, Thailand, Indonesia, Malaysia, Japan, China, South Korea, Australia, New Zealand, Turkey, GCC, North Africa, and South Africa
Key Market Segments Covered Product, End User, and Region
Key Companies Profiled Apollo Endosurgery, Inc.; Obalon Therapeutics, Inc.; Allurion Technologies, Inc.; Helioscopie; Endalis; MEDSIL; ReShape Medical, Inc.; Lexel Medical; Scientific Intake

Key Market Segments Covered In Gastric Space-Occupying Devices Industry Research

By Product:

  • Gastric Balloons
  • Oral Palatal Space Occupying Devices

By End-User:

  • Hospitals
  • Speciality Clinics
  • Ambulatory Surgical Centers

By Region:

  • North America
  • Latin America
  • Europe
  • South Asia
  • East Asia
  • Oceania
  • The Middle East and Africa (MEA)

Table of Content

  • 1. Executive Summary
  • 2. Market Overview
  • 3. Key Market Trends
  • 4. Key Success Factors
  • 5. Market Background
  • 6. Global Market Demand (in Value or Size in USD Million) Analysis 2017 to 2021 and Forecast, 2022 to 2032
  • 7. Global Market Pricing Analysis
  • 8. Global Market Volume (Units) Analysis 2017 to 2021 and Forecast, 2022 to 2032
  • 9. Global Market Analysis 2017 to 2021 and Forecast 2022 to 2032, by Product
    • 9.1. Gastric Balloons
  • 10. Global Market Analysis 2017 to 2021 and Forecast 2022 to 2032, by End User
    • 10.1. Hospitals
    • 10.2. Specialty Clinics
    • 10.3. Ambulatory Surgical Centers
  • 11. Global Market Analysis 2017 to 2021 and Forecast 2022 to 2032, by Region
    • 11.1. North America
    • 11.2. Latin America
    • 11.3. Europe
    • 11.4. East Asia
    • 11.5. South Asia
    • 11.6. Oceania
    • 11.7. Middle East and Africa (MEA)
  • 12. North America Market Analysis 2017 to 2021 and Forecast 2022 to 2032
  • 13. Latin America Market Analysis 2017 to 2021 and Forecast 2022 to 2032
  • 14. Europe Market Analysis 2017 to 2021 and Forecast 2022 to 2032
  • 15. South Asia Market Analysis 2017 to 2021 and Forecast 2022 to 2032
  • 16. East Asia Market Analysis 2017 to 2021 and Forecast 2022 to 2032
  • 17. Oceania Market Analysis 2017 to 2021 and Forecast 2022 to 2032
  • 18. Middle East and Africa (MEA) Market Analysis 2017 to 2021 and Forecast 2022 to 2032
  • 19. Market Structure Analysis
  • 20. Competition Analysis
    • 20.1. Apollo Endosurgery, Inc.
    • 20.2. Obalon Therapeutics, Inc.
    • 20.3. Allurion Technologies, Inc.
    • 20.4. Helioscopie
    • 20.5. Endalis
    • 20.6. MEDSIL
    • 20.7. ReShape Medical, Inc.
    • 20.8. Lexel Medical
    • 20.9. Scientific Intake
  • 21. Assumptions and Acronyms Used
  • 22. Research Methodology

List of Tables

Table 01: Global Market Value (US$ Million) Analysis 2017 to 2021, By Product

Table 02: Global Market Value (US$ Million) Opportunity Assessment 2022 to 2032, By Product

Table 03: Global Market Volume (Units) Analysis 2017 to 2021, By Product

Table 04: Global Market Volume (Units) Opportunity Assessment 2022 to 2032, By Product

Table 05: Global Market Value (US$ Million) Analysis 2017 to 2021, By End User

Table 06: Global Market Value (US$ Million) Opportunity Assessment 2022 to 2032, By End User

Table 07: Global Market Value (US$ Million) Analysis 2017 to 2021, By Region

Table 08: Global Market Value (US$ Million) Opportunity Assessment 2022 to 2032, By Region

Table 09: North America Market Value (US$ Million) Analysis 2017 to 2021, By Country

Table 10: North America Market Value (US$ Million) Opportunity Assessment 2022 to 2032, By Country

Table 11: North America Market Value (US$ Million) Analysis 2017 to 2021, By Product

Table 12: North America Market Value (US$ Million) Opportunity Assessment 2022 to 2032, By Product

Table 13: North America Market Volume (Units) Analysis 2017 to 2021, By Product

Table 14: North America Market Volume (Units) Opportunity Assessment 2022 to 2032, By Product

Table 15: North America Market Value (US$ Million) Analysis 2017 to 2021, By End User

Table 16: North America Market Value (US$ Million) Opportunity Assessment 2022 to 2032, By End User

Table 17: Latin America Market Value (US$ Million) Analysis 2017 to 2021, By Country

Table 18: Latin America Market Value (US$ Million) Opportunity Assessment 2022 to 2032, By Country

Table 19: Latin America Market Value (US$ Million) Analysis 2017 to 2021, By Product

Table 20: Latin America Market Value (US$ Million) Opportunity Assessment 2022 to 2032, By Product

Table 21: Latin America Market Volume (Units) Analysis 2017 to 2021, By Product

Table 22: Latin America Market Volume (Units) Opportunity Assessment 2022 to 2032, By Product

Table 23: Latin America Market Value (US$ Million) Analysis 2017 to 2021, By End User

Table 24: Latin America Market Value (US$ Million) Opportunity Assessment 2022 to 2032, By End User

Table 25: Europe Market Value (US$ Million) Analysis 2017 to 2021, By Country

Table 26: Europe Market Value (US$ Million) Opportunity Assessment 2022 to 2032, By Country

Table 27: Europe Market Value (US$ Million) Analysis 2017 to 2021, By Product

Table 28: Europe Market Value (US$ Million) Opportunity Assessment 2022 to 2032, By Product

Table 29: Europe Market Volume (Units) Analysis 2017 to 2021, By Product

Table 30: Europe Market Volume (Units) Opportunity Assessment 2022 to 2032, By Product

Table 31: Europe Market Value (US$ Million) Analysis 2017 to 2021, By End User

Table 32: Europe Market Value (US$ Million) Opportunity Assessment 2022 to 2032, By End User

Table 33: South Asia Market Value (US$ Million) Analysis 2017 to 2021, By Country

Table 34: South Asia Market Value (US$ Million) Opportunity Assessment 2022 to 2032, By Country

Table 35: South Asia Market Value (US$ Million) Analysis 2017 to 2021, By Product

Table 36: South Asia Market Value (US$ Million) Opportunity Assessment 2022 to 2032, By Product

Table 37: South Asia Market Volume (Units) Analysis 2017 to 2021, By Product

Table 38: South Asia Market Volume (Units) Opportunity Assessment 2022 to 2032, By Product

Table 39: South Asia Market Value (US$ Million) Analysis 2017 to 2021, By End User

Table 40: South Asia Market Value (US$ Million) Opportunity Assessment 2022 to 2032, By End User

Table 41: East Asia Market Value (US$ Million) Analysis 2017 to 2021, By Country

Table 42: East Asia Market Value (US$ Million) Opportunity Assessment 2022 to 2032, By Country

Table 43: East Asia Market Value (US$ Million) Analysis 2017 to 2021, By Product

Table 44: East Asia Market Value (US$ Million) Opportunity Assessment 2022 to 2032, By Product

Table 45: East Asia Market Volume (Units) Analysis 2017 to 2021, By Product

Table 46: East Asia Market Volume (Units) Opportunity Assessment 2022 to 2032, By Product

Table 47: East Asia Market Value (US$ Million) Analysis 2017 to 2021, By End User

Table 48: East Asia Market Value (US$ Million) Opportunity Assessment 2022 to 2032, By End User

Table 49: Oceania Market Value (US$ Million) Analysis 2017 to 2021, By Country

Table 50: Oceania Market Value (US$ Million) Opportunity Assessment 2022 to 2032, By Country

Table 51: Oceania Market Value (US$ Million) Analysis 2017 to 2021, By Product

Table 52: Oceania Market Value (US$ Million) Opportunity Assessment 2022 to 2032, By Product

Table 53: Oceania Market Volume (Units) Analysis 2017 to 2021, By Product

Table 54: Oceania Market Volume (Units) Opportunity Assessment 2022 to 2032, By Product

Table 55: Oceania Market Value (US$ Million) Analysis 2017 to 2021, By End User

Table 56: Oceania Market Value (US$ Million) Opportunity Assessment 2022 to 2032, By End User

Table 57: Middle East and Africa Market Value (US$ Million) Analysis 2017 to 2021, By Country

Table 58: Middle East and Africa Market Value (US$ Million) Opportunity Assessment 2022 to 2032, By Country

Table 59: Middle East and Africa (MEA) Market Value (US$ Million) Analysis 2017 to 2021, By Product

Table 60: Middle East and Africa (MEA) Market Value (US$ Million) Opportunity Assessment 2022 to 2032, By Product

Table 61: Middle East and Africa (MEA) Market Volume (Units) Analysis 2017 to 2021, By Product

Table 62: Middle East and Africa (MEA) Market Volume (Units) Opportunity Assessment 2022 to 2032, By Product

Table 63: Middle East and Africa (MEA) Market Value (US$ Million) Analysis 2017 to 2021, By End User

Table 64: Middle East and Africa (MEA) Market Value (US$ Million) Opportunity Assessment 2022 to 2032, By End User

List of Figures

Figure 01: Global Market Historical Market Value (US$ Million) Analysis, 2017 to 2021

Figure 02: Global Market Value (US$ Million), 2022 to 2032 & Y-o-Y Growth Trend Analysis

Figure 03: Global Market Absolute $ Opportunity, 2022 to 2032

Figure 04: Global Average Pricing Analysis Benchmark US$ per unit (2021)

Figure 05: Gastric Balloons, Pricing Analysis (US$) By Region, 2021

Figure 06: Oral Palatal Space Occupying Devices, Pricing Analysis (US$) By Region, 2021

Figure 07: Global Market Historical Market Volume (Units) Analysis, 2017 to 2021

Figure 08: Global Market Volume (Units), 2022 to 2032 & Y-o-Y Growth Trend Analysis

Figure 09: Global Market Share Analysis (%), By Product, 2021 & 2032

Figure 10: Global Market Y-o-Y Analysis (%), By Product, 2022 to 2032

Figure 11: Global Market Attractiveness Analysis by Product, 2022 to 2032

Figure 12: Global Market Share Analysis (%), By End User, 2021 & 2032

Figure 13: Global Market Y-o-Y Analysis (%), By End User, 2022 to 2032

Figure 14: Global Market Attractiveness Analysis by End User, 2022 to 2032

Figure 15: Global Market Share Analysis (%), By Region, 2021 & 2032

Figure 16: Global Market Y-o-Y Analysis (%), By Region, 2022 to 2032

Figure 17: Global Market Attractiveness Analysis by Region, 2022 to 2032

Figure 18: North America Market Share Analysis (%), By Country (2022)

Figure 19: North America Market Share Analysis (%), By Product (2022)

Figure 20: North America Market Share Analysis (%), By End User (2022)

Figure 21: North America Market Historical Market Value (US$ Million) Analysis, 2017 to 2021

Figure 22: North America Market Current and Future Market Value (US$ Million), 2022 to 2032 & Y-o-Y Growth Trend Analysis

Figure 23: North America Market Attractiveness Analysis, By Country

Figure 24: North America Market Attractiveness Analysis, By Product

Figure 25: North America Market Attractiveness Analysis, By End User

Figure 26: USA Market Value Proportion Analysis, 2021

Figure 27: Global Vs USA Y-o-Y Growth Comparison, 2021 to 2032

Figure 28: USA Market Share Analysis (%), By Product, 2021 & 2032

Figure 29: USA Market Share Analysis (%), By End User, 2021 & 2032

Figure 30: Canada Market Value Proportion Analysis, 2021

Figure 31: Global Vs Canada Y-o-Y Growth Comparison, 2021 to 2032

Figure 32: Canada Market Share Analysis (%), By Product, 2021 & 2032

Figure 33: Canada Market Share Analysis (%), By End User, 2021 & 2032

Figure 34: Latin America Market Share Analysis (%), By Country (2022)

Figure 35: Latin America Market Share Analysis (%), By Product (2022)

Figure 36: Latin America Market Share Analysis (%), By End User (2022)

Figure 37: Latin America Market Historical Market Value (US$ Million) Analysis, 2017 to 2021

Figure 38: Latin America Market Current and Future Market Value (US$ Million), 2022 to 2032 & Y-o-Y Growth Trend Analysis

Figure 39: Latin America Market Attractiveness Analysis, By Country

Figure 40: Latin America Market Attractiveness Analysis, By Product

Figure 41: Latin America Market Attractiveness Analysis, By End User

Figure 42: Brazil Market Value Proportion Analysis, 2021

Figure 43: Global Vs Brazil Y-o-Y Growth Comparison, 2021 to 2032

Figure 44: Brazil Market Share Analysis (%), By Product, 2021 & 2032

Figure 45: Brazil Market Share Analysis (%), By End User, 2021 & 2032

Figure 46: Mexico Market Value Proportion Analysis, 2021

Figure 47: Global Vs Mexico Y-o-Y Growth Comparison, 2021 to 2032

Figure 48: Mexico Market Share Analysis (%), By Product, 2021 & 2032

Figure 49: Mexico Market Share Analysis (%), By End User, 2021 & 2032

Figure 50: Argentina Market Value Proportion Analysis, 2021

Figure 51: Global Vs Argentina Y-o-Y Growth Comparison, 2021 to 2032

Figure 52: Argentina Market Share Analysis (%), By Product, 2021 & 2032

Figure 53: Argentina Market Share Analysis (%), By End User, 2021 & 2032

Figure 54: Europe Market Share Analysis (%), By Country (2022)

Figure 55: Europe Market Share Analysis (%), By Product (2022)

Figure 56: Europe Market Share Analysis (%), By End User (2022)

Figure 57: Europe Market Historical Market Value (US$ Million) Analysis, 2017 to 2021

Figure 58: Europe Market Current and Future Market Value (US$ Million), 2022 to 2032 & Y-o-Y Growth Trend Analysis

Figure 59: Europe Market Attractiveness Analysis, By Country

Figure 60: Europe Market Attractiveness Analysis, By Product

Figure 61: Europe Market Attractiveness Analysis, By End User

Figure 62: Germany Market Value Proportion Analysis, 2021

Figure 63: Global Vs Germany Y-o-Y Growth Comparison, 2021 to 2032

Figure 64: Germany Market Share Analysis (%), By Product, 2021 & 2032

Figure 65: Germany Market Share Analysis (%), By End User, 2021 & 2032

Figure 66: Italy Market Value Proportion Analysis, 2021

Figure 67: Global Vs Italy Y-o-Y Growth Comparison, 2021 to 2032

Figure 68: Italy Market Share Analysis (%), By Product, 2021 & 2032

Figure 69: Italy Market Share Analysis (%), By End User, 2021 & 2032

Figure 70: France Market Value Proportion Analysis, 2021

Figure 71: Global Vs France Y-o-Y Growth Comparison, 2021 to 2032

Figure 72: France Market Share Analysis (%), By Product, 2021 & 2032

Figure 73: France Market Share Analysis (%), By End User, 2021 & 2032

Figure 74: UK Market Value Proportion Analysis, 2021

Figure 75: Global Vs UK Y-o-Y Growth Comparison, 2021 to 2032

Figure 76: UK Market Share Analysis (%), By Product, 2021 & 2032

Figure 77: UK Market Share Analysis (%), By End User, 2021 & 2032

Figure 78: Spain Market Value Proportion Analysis, 2021

Figure 79: Global Vs Spain Y-o-Y Growth Comparison, 2021 to 2032

Figure 80: Spain Market Share Analysis (%), By Product, 2021 & 2032

Figure 81: Spain Market Share Analysis (%), By End User, 2021 & 2032

Figure 82: BENELUX Market Value Proportion Analysis, 2021

Figure 83: Global Vs BENELUX Y-o-Y Growth Comparison, 2021 to 2032

Figure 84: BENELUX Market Share Analysis (%), By Product, 2021 & 2032

Figure 85: BENELUX Market Share Analysis (%), By End User, 2021 & 2032

Figure 86: Russia Market Value Proportion Analysis, 2021

Figure 87: Global Vs Russia Y-o-Y Growth Comparison, 2021 to 2032

Figure 88: Russia Market Share Analysis (%), By Product, 2021 & 2032

Figure 89: Russia Market Share Analysis (%), By End User, 2021 & 2032

Figure 90: South Asia Market Share Analysis (%), By Country (2022)

Figure 91: South Asia Market Share Analysis (%), By Product (2022)

Figure 92: South Asia Market Share Analysis (%), By End User (2022)

Figure 93: South Asia Market Historical Market Value (US$ Million) Analysis, 2017 to 2021

Figure 94: South Asia Market Current and Future Market Value (US$ Million), 2022 to 2032 & Y-o-Y Growth Trend Analysis

Figure 95: South Asia Market Attractiveness Analysis, By Country

Figure 96: South Asia Market Attractiveness Analysis, By Product

Figure 97: South Asia Market Attractiveness Analysis, By End User

Figure 98: India Market Value Proportion Analysis, 2021

Figure 99: Global Vs India Y-o-Y Growth Comparison, 2021 to 2032

Figure 100: India Market Share Analysis (%), By Product, 2021 & 2032

Figure 101: India Market Share Analysis (%), By End User, 2021 & 2032

Figure 102: Thailand Market Value Proportion Analysis, 2021

Figure 103: Global Vs Thailand Y-o-Y Growth Comparison, 2021 to 2032

Figure 104: Thailand Market Share Analysis (%), By Product, 2021 & 2032

Figure 105: Thailand Market Share Analysis (%), By End User, 2021 & 2032

Figure 106: Indonesia Market Value Proportion Analysis, 2021

Figure 107: Global Vs Indonesia Y-o-Y Growth Comparison, 2021 to 2032

Figure 108: Indonesia Market Share Analysis (%), By Product, 2021 & 2032

Figure 109: Indonesia Market Share Analysis (%), By End User, 2021 & 2032

Figure 110: Malaysia Market Value Proportion Analysis, 2021

Figure 110: Global Vs Malaysia Y-o-Y Growth Comparison, 2021 to 2032

Figure 111: Malaysia Market Share Analysis (%), By Product, 2021 & 2032

Figure 112: Malaysia Market Share Analysis (%), By End User, 2021 & 2032

Figure 113: East Asia Market Share Analysis (%), By Country (2022)

Figure 114: East Asia Market Share Analysis (%), By Product (2022)

Figure 115: East Asia Market Share Analysis (%), By End User (2022)

Figure 116: East Asia Market Historical Market Value (US$ Million) Analysis, 2017 to 2021

Figure 117: East Asia Market Current and Future Market Value (US$ Million), 2022 to 2032 & Y-o-Y Growth Trend Analysis

Figure 118: East Asia Market Attractiveness Analysis, By Country

Figure 119: East Asia Market Attractiveness Analysis, By Product

Figure 120: East Asia Market Attractiveness Analysis, By End User

Figure 121: China Market Value Proportion Analysis, 2021

Figure 122: Global Vs China Y-o-Y Growth Comparison, 2021 to 2032

Figure 123: China Market Share Analysis (%), By Product, 2021 & 2032

Figure 124: China Market Share Analysis (%), By End User, 2021 & 2032

Figure 125: Japan Market Value Proportion Analysis, 2021

Figure 126: Global Vs Japan Y-o-Y Growth Comparison, 2021 to 2032

Figure 127: Japan Market Share Analysis (%), By Product, 2021 & 2032

Figure 128: Japan Market Share Analysis (%), By End User, 2021 & 2032

Figure 129: South Korea Market Value Proportion Analysis, 2021

Figure 130: Global Vs South Korea Y-o-Y Growth Comparison, 2021 to 2032

Figure 131: South Korea Market Share Analysis (%), By Product, 2021 & 2032

Figure 132: South Korea Market Share Analysis (%), By End User, 2021 & 2032

Figure 133: Oceania Market Share Analysis (%), By Country (2022)

Figure 134: Oceania Market Share Analysis (%), By Product (2022)

Figure 135: Oceania Market Share Analysis (%), By End User (2022)

Figure 136: Oceania Market Historical Market Value (US$ Million) Analysis, 2017 to 2021

Figure 137: Oceania Market Current and Future Market Value (US$ Million), 2022 to 2032 & Y-o-Y Growth Trend Analysis

Figure 138: Oceania Market Attractiveness Analysis, By Country

Figure 139: Oceania Market Attractiveness Analysis, By Product

Figure 140: Oceania Market Attractiveness Analysis, By End User

Figure 141: Australia Market Value Proportion Analysis, 2021

Figure 142: Global Vs Australia Y-o-Y Growth Comparison, 2021 to 2032

Figure 144: Australia Market Share Analysis (%), By Product, 2021 & 2032

Figure 145: Australia Market Share Analysis (%), By End User, 2021 & 2032

Figure 146: New Zealand Market Value Proportion Analysis, 2021

Figure 147: Global Vs New Zealand Y-o-Y Growth Comparison, 2021 to 2032

Figure 148: New Zealand Market Share Analysis (%), By Product, 2021 & 2032

Figure 149: New Zealand Market Share Analysis (%), By End User, 2021 & 2032

Figure 150: Middle East and Africa (MEA) Market Share Analysis (%), By Country (2022)

Figure 151: Middle East and Africa (MEA) Market Share Analysis (%), By Product (2022)

Figure 152: Middle East and Africa (MEA) Market Share Analysis (%), By End User (2022)

Figure 153: Middle East and Africa (MEA) Market Historical Market Value (US$ Million) Analysis, 2017 to 2021

Figure 154: Middle East and Africa (MEA) Market Current and Future Market Value (US$ Million), 2022 to 2032 & Y-o-Y Growth Trend Analysis

Figure 155: Middle East and Africa (MEA) Market Attractiveness Analysis, By Country

Figure 156: Middle East and Africa (MEA) Market Attractiveness Analysis, By Product

Figure 157: Middle East and Africa (MEA) Market Attractiveness Analysis, By End User

Figure 158: GCC Countries Market Value Proportion Analysis, 2021

Figure 159: Global Vs GCC Countries Y-o-Y Growth Comparison, 2021 to 2032

Figure 160: GCC Countries Market Share Analysis (%), By Product, 2021 & 2032

Figure 161: GCC Countries Market Share Analysis (%), By End User, 2021 & 2032

Figure 162: Turkey Market Value Proportion Analysis, 2021

Figure 163: Global Vs Turkey Y-o-Y Growth Comparison, 2021 to 2032

Figure 164: Turkey Market Share Analysis (%), By Product, 2021 & 2032

Figure 165: Turkey Market Share Analysis (%), By End User, 2021 & 2032

Figure 166: North Africa Market Value Proportion Analysis, 2021

Figure 167: Global Vs North Africa Y-o-Y Growth Comparison, 2021 to 2032

Figure 168: North Africa Market Share Analysis (%), By Product, 2021 & 2032

Figure 169: North Africa Market Share Analysis (%), By End User, 2021 & 2032

Figure 170: South Africa Market Value Proportion Analysis, 2021

Figure 171: Global Vs South Africa Y-o-Y Growth Comparison, 2021 to 2032

Figure 172: South Africa Market Share Analysis (%), By Product, 2021 & 2032

Figure 173: South Africa Market Share Analysis (%), By End User, 2021 & 2032

Frequently Asked Questions

How much is the gastric space-occupying devices market worth in 2021?

The global gastric space-occupying devices market is worth USD 197.5 Million in 2021 and is set to expand 3.6X over the next ten years.

What is the sales forecast for the gastric space-occupying devices market through 2032?

The gastric space-occupying devices market is expected to reach USD 810.8 Million by the end of 2032, with sales revenue expected to register a 13.7% CAGR.

What are the key trends shaping the gastric space-occupying devices industry?

The rising prevalence of obesity, growing preference for minimally invasive therapies, and the increasing need for gastric space-occupying devices in obesity management are some of the key trends in this market.

Which are the top 5 countries driving demand for gastric space-occupying devices?

USA, UK, Germany, China, and Japan are expected to drive demand for the gastric space-occupying devices industry.

What is the North American market outlook for gastric space-occupying devices?

North America is one of the key markets for gastric space-occupying devices, with the USA accounting for about 83.3% of the North American gastric space-occupying devices market in the year 2021.

At what percentage is the demand for gastric space-occupying devices expected to register growth in Europe?

Demand for gastric space-occupying devices in Europe is expected to register a growth of 12.99% over the next ten years.

Which countries are the key producers of gastric space-occupying devices?

The USA, UK, and China are the key producers of gastric space-occupying devices.

Who are the key players in the gastric space-occupying devices market sphere?

Apollo Endosurgery, Inc., Obalon Therapeutics, Inc., Allurion Technologies, Inc., Helioscopie, Endalis, MEDSIL, ReShape Medical, Inc., Lexel Medical, and Scientific Intake, is some of the key players in the gastric space-occupying devices industry.

Explore Therapeutic Device Insights

Future Market Insights

Gastric Space-Occupying Devices Market