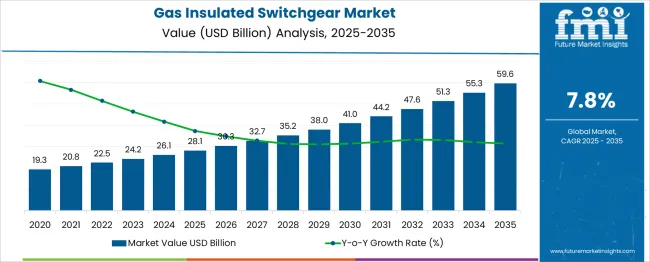
The Gas Insulated Switchgear Market is estimated to be valued at USD 28.1 billion in 2025 and is projected to reach USD 59.6 billion by 2035, registering a compound annual growth rate (CAGR) of 7.8% over the forecast period. From 2020 to 2025, the market grows steadily, rising from USD 19.3 billion to USD 28.1 billion, reflecting moderate yearly gains averaging around USD 1.7 to 2.0 billion. This period establishes a strong foundation, with infrastructure upgrades and demand for compact, high-performance switchgear supporting adoption. After 2025, the pace of growth begins to accelerate more noticeably. Annual absolute dollar additions increase gradually from USD 2.2 billion between 2025 and 2026 to USD 4.3 billion between 2034 and 2035. This progressive expansion indicates a shifting momentum, with more significant investments projected across urban and industrial power distribution, especially in high-voltage grid modernization and space-constrained installations. As countries focus on energy reliability and safety, the GIS market benefits from both replacement cycles and new deployment. The smooth and increasingly steep curve highlights a healthy acceleration pattern, with no major dips or volatility—pointing to strong fundamentals and rising global acceptance. This kind of stable yet intensifying growth is a hallmark of long-term infrastructure-centric markets.
| Metric | Value |
|---|---|
| Gas Insulated Switchgear Market Estimated Value in (2025 E) | USD 28.1 billion |
| Gas Insulated Switchgear Market Forecast Value in (2035 F) | USD 59.6 billion |
| Forecast CAGR (2025 to 2035) | 7.8% |
The Gas Insulated Switchgear (GIS) Market falls under the wider global switchgear industry, which encompasses a variety of technologies for power control, isolation, and protection. Among these, GIS systems are increasingly favored for their ability to house components in a sealed, gas-insulated enclosure, allowing for reduced space requirements and greater safety in constrained or high-risk environments. Within the broader switchgear market, GIS is carving out a larger footprint, driven by its superior insulation performance and longevity in extreme climates and urban settings.
As electricity distribution networks evolve to support increasing load, decentralized generation, and digital monitoring, GIS is becoming an essential part of substations, transmission nodes, and industrial facilities. While air-insulated switchgear dominates in rural and low-voltage settings, GIS is gaining preference in metro areas, renewable energy zones, and infrastructure projects where space, reliability, and environmental concerns intersect.
As a result, GIS is expected to steadily grow its contribution within the overall switchgear market, currently estimated at approximately 30–35%, with the share rising due to increasing electrification efforts and the growing complexity of power distribution systems worldwide.
The gas insulated switchgear (GIS) market is undergoing steady expansion, supported by rising energy demand, increasing urbanization, and infrastructure modernization across both developed and emerging economies. The preference for compact, maintenance-free, and high-performance switchgear systems in densely populated regions is reinforcing GIS adoption.
Regulatory mandates for safety, grid reliability, and environmental compliance are pushing utilities and industrial users toward advanced insulation technologies. Continued investments in smart grid development, renewable integration, and high-voltage substation upgrades are expected to drive demand for high-efficiency, space-saving switchgear.
With energy transition targets accelerating, particularly in Asia and Europe, GIS is gaining traction as a preferred alternative to traditional air-insulated units due to its operational stability and reduced footprint. Future growth is likely to be catalyzed by hybrid systems, digital monitoring solutions, and SF₆-free technologies aligned with sustainability goals
The gas insulated switchgear market is segmented by capacity range, voltage level, application type, and geographic regions. The capacity range of the gas-insulated switchgear market is divided into > 72 kV to ≤ 150 kV, ≤ 38 kV, > 38 kV to ≤ 72 kV, and > 150 kV. The voltage level of the gas-insulated switchgear market is classified into High Voltage, Medium Voltage, Primary Distribution, and Secondary Distribution.
Based on the application type, the gas-insulated switchgear market is segmented into Transmission & Distribution, Manufacturing & Processing, Infrastructure & Transportation, Power Generation, and Others. Regionally, the gas insulated switchgear industry is classified into North America, Latin America, Western Europe, Eastern Europe, Balkan & Baltic Countries, Russia & Belarus, Central Asia, East Asia, South Asia & Pacific, and the Middle East & Africa.
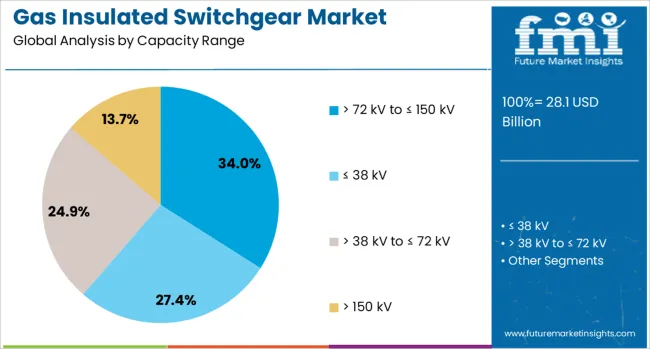
The > 72 kV to ≤ 150 kV capacity range is projected to account for 34.0% of the total revenue in the GIS market by 2025, making it the leading capacity segment. This dominance is being attributed to the widespread deployment of medium- to high-voltage transmission infrastructure in urban and peri-urban areas.
The voltage band offers a balance between capacity and installation compactness, which is particularly valuable for indoor substations, industrial parks, and renewable energy corridors. Adoption has been reinforced by grid extension programs in developing economies and the retrofitting of aging infrastructure in developed nations.
Additionally, the compatibility of this range with modular and transportable substation designs enhances its suitability for time-sensitive and space-constrained projects
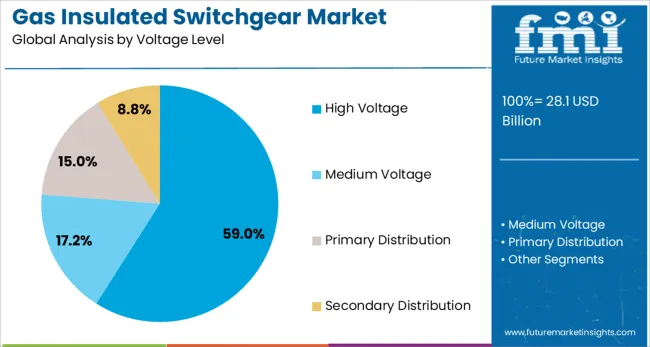
High voltage GIS systems are expected to hold 59.0% of the overall market share in 2025, solidifying their position as the top voltage level segment. Their dominance is being driven by increased investment in long-distance power transmission and cross-border interconnection projects.
High voltage GIS is favored for its superior insulation performance, high reliability, and ability to operate under harsh environmental conditions such as extreme temperatures, pollution, or seismic zones. These systems support enhanced operational safety and require minimal maintenance, which contributes to reduced life-cycle costs.
The demand is further supported by growing deployment in smart substations, energy-intensive industrial zones, and urban load centers where system downtime must be minimized
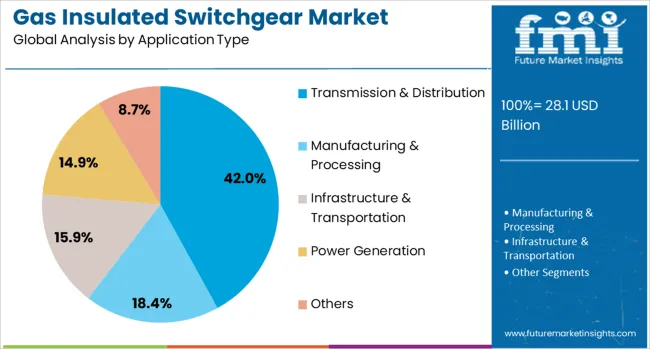
Transmission & distribution is anticipated to contribute 42.0% of the market revenue in 2025, making it the leading application segment. This leadership is being driven by national grid expansion initiatives, renewable energy integration, and the need to minimize technical losses.
GIS enables reliable switching, protection, and fault isolation in transmission networks with limited space availability. Its adoption in underground substations and densely populated urban environments is rising due to its reduced spatial requirements and enhanced operational safety.
Public sector investments, along with international financing for energy infrastructure development, are further reinforcing demand in this application segment. As utilities strive for grid resilience and efficiency, GIS is playing a crucial role in modernizing transmission and distribution networks globally
The gas insulated switchgear market continues to grow as utilities and industries demand compact, low-maintenance solutions for power distribution. These systems are favored in environments with limited space or challenging conditions, including underground installations and offshore platforms. Gas insulation provides arc-quenching performance and high fault tolerance. Vendors differentiate through voltage range flexibility, modularity, and ease of installation. Market adoption is further influenced by grid modernization initiatives, aging infrastructure replacement, and the need to reduce failure risk in mission-critical power applications.
Gas insulated switchgear is valued for its ability to deliver reliable power distribution in environments where space is at a premium. Unlike air-insulated systems, these units are compact and enclosed, allowing them to be used in densely populated urban centers, industrial facilities, tunnels, and offshore platforms. The sealed design protects components from dust, moisture, and other environmental hazards, improving longevity and reducing maintenance cycles. High dielectric strength provided by the insulating gas supports higher voltage performance in a smaller footprint. This makes them ideal for retrofitting older substations and building new installations in constrained areas. In regions prone to harsh weather or contamination, gas insulated switchgear reduces the chance of operational failure. Utilities and facility managers also value the lower inspection and service demands, especially in areas where downtime is expensive or access is limited. As reliability and compactness remain top priorities, demand is expected to stay strong across multiple sectors.
Despite the performance benefits, gas insulated switchgear often faces resistance from buyers concerned with cost and system flexibility. These units typically require a higher upfront investment than air-insulated alternatives, making them less attractive for projects with tight budgets. In addition, once installed, modifications to layout or capacity can be challenging due to the sealed design and rigid configuration of internal components. This limits their suitability in settings where load profiles or design requirements may change over time. Maintenance, while less frequent, may involve specialized procedures or equipment, adding complexity to service planning. For operators unfamiliar with gas-based systems, training and certification may also be required. These factors contribute to longer decision cycles, especially in smaller utilities or facilities with evolving infrastructure needs. Vendors who offer hybrid systems or scalable models are better positioned to address these concerns and appeal to cost-conscious buyers without compromising performance.
Many countries are investing in grid infrastructure upgrades to address rising demand, improve reliability, and replace aging assets. Gas insulated switchgear is increasingly specified for these projects due to its space-saving design and operational safety features. In urban environments where land is limited or substation space is constrained, compact switchgear systems allow for more efficient use of available space without sacrificing voltage capacity or safety standards. Governments and utilities involved in long-term grid planning favor solutions that offer longevity, minimal environmental exposure, and proven fault tolerance. Integration into digital monitoring systems is another reason for adoption, as it helps operators remotely supervise performance, detect faults early, and schedule maintenance proactively. Expansion in industrial parks, transportation hubs, and renewable energy integration also calls for compact and durable switchgear installations. As investment in resilient infrastructure continues, gas insulated switchgear is positioned as a preferred solution in both new installations and upgrade programs.
Gas insulated switchgear systems rely on highly specialized components and insulating gases that must meet strict quality and safety standards. Any disruption in the availability of breakers, busbars, insulators, or enclosures can delay project delivery or increase system costs. Additionally, skilled labor is often required for assembly, installation, and commissioning, especially for large or high-voltage configurations. The complexity of the sealing process, gas handling, and compartmentalization also increases the likelihood of errors during setup if not managed by experienced technicians. In some regions, a lack of standardized training or limited access to certified contractors affects deployment speed and consistency. Global supply chain fluctuations and region-specific regulations on insulating materials further contribute to procurement challenges. To remain competitive, manufacturers and installers must streamline production, ensure workforce readiness, and provide support services that simplify field deployment. Until these challenges are fully addressed, market growth may be uneven across regions and sectors.
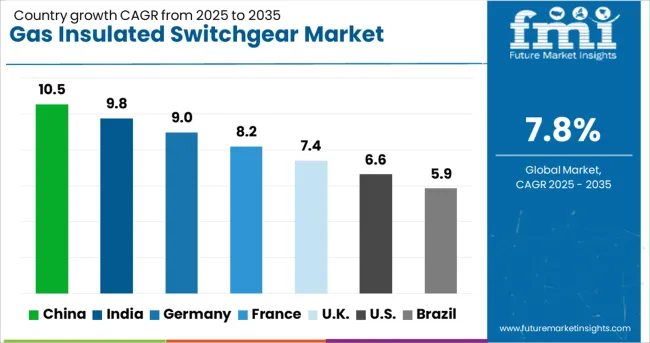
| Country | CAGR |
|---|---|
| China | 10.5% |
| India | 9.8% |
| Germany | 9.0% |
| France | 8.2% |
| UK | 7.4% |
| USA | 6.6% |
| Brazil | 5.9% |
The global gas insulated switchgear (GIS) market is projected to grow at a CAGR of 7.8% through 2035, driven by the demand for space-saving, high-reliability power infrastructure. Among BRICS nations, China leads with a 10.5% growth rate, propelled by large-scale grid expansion projects, robust manufacturing ecosystems, and state-led electrification programs. India follows at 9.8%, driven by rural electrification, smart grid initiatives, and increasing investment in compact substations. Within the OECD region, Germany shows strong 9.0% growth, supported by advanced engineering capabilities, environmental compliance, and integration with renewable energy networks.
The United Kingdom, growing at 7.4%, focuses on offshore transmission systems and modernizing existing switchgear fleets. The United States, with a growth rate of 6.6%, emphasizes infrastructure replacement, high-voltage applications, and evolving regulatory standards. These countries demonstrate how production capacity, regulatory alignment, and deployment strategies shape the global GIS market. This report includes insights on 40+ countries; the top five markets are shown here for reference.
China commands the GIS market in Asia with a CAGR of 10.5%, driven by grid modernization, and renewable energy integration. High-voltage GIS units are increasingly installed in metro systems, industrial parks, and large residential complexes where space constraints and reliability are critical. China's Belt and Road energy projects also incorporate GIS to ensure transmission stability across borders. Local manufacturers are developing SF₆-free and compact GIS models to meet stricter environmental regulations. The push toward carbon neutrality has further encouraged the use of efficient switchgear in solar and wind farms across regions like Inner Mongolia and Qinghai.
India shows strong GIS market momentum with a CAGR of 9.8%, driven by infrastructure upgrades, smart grid initiatives, and renewable energy investments. Urban growth in Delhi, Mumbai, and Bengaluru has led to wider GIS deployment in substations and underground power systems. India's solar parks and wind projects also depend on GIS for grid integration and voltage control. The government’s electrification push for rural and remote areas has created demand for compact, weather-resistant GIS units. Domestic companies are scaling up local production while adopting global standards to compete in export markets.
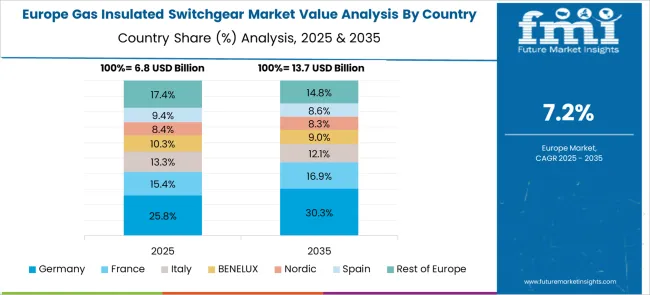
Germany maintains a strong position in the Gas Insulated Switchgear Market with a CAGR of 9.0%, bolstered by energy transition policies and infrastructure upgrades. The shift away from fossil fuels has led to greater reliance on GIS to support wind, solar, and decentralized power sources. In cities like Berlin and Frankfurt, GIS is preferred in confined substations due to its compact design and reliability. German companies are global leaders in SF₆-free GIS innovation, setting benchmarks for environmental compliance and efficiency. These solutions are being deployed in rail, metro, and industrial power systems across the nation.
The United Kingdom continues to develop its Gas Insulated Switchgear Market at a CAGR of 7.4%, fueled by the need to modernize aging grid systems and accommodate rising renewable energy output. In cities like London and Manchester, GIS is installed in indoor substations to ensure efficient land use and minimize noise. Offshore wind farms along the North Sea heavily rely on GIS for their high-voltage transmission systems. Utilities and infrastructure developers are also turning to GIS for its durability and ease of maintenance in challenging environments such as tunnels and urban transit networks.
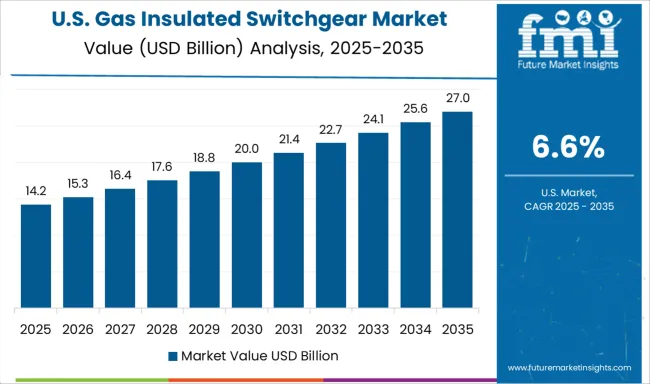
The United States reports a CAGR of 6.6% in the Gas Insulated Switchgear Market, supported by investments in renewable power and utility infrastructure modernization. Coastal states like California and New York are using GIS to support urban substations where compact and weather-resistant systems are necessary. Wind energy installations in the Midwest and solar projects in the Southwest increasingly depend on GIS for grid integration. USA manufacturers are focusing on low-emission, modular GIS products that address regulatory requirements and offer fast deployment for both utility and industrial customers.
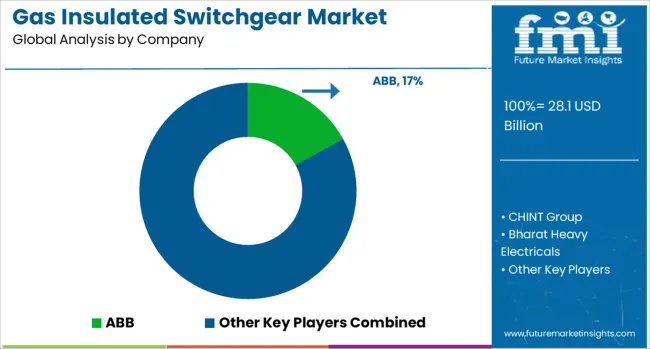
The gas insulated switchgear (GIS) market is driven by the increasing need for compact, high-voltage electrical equipment that ensures operational reliability across transmission and distribution networks. GIS systems offer advantages in space-constrained environments and harsh conditions, making them suitable for substations in urban settings, industrial zones, and offshore platforms.
The market features a mix of multinational conglomerates and regional specialists delivering tailored GIS solutions. ABB, Siemens, Mitsubishi Electric, and General Electric are among the foremost suppliers, offering GIS solutions across a wide voltage range with a focus on compactness, arc-quenching capability, and system integration. These companies provide complete product lines for utilities and infrastructure projects, often supporting turnkey installation, digital monitoring, and modular configurations.
Hitachi, Fuji Electric, and Toshiba strengthen the competitive field with robust deployments in Asia and expanding global footprints, often backed by domestic grid development initiatives. Other players such as Schneider Electric, Eaton, and CG Power and Industrial Solutions serve utility and industrial clients with medium and high-voltage GIS platforms. CHINT Group, HD Hyundai Electric, Hyosung Heavy Industries, and Ormazabal address region-specific demands with scalable and cost-sensitive solutions.
Additionally, firms like Lucy Group, Skema, and Bharat Heavy Electricals contribute specialized products tailored for smart grid compatibility and confined installations. With demand rising for low-maintenance and high-durability equipment, suppliers offering broad voltage portfolios and localized manufacturing continue to gain strategic traction.
As announced in Hitachi Energy’s official press release on May 7, 2025, the company will deliver the world’s first SF₆‑free 550 kV GIS to the Central China Branch of the State Grid Corporation of China. The system uses EconiQ gas mixture, advancing decarbonization and grid sustainability. As detailed in ABB’s official news release in early 2025, ABB’s new SF₆‑free switchgear portfolio including SafeRing/SafePlus Air and UniSec Air systems for up to 24 kV is available commercially in 2025. These systems fulfill emerging EU F-gas regulations while preserving existing interfaces and reliability.
| Item | Value |
|---|---|
| Quantitative Units | USD 28.1 Billion |
| Capacity Range | > 72 kV to ≤ 150 kV, ≤ 38 kV, > 38 kV to ≤ 72 kV, and > 150 kV |
| Voltage Level | High Voltage, Medium Voltage, Primary Distribution, and Secondary Distribution |
| Application Type | Transmission & Distribution, Manufacturing & Processing, Infrastructure & Transportation, Power Generation, and Others |
| Regions Covered | North America, Europe, Asia-Pacific, Latin America, Middle East & Africa |
| Country Covered | United States, Canada, Germany, France, United Kingdom, China, Japan, India, Brazil, South Africa |
| Key Companies Profiled | ABB, CHINT Group, Bharat Heavy Electricals, CG Power and Industrial Solutions, Eaton, Fuji Electric, General Electric, HD Hyundai Electric, Hitachi, Hyosung Heavy Industries, Lucy Group, Mitsubishi Electric, Ormazabal, Schneider Electric, Siemens, Skema, and Toshiba |
The global gas insulated switchgear market is estimated to be valued at USD 28.1 billion in 2025.
The market size for the gas insulated switchgear market is projected to reach USD 59.6 billion by 2035.
The gas insulated switchgear market is expected to grow at a 7.8% CAGR between 2025 and 2035.
The key product types in gas insulated switchgear market are > 72 kv to ≤ 150 kv, ≤ 38 kv, > 38 kv to ≤ 72 kv and > 150 kv.
In terms of voltage level, high voltage segment to command 59.0% share in the gas insulated switchgear market in 2025.


Full Research Suite comprises of:
Market outlook & trends analysis
Interviews & case studies
Strategic recommendations
Vendor profiles & capabilities analysis
5-year forecasts
8 regions and 60+ country-level data splits
Market segment data splits
12 months of continuous data updates
DELIVERED AS:
PDF EXCEL ONLINE
Gas Insulated Switchgears (GIS) Market
Gas Insulated Commercial Switchgear Market Size and Share Forecast Outlook 2025 to 2035
Gas Insulated Medium Voltage Switchgear Market Size and Share Forecast Outlook 2025 to 2035
Gas Cylinder Market Size and Share Forecast Outlook 2025 to 2035
Gasket and Seal Market Size and Share Forecast Outlook 2025 to 2035
Gas Separation Membrane Market Size and Share Forecast Outlook 2025 to 2035
Gas Jet Compressor Market Size and Share Forecast Outlook 2025 to 2035
Gas Fired Water-Tube Food Processing Boiler Market Size and Share Forecast Outlook 2025 to 2035
Gas Fired Real Estate Generator Market Size and Share Forecast Outlook 2025 to 2035
Gastric-soluble Hollow Capsules Market Size and Share Forecast Outlook 2025 to 2035
Gas Cooling System Market Analysis - Size, Share, and Forecast Outlook 2025 to 2035
Gasoline Gensets Market Size and Share Forecast Outlook 2025 to 2035
Gas Turbine Oil Market Size and Share Forecast Outlook 2025 to 2035
Gas Telecom Generator Market Size and Share Forecast Outlook 2025 to 2035
Gas Fired Condensing Low Temperature Commercial Boiler Market Size and Share Forecast Outlook 2025 to 2035
Gas Commercial Deep Fryers Market Size and Share Forecast Outlook 2025 to 2035
Gastroesophageal Reflux Disease (GERD) Device Market Analysis - Size, Share, and Forecast Outlook 2025 to 2035
Gas Station Equipment Market Size and Share Forecast Outlook 2025 to 2035
Gaskets Market Size and Share Forecast Outlook 2025 to 2035
Gas Chromatography Systems Market Size and Share Forecast Outlook 2025 to 2035

Thank you!
You will receive an email from our Business Development Manager. Please be sure to check your SPAM/JUNK folder too.
Chat With
MaRIA