The global compact construction equipment market is projected to reach USD 48.2 billion by 2035, recording an absolute increase of USD 12.6 billion over the forecast period. The market is valued at USD 35.6 billion in 2025 and is set to rise at a CAGR of 3.1% during the assessment period. The market size is expected to grow by 1.4 times during the same period, supported by increasing urbanization and infrastructure development worldwide, driving demand for efficient compact machinery systems and increasing investments in residential construction and public works projects globally. Equipment cost pressures and regulatory compliance requirements may pose challenges to market expansion.
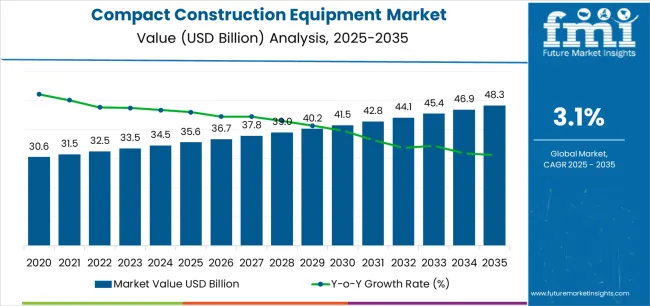
Between 2025 and 2030, the compact construction equipment market is projected to expand from USD 35.6 billion to USD 41.5 billion, resulting in a value increase of USD 5.9 billion, which represents 46.8% of the total forecast growth for the decade. This phase of development will be shaped by rising demand for urban infrastructure and residential construction solutions, product innovation in electric and autonomous compact machinery systems, as well as expanding integration with smart construction and emission reduction initiatives. Companies are establishing competitive positions through investment in advanced electrification technologies, telematics solutions, and strategic market expansion across residential, commercial, and infrastructure construction applications.
From 2030 to 2035, the market is forecast to grow from USD 41.5 billion to USD 48.2 billion, adding another USD 6.7 billion, which constitutes 53.2% of the ten-year expansion. This period is expected to be characterized by the expansion of specialized autonomous systems, including advanced electric powertrains and integrated connectivity solutions tailored for specific construction requirements, strategic collaborations between equipment manufacturers and rental companies, and an enhanced focus on operational efficiency and environmental responsibility. The growing emphasis on carbon-neutral construction and smart equipment management will drive demand for advanced, high-performance compact construction equipment solutions across diverse construction applications.
| Metric | Value |
|---|---|
| Market Value (2025) | USD 35.6 billion |
| Market Forecast Value (2035) | USD 48.2 billion |
| Forecast CAGR (2025-2035) | 3.1% |
The compact construction equipment market grows by enabling contractors to achieve superior operational efficiency and project productivity while meeting evolving urban construction demands. Construction operators face mounting pressure to improve site safety and environmental compliance, with compact equipment solutions typically providing 20-30% better fuel efficiency over conventional full-size machinery, making compact units essential for urban and confined-space construction projects. The urban densification movement's need for versatile, maneuverable equipment creates demand for advanced compact solutions that can enhance productivity, reduce site disruption, and ensure consistent performance across diverse construction conditions.
Government initiatives promoting infrastructure modernization and ecological construction practices drive adoption in residential, commercial, and public works applications, where equipment efficiency has a direct impact on project timelines and profitability. The global shift toward electrification and emission reduction accelerates compact equipment demand as contractors seek alternatives to diesel-powered units that generate excessive emissions. Higher initial capital costs and technology transition challenges compared to conventional equipment may limit adoption rates among price-sensitive small contractors and regions with underdeveloped rental infrastructure.
The market is segmented by product type, power output, application, engine capacity, and region. By product type, the market is divided into track loaders, mini excavators, skid steers, compact wheel loaders, backhoe loaders, telehandlers, and others. Based on power output, the market is categorized into less than 100 HP, 101-200 HP, 201-400 HP, and greater than 400 HP. By application, the market includes excavation, loading, materials handling, lifting and hoisting, and other applications. Based on engine capacity, the market is segmented into less than 5L, 5-10L, and greater than 10L. Regionally, the market is divided into Asia Pacific, Europe, North America, Latin America, and Middle East & Africa.
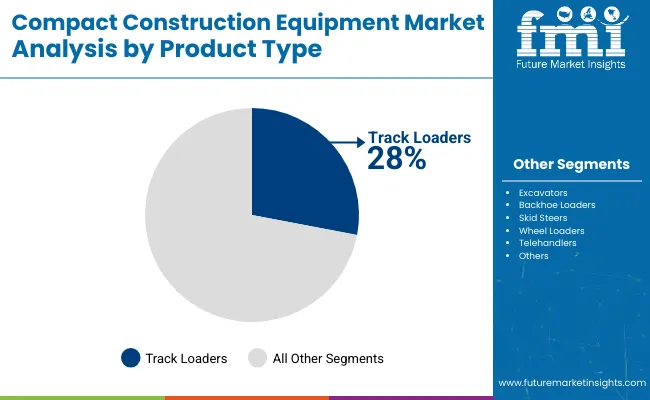
The track loaders segment represents the dominant force in the compact construction equipment market, capturing approximately 28% of total market share in 2025. This advanced category encompasses tracked machinery featuring enhanced traction systems, versatile attachment compatibility, and superior stability on challenging terrain, delivering comprehensive performance capabilities with optimal ground pressure distribution. The track loaders segment's market leadership stems from its exceptional versatility across diverse construction applications, superior performance in soft or uneven ground conditions, and compatibility with urban construction projects that require minimal site disturbance.
The mini excavators segment maintains a substantial 24.0% market share, serving contractors who require precision digging capabilities and compact dimensions for confined-space operations. The skid steers segment accounts for 18.0% market share, offering rapid maneuverability and quick-attach versatility for material handling tasks. Compact wheel loaders account for 12.0% of the market, offering efficient loading capabilities and superior mobility. Backhoe loaders hold 9.0% market share, combining digging and loading functions in a single platform. Telehandlers account for 6.0% market share, featuring extended reach capabilities for lifting applications, while other compact equipment types represent 3.0% of the market.
Key advantages driving the track loaders segment include:
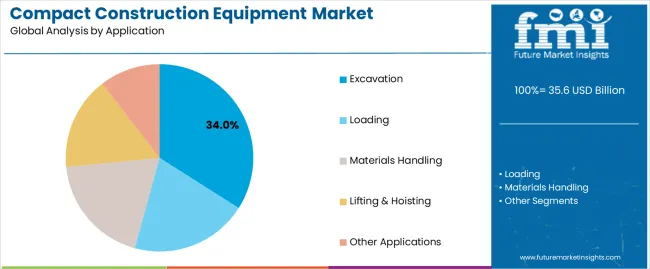
The excavation segment represents the leading application category in the compact construction equipment market, capturing approximately 34% of total market share in 2025. This critical application encompasses foundation preparation, trenching operations, site grading, and utility installation projects where compact equipment delivers precision digging capabilities with minimal site disruption. The excavation segment's dominance reflects the fundamental role of earthmoving operations in virtually all construction projects, from residential developments to commercial buildings and infrastructure installations.
The loading segment maintains a substantial 26.0% market share, serving material handling and transport requirements across construction sites where efficient movement of soil, aggregates, and construction materials is essential for project productivity. Materials handling applications account for 20.0% market share, featuring equipment utilization in warehouse operations, agricultural facilities, and industrial sites. Lifting and hoisting operations represent 12.0% of the market, supporting vertical construction tasks and material placement requirements. Other applications hold 8.0% market share, including snow removal, landscaping, and specialized industrial tasks.
Key factors driving excavation segment leadership include:
The market is driven by three concrete demand factors tied to urbanization and construction efficiency outcomes. First, accelerating urban development and infrastructure modernization create increasing requirements for compact machinery capable of operating in confined spaces, with global urban construction activity growing 8-12% annually in major metro regions worldwide, requiring efficient compact equipment for residential and commercial projects. Second, labor shortage pressures and rising construction wages drive contractors toward mechanization, with compact equipment enabling 40-60% productivity improvements per operator while reducing manual labor requirements and associated safety risks. Third, environmental regulations and emission standards accelerate adoption of modern compact equipment, with Tier 4 Final and Stage V compliant engines reducing particulate emissions by 90% compared to older machinery while supporting contractor compliance with urban air quality mandates.
Market restraints include high initial capital costs affecting equipment accessibility for small contractors, with new compact excavators and loaders priced 30-50% higher than comparable used equipment, creating financial barriers for independent operators and startup construction firms operating on limited working capital. Technology transition challenges associated with electrification and autonomous systems pose adoption barriers, as contractors evaluate total cost of ownership implications including charging infrastructure investments, battery replacement costs, and operator training requirements for emerging electric platforms. Supply chain disruptions affecting component availability and delivery timelines create additional challenges, particularly for advanced electronic systems and emission control technologies where semiconductor shortages and logistics constraints extend lead times to 6-12 months for certain equipment models.
Key trends indicate accelerated electrification adoption in urban markets, particularly in regions with strict emission zones and noise regulations where electric compact equipment enables compliance with operating restrictions while reducing fuel costs by 60-70% compared to diesel alternatives. Autonomous and semi-autonomous technology advancement trends toward machine-guided grading systems, remote operation capabilities, and AI-assisted equipment management platforms are enabling next-generation productivity improvements and operator safety enhancements. The market thesis could face disruption if hydrogen fuel cell technologies or advanced biofuels emerge as cost-competitive alternatives to battery-electric systems, potentially reshaping powertrain preferences and infrastructure investment priorities across the construction equipment sector.
| Country | CAGR (2025-2035) |
|---|---|
| India | 3.8% |
| China | 3.6% |
| USA | 3.4% |
| Germany | 3.1% |
| Brazil | 2.9% |
| Japan | 2.8% |
| United Kingdom | 2.7% |
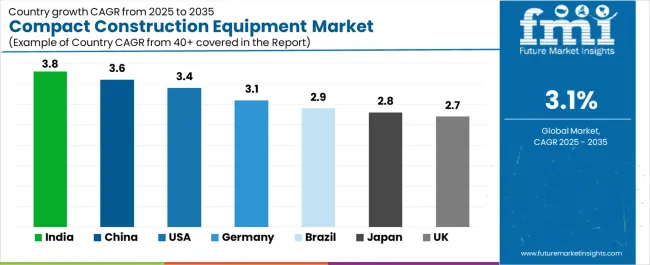
The compact construction equipment market is gaining momentum worldwide, with India taking the lead due to constant urban housing schemes and transport corridor development programs. Close behind, China benefits from city renewal initiatives and electric equipment incentive programs, positioning itself as a strategic growth hub in the Asia-Pacific region. The USA shows strong advancement, where infrastructure law outlays and rental market penetration strengthen its role in North American construction supply chains. Germany demonstrates robust growth through low-emission mandates and technology upgrade requirements, signaling continued investment in ecological construction infrastructure. Brazil stands out for its sanitation and roads programs combined with agricultural building expansion, while Japan and the United Kingdom continue to record consistent progress driven by compact machinery adoption in urban redevelopment and utilities upgrade projects. India and China anchor the global expansion story, while established markets build stability and diversity into the market's growth path.
The report covers an in-depth analysis of 40+ countries, with top-performing countries highlighted below.
India demonstrates the strongest growth potential in the compact construction equipment market with a CAGR of 3.8% through 2035. The country's leadership position stems from comprehensive urban housing improvement schemes, intensive infrastructure development programs, and aggressive smart city targets driving adoption of modern compact machinery systems. Growth is concentrated in major metropolitan regions, including Mumbai, Delhi NCR, Bangalore, and Hyderabad, where residential construction, commercial development, and metro rail projects are implementing advanced compact equipment for confined-space operations and urban construction efficiency. Distribution channels through equipment dealerships, rental companies, and direct contractor relationships expand deployment across construction clusters and infrastructure development sites. The country's Housing for All mission and National Infrastructure Pipeline provide policy support for construction mechanization, including financing schemes for equipment procurement and technology adoption.
Key market factors:
In major urban centers, industrial zones, and infrastructure corridors, the adoption of compact construction equipment systems is accelerating across residential developments, commercial projects, and public works applications, driven by city renewal initiatives and government green programs. The market demonstrates strong growth momentum with a CAGR of 3.6% through 2035, linked to comprehensive urbanization expansion and increasing focus on construction efficiency enhancement solutions. Chinese contractors are implementing modern compact machinery and equipment management platforms to improve project timelines while meeting stringent emission standards in key urban regions including Beijing, Shanghai, Guangzhou, and Shenzhen. The country's 14th Five-Year Plan for construction industry development creates constant demand for efficient equipment solutions, while increasing emphasis on green construction drives adoption of electric and low-emission compact machinery that enhances environmental compliance.
The expanding construction sector in Brazil demonstrates sophisticated implementation of compact equipment systems, with documented case studies showing 25-35% productivity improvements in urban residential and infrastructure projects through modern machinery adoption. The country's construction infrastructure in major producing regions, including São Paulo, Rio de Janeiro, Minas Gerais, and Rio Grande do Sul, showcases integration of compact equipment technologies with existing construction practices, leveraging expertise in large-scale housing programs and infrastructure delivery. Brazilian contractors emphasize equipment reliability and service support, creating demand for durable compact machinery sources that support operational commitments and project deadline requirements. The market maintains strong growth through focus on residential construction and public infrastructure investment, with a CAGR of 2.9% through 2035.
Key development areas:
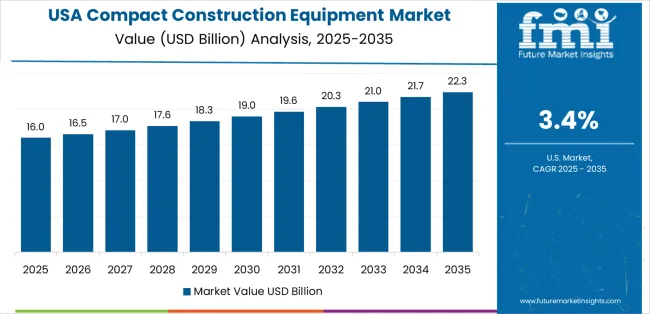
The USA market leads in advanced compact equipment innovation based on integration with telematics technologies and sophisticated equipment management systems for enhanced construction productivity. The country shows solid potential with a CAGR of 3.4% through 2035, driven by infrastructure investment and increasing rental market penetration across major construction regions, including Texas, California, Florida, and the Northeast corridor. American contractors are adopting technology-enhanced compact equipment for compliance with safety standards and emission regulations, particularly in high-density urban areas requiring efficient machinery and in regions with strict air quality mandates limiting conventional diesel equipment. Technology deployment channels through national rental chains, regional equipment dealers, and contractor direct purchase programs expand coverage across diverse construction applications.
Leading market segments:
The compact construction equipment market in Germany demonstrates sophisticated implementation focused on emission compliance systems and advanced equipment technologies, with documented integration of Stage V compliant machinery achieving 90% particulate reduction in urban construction operations. The country maintains steady growth momentum with a CAGR of 3.1% through 2035, driven by strict environmental regulations and contractors' emphasis on equipment efficiency principles aligned with green construction practices. Major construction regions, including Bavaria, North Rhine-Westphalia, Baden-Württemberg, and Berlin-Brandenburg, showcase advanced deployment of electric and hybrid compact equipment that integrates seamlessly with existing construction infrastructure and environmental protection requirements.
Key market characteristics:
In major metropolitan areas, suburban redevelopment zones, and infrastructure renewal projects, construction contractors are implementing compact equipment programs to enhance operational efficiency and meet strict urban construction standards, with documented case studies showing minimal site disruption in densely populated areas. The market shows solid growth potential with a CAGR of 2.8% through 2035, linked to ongoing urban renewal initiatives, aging infrastructure replacement requirements, and increasing focus on construction safety enhancement solutions. Japanese contractors are adopting precision compact machinery and advanced control systems to maintain project quality while complying with noise and vibration regulations in sensitive urban environments including Tokyo, Osaka, Nagoya, and Fukuoka metropolitan regions.
Market development factors:
The United Kingdom's compact construction equipment market demonstrates mature implementation focused on utilities upgrade projects and urban infill development systems, with documented integration achieving efficient construction delivery in constrained urban environments. The country maintains steady growth through infrastructure investment programs and housing development targets, with a CAGR of 2.7% through 2035, driven by comprehensive utility modernization requirements and policy support for residential construction acceleration. Major construction regions, including Southeast England, Midlands, Northwest England, and Scotland, showcase advanced compact equipment deployment where contractors integrate modern machinery with existing construction methods for enhanced productivity.
Key market characteristics:
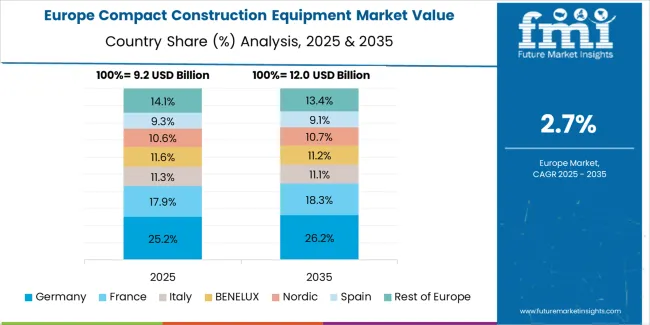
The compact construction equipment market in Europe is projected to grow from USD 10.6 billion in 2025 to USD 13.0 billion by 2035, registering a CAGR of 2.1% over the forecast period. Germany is expected to maintain its leadership position with a 22.0% market share in 2025, declining slightly to 21.5% by 2035, supported by its advanced construction infrastructure and major equipment modernization programs, including Bavaria, North Rhine-Westphalia, and Baden-Württemberg construction regions.
The United Kingdom follows with an 18.0% share in 2025, projected to reach 18.2% by 2035, driven by comprehensive utilities upgrade programs and urban infill development projects implementing efficient compact machinery. France holds a 16.0% share in 2025, expected to rise to 16.3% by 2035 through ongoing public works renewal and rental market expansion. Italy commands a 12.0% share in 2025, reaching 12.1% by 2035, backed by transport infrastructure and municipal construction projects. Spain accounts for 9.0% in 2025, rising to 9.3% by 2035 on building rehabilitation and road development programs. The Nordics and Benelux region together represent 12.0% in 2025, expanding to 12.2% by 2035 on strong eco-friendly policies adoption and smart equipment integration. The Rest of Europe region is anticipated to hold 11.0% in 2025, adjusting to 10.4% by 2035, attributed to steady compact equipment adoption across Central and Eastern European construction markets.
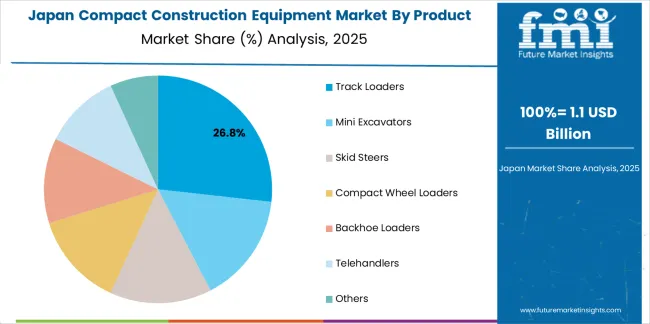
The Japanese compact construction equipment market demonstrates a mature and quality-focused landscape, characterized by sophisticated integration of track loaders and mini excavator systems with existing precision construction infrastructure across urban redevelopment operations, residential construction projects, and traditional contractor communities. Japan's emphasis on construction safety and environmental responsibility drives demand for certified compact equipment that supports eco-friendly construction commitments and quality expectations in premium domestic construction standards. The market benefits from strong partnerships between international equipment manufacturers and domestic construction associations, including contractor cooperatives, creating comprehensive service ecosystems that prioritize equipment reliability and technical support programs. Construction centers in Tokyo, Osaka, Hokkaido, and other major urban areas showcase advanced compact equipment implementations where machinery programs achieve 95% operational efficiency through precision control systems and integrated equipment management platforms.
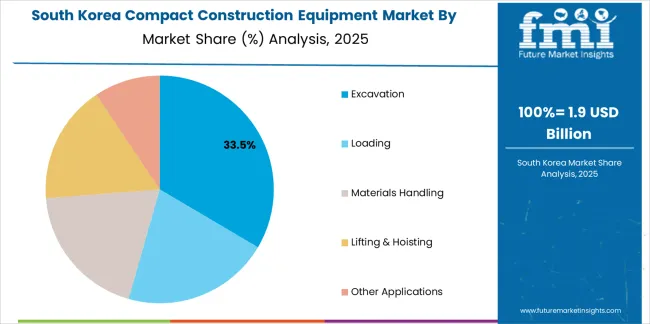
The South Korean compact construction equipment market is characterized by growing international technology provider presence, with companies maintaining significant positions through comprehensive dealer support and technical services capabilities for urban construction and high-value infrastructure applications. The market demonstrates increasing emphasis on emission-compliant equipment and technology-enhanced machinery, as Korean contractors increasingly demand certified compact equipment that integrates with domestic advanced construction management systems and sophisticated project control platforms deployed across major construction projects. Regional equipment distributors are gaining market share through strategic partnerships with international manufacturers, offering specialized services including emission certification support and application-specific equipment programs for intensive urban construction operations. The competitive landscape shows increasing collaboration between multinational equipment companies and Korean construction technology specialists, creating hybrid service models that combine international manufacturing expertise with local contractor knowledge and precision construction systems.
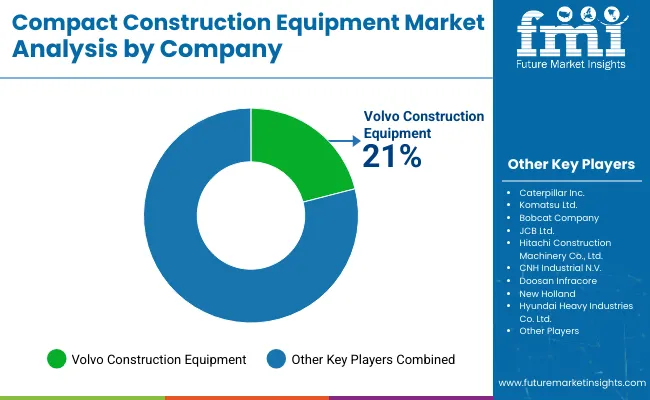
The compact construction equipment market features approximately 15-20 meaningful players with moderate concentration, where the top three companies control roughly 35-40% of global market share through established distribution networks and comprehensive product portfolios. Competition centers on equipment reliability, technology integration, and dealer support capabilities rather than price competition alone. Caterpillar Inc. leads with approximately 14% market share through its comprehensive compact equipment and construction machinery portfolio.
Market leaders include Caterpillar Inc., Komatsu Ltd., and Volvo Construction Equipment, which maintain competitive advantages through global distribution infrastructure, extensive dealer networks, and deep expertise in equipment manufacturing across multiple construction segments, creating trust and reliability advantages with contractors and rental companies. These companies leverage research and development capabilities in powertrain electrification and ongoing service support relationships to defend market positions while expanding into autonomous equipment and connectivity solutions.
Challengers encompass Bobcat Company and JCB Ltd., which compete through specialized compact equipment designs and strong regional presence in key construction markets. Product specialists, including Hitachi Construction Machinery Co., Ltd., CNH Industrial N.V., and Doosan Infracore, focus on specific equipment types or regional applications, offering differentiated capabilities in hydraulic systems, operator comfort features, and customized equipment configurations. Regional players and emerging equipment manufacturers create competitive pressure through localized production advantages and responsive service capabilities, particularly in high-growth markets including India and China, where proximity to construction sites provides advantages in delivery timelines and operator training relationships.
Compact construction equipment represents efficient machinery solutions that enable contractors to achieve 20-30% better fuel efficiency compared to full-size equipment, delivering superior productivity and operational versatility with enhanced maneuverability in demanding urban construction applications. With the market projected to grow from USD 35.6 billion in 2025 to USD 48.2 billion by 2035 at a 3.1% CAGR, these versatile machinery systems offer compelling advantages - operational efficiency, reduced site disruption, and environmental compliance opportunities - making them essential for excavation operations (34.0% market share), loading applications (26.0% share), and construction projects seeking alternatives to conventional full-size equipment that cannot access confined urban sites.
How Governments Could Spur Local Production and Adoption?
How Industry Bodies Could Support Market Development?
How OEMs and Technology Players Could Strengthen the Ecosystem?
How Suppliers Could Navigate the Shift?
How Investors and Financial Enablers Could Unlock Value?
| Item | Value |
|---|---|
| Quantitative Units | USD 35.6 billion |
| Product Type | Track Loaders, Mini Excavators, Skid Steers, Compact Wheel Loaders, Backhoe Loaders, Telehandlers, Others |
| Power Output | <100 HP, 101-200 HP, 201-400 HP, >400 HP |
| Application | Excavation, Loading, Materials Handling, Lifting & Hoisting, Other Applications |
| Engine Capacity | <5L, 5-10L, >10L |
| Regions Covered | Asia Pacific, Europe, North America, Latin America, Middle East & Africa |
| Country Covered | India, China, USA, Germany, Brazil, Japan, United Kingdom, and 40+ countries |
| Key Companies Profiled | Caterpillar Inc., Komatsu Ltd., Volvo Construction Equipment, Bobcat Company, JCB Ltd., Hitachi Construction Machinery Co., Ltd., CNH Industrial N.V., Doosan Infracore, Hyundai Construction Equipment, Kubota Corporation |
| Additional Attributes | Dollar sales by product type, power output, application, and engine capacity categories, regional adoption trends across Asia Pacific, North America, and Europe, competitive landscape with equipment manufacturers and distribution networks, technology requirements and specifications, integration with construction management platforms and equipment tracking systems, innovations in electrification technology and autonomous systems, and development of specialized compact equipment with enhanced productivity and environmental compliance capabilities. |
The global compact construction equipment market is estimated to be valued at USD 35.6 billion in 2025.
The market size for the compact construction equipment market is projected to reach USD 48.3 billion by 2035.
The compact construction equipment market is expected to grow at a 3.1% CAGR between 2025 and 2035.
The key product types in compact construction equipment market are track loaders , mini excavators, skid steers, compact wheel loaders, backhoe loaders, telehandlers and others.
In terms of application, excavation segment to command 34.0% share in the compact construction equipment market in 2025.


Full Research Suite comprises of:
Market outlook & trends analysis
Interviews & case studies
Strategic recommendations
Vendor profiles & capabilities analysis
5-year forecasts
8 regions and 60+ country-level data splits
Market segment data splits
12 months of continuous data updates
DELIVERED AS:
PDF EXCEL ONLINE
Examining Market Share Trends in Compact Construction Equipment
USA Compact Construction Equipment Market Trends – Growth, Demand & Forecast 2025–2035
Japan Compact Construction Equipment Market Insights – Demand, Size & Industry Trends 2025–2035
ASEAN Compact Construction Equipment Market Analysis – Size, Share & Forecast 2025–2035
Germany Compact Construction Equipment Market Outlook – Share, Growth & Forecast 2025–2035
Gulf Countries Compact Construction Equipment Market Report – Trends, Demand & Industry Forecast 2025–2035
United Kingdom Compact Construction Equipment Market Growth – Trends, Demand & Innovations 2025–2035
Compact Pneumatic Pressure Sensor Market Size and Share Forecast Outlook 2025 to 2035
Compact Resin Type Silencer Market Size and Share Forecast Outlook 2025 to 2035
Compact Loader Market Size and Share Forecast Outlook 2025 to 2035
Compact Wheel Loaders Market Size and Share Forecast Outlook 2025 to 2035
Compact Recloser Replacement Market Size and Share Forecast Outlook 2025 to 2035
Compact Pick-up Trucks Market Size and Share Forecast Outlook 2025 to 2035
Compact Track and Multi-Terrain Loader Market Size and Share Forecast Outlook 2025 to 2035
Compacted Graphite Iron Market Size and Share Forecast Outlook 2025 to 2035
Compact Utility Vehicles Market Growth - Trends & Forecast 2025 to 2035
Compaction Machines Market Growth - Trends & Forecast 2025 to 2035
Compact E-Scooter Market Growth - Trends & Forecast 2024 to 2034
Compact Road Sweepers Market
Compaction equipment Market

Thank you!
You will receive an email from our Business Development Manager. Please be sure to check your SPAM/JUNK folder too.
Chat With
MaRIA