The construction anchor market is valued at USD 14.7 billion in 2025 and is projected to reach USD 26.3 billion by 2035, rising at a 6.0% CAGR, adding USD 11.6 billion in total. The scale and pace of expansion align with consistent construction industry evolution across commercial, residential, and infrastructure sectors, where anchor performance influences structural safety, building code compliance, and long-term durability. Between 2025 and 2030, the market increases to USD 19.7 billion, contributing 43.1% of decade growth as contractors adopt advanced fastening systems and upgrade structural connection methods. The larger 56.9% contribution during 2030-2035 reflects deeper integration of high-performance materials, enhanced corrosion resistance technologies, and seismic-compliant fastening protocols supporting critical applications in high-rise construction, bridge infrastructure, and specialized industrial facilities.
Anchor type segmentation reinforces these performance priorities: mechanical anchors hold ~55% share due to superior installation reliability and established structural engineering acceptance workflows, while chemical anchors at ~30% offer high-strength bonding capabilities in applications requiring post-installed connections or challenging substrate conditions within concrete and masonry structures. By application, commercial construction leads with ~45%, followed by residential construction at ~30% and infrastructure at ~20%, reflecting widespread adoption across office buildings, housing developments, and transportation projects.
Geographically, the market is led by USA (6.5% CAGR) and China (6.8% CAGR), supported by construction sector stability, infrastructure investment programs, and building safety regulation enhancement. Germany (5.8%) and Japan (5.4%) sustain growth through precision anchor technology development and high-quality manufacturing capabilities, while India (7.2%), Canada (5.9%), and Australia (5.6%) grow through construction market expansion rather than replacement demand alone. Competitive structure remains moderately consolidated, with Hilti Corporation, Simpson Strong-Tie, and Würth Group collectively holding 35-45% share, while regional manufacturers such as Powers Fasteners, MKT Fastening, and Fischer Fixings compete through specialized anchor configurations, competitive pricing strategies, and contractor relationship networks near major construction and infrastructure markets.
Manufacturing operations producing mechanical and adhesive anchor systems face supply chain complexities around raw material sourcing and component compatibility requirements. Production teams manage multiple product lines to serve different seismic design categories while maintenance departments coordinate equipment calibration schedules with validation testing timelines. Engineering staff develop anchor designs that comply with evolving strength design methodologies while regulatory affairs teams navigate changing acceptance criteria across various building code cycles.
Regulatory shifts toward strength design methodologies create operational tensions between traditional installation practices and emerging testing requirements. Companies adapt existing manufacturing processes while training departments develop certification programs for installation personnel. Engineering teams coordinate software development for design calculations while field operations implement new inspection protocols that affect both productivity metrics and compliance verification timelines.
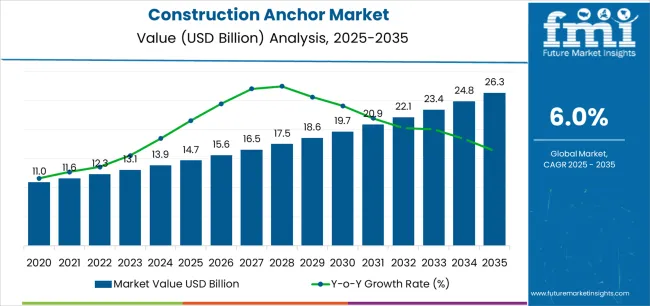
| Metric | Value |
|---|---|
| Estimated Value in (2025E) | USD 14.7 billion |
| Forecast Value in (2035F) | USD 26.3 billion |
| Forecast CAGR (2025 to 2035) | 6.0% |
From 2030 to 2035, the market is forecast to grow from USD 19.7 billion to USD 26.3 billion, adding another USD 6.6 billion, which constitutes 56.9% of the overall ten-year expansion. This period is expected to be characterized by the expansion of renewable energy balance-of-plant anchoring requirements, the development of advanced corrosion-resistant and temperature-rated anchor systems, and the growth of retrofit and façade remediation programs driven by building safety regulations and energy efficiency mandates. The growing adoption of digital design software and BIM integration for anchor specification will drive demand for construction anchors with enhanced technical documentation and performance validation.
Between 2020 and 2025, the construction anchor market experienced steady growth, driven by increasing building code stringency and growing recognition of construction anchors as essential structural components for ensuring connection safety and load-bearing capacity in diverse building, infrastructure, and industrial installation applications. The market developed as structural engineers and construction professionals recognized the potential for advanced anchoring technology to improve structural integrity, enable post-installed connections in existing structures, and support seismic resilience objectives while meeting stringent safety requirements. Technological advancement in adhesive formulations and mechanical anchor designs began emphasizing the critical importance of maintaining reliable performance in cracked concrete and challenging installation conditions.
Market expansion is being supported by the increasing global infrastructure investment and building renovation activity driven by urbanization trends and aging infrastructure replacement needs, alongside the corresponding demand for advanced fastening technologies that can ensure structural safety, enable post-installed connections, and maintain load-bearing capacity across various new construction, retrofit, civil engineering, and MEP installation applications. Modern construction professionals and facility managers are increasingly focused on implementing anchor solutions that can meet updated building codes, provide seismic resistance, and deliver reliable long-term performance in demanding structural conditions.
The growing emphasis on seismic safety and structural resilience is driving demand for construction anchors that can support cracked concrete performance, enable high-load capacity connections, and ensure comprehensive code compliance with regional building standards. Construction industry preference for fastening solutions that combine structural reliability with installation efficiency and corrosion resistance is creating opportunities for innovative construction anchor implementations. The rising influence of renewable energy infrastructure development and façade safety regulations is also contributing to increased adoption of construction anchors that can provide superior holding power without compromising installation flexibility or long-term durability.
The market is segmented by product type, application, sales channel, and region. By product type, the market is divided into chemical anchors (including injectable adhesive anchors and capsule adhesive anchors), metal anchors (including wedge anchors, concrete screws, sleeve & nail anchors, drop-in anchors, undercut anchors, and cast-in anchors), and light-duty anchors (including nylon plugs, drywall plugs, drywall screws, insulation anchors, and metal screws). Based on application, the market is categorized into building construction (including residential superstructure & interiors, commercial & institutional, and industrial buildings), civil engineering (including bridges & transportation, energy & utilities, and water & wastewater), construction installation/MEP/fit-out (including HVAC & electrical, façade & roofing, and process & plant installs), and DIY/repair. By sales channel, the market includes distributor sales (general building materials distributors and specialty fastener dealers), direct sales (project/specification sales and OEM/industrial), retail & home centers (big-box retail and pro desk/trade counters), and online sales (B2B marketplaces and brand webstores). Regionally, the market is divided into Asia Pacific, North America, Europe, Middle East & Africa, and Latin America.
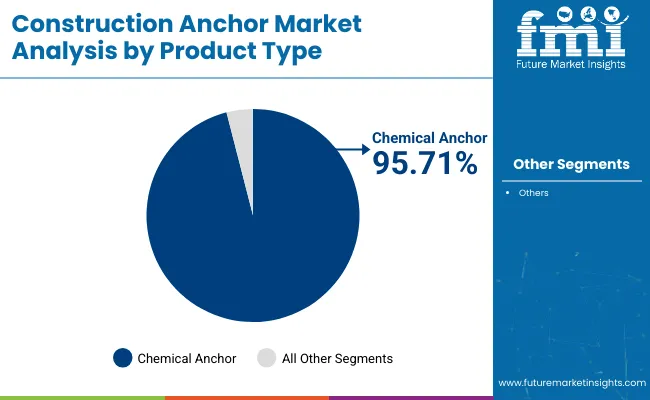
The chemical anchors segment is projected to maintain its leading position in the construction anchor market in 2025 with a 56.0% market share, reaffirming its role as the preferred product category for high-load structural connections, seismic applications, and cracked concrete installations. Construction professionals and structural engineers increasingly utilize chemical anchors for their superior load-bearing characteristics, excellent versatility in various base materials, and proven effectiveness in meeting stringent seismic code requirements while providing reliable performance in challenging installation conditions. Chemical anchor technology's proven effectiveness and application versatility directly address the construction industry requirements for post-installed connections and structural retrofitting across diverse building types and infrastructure projects.
This product segment forms the foundation of modern structural fastening, as it represents the technology with the greatest contribution to seismic safety improvements and established performance record across multiple construction applications and structural scenarios. With regulatory pressures requiring enhanced structural safety and improved seismic resistance, chemical anchors align with both safety objectives and performance requirements, making them the central component of comprehensive structural connection strategies.
The metal anchors segment maintains a 38.0% market share, serving applications requiring mechanical expansion or direct embedment in concrete substrates. Within this segment, wedge anchors hold 11.4%, concrete screws account for 9.5%, sleeve & nail anchors represent 5.7%, drop-in anchors comprise 4.6%, undercut anchors hold 3.8%, and cast-in anchors account for 3.0% of the total market. Light-duty anchors capture 6.0% market share, primarily serving non-structural applications in drywall, masonry, and insulation installations, with nylon plugs at 2.1%, drywall plugs at 1.5%, drywall screws at 1.2%, insulation anchors at 0.6%, and metal screws at 0.6%.
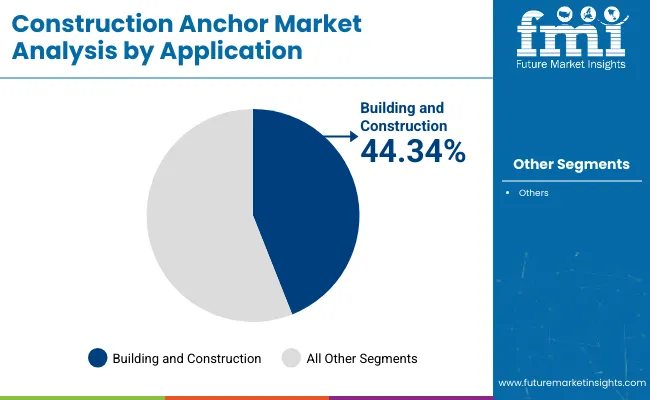
The building construction application segment is projected to represent the largest share of construction anchor demand in 2025 with a 44.3% market share, underscoring its critical role as the primary driver for anchor adoption across residential housing, commercial buildings, and industrial facilities. Construction contractors prefer construction anchors for building applications due to their exceptional structural connection capabilities, building code compliance benefits, and ability to support diverse attachment requirements while ensuring safety standards and long-term reliability. Positioned as essential components for modern building construction, construction anchors offer both structural integrity advantages and installation flexibility benefits.
The segment is supported by continuous innovation in anchor design and the growing availability of code-compliant anchor systems that enable superior structural performance with enhanced installation efficiency and comprehensive technical documentation. The construction companies are investing in comprehensive anchor specification programs to support increasingly stringent building codes and seismic design requirements. Within building construction, residential superstructure & interiors represent 18.5%, commercial & institutional account for 17.2%, and industrial buildings comprise 8.6% of market demand.
Civil engineering applications represent 29.0% of market demand, driven by infrastructure projects including transportation structures, utility installations, and water treatment facilities. Within this segment, bridges & transportation account for 11.6%, energy & utilities represent 9.5%, and water & wastewater comprise 7.9%. Construction installation/MEP/fit-out holds 20.0% market share, encompassing mechanical, electrical, and plumbing installations as well as façade and roofing systems, with HVAC & electrical at 11.2%, façade & roofing at 5.0%, and process & plant installs at 3.8%. DIY/repair applications comprise 6.7% of market demand, serving homeowner and maintenance applications requiring accessible fastening solutions.
The construction anchor market is advancing steadily due to increasing demand for infrastructure renewal and seismic retrofit projects driven by aging infrastructure and updated building codes, and growing adoption of renewable energy installations that require specialized heavy-duty anchoring systems providing enhanced load capacity and long-term durability across diverse building construction, civil engineering, MEP installation, and renovation applications. The market faces challenges, including installation complexity requiring trained personnel and proper application knowledge, counterfeit products compromising safety and market reputation, and price competition from low-quality alternatives lacking proper certifications. Innovation in low-VOC adhesive formulations and digital specification tools continues to influence product development and market expansion patterns.
The growing emphasis on infrastructure modernization and transportation network expansion is driving demand for specialized construction anchor solutions that address critical structural requirements including bridge rehabilitation, tunnel construction, railway electrification, and highway barrier installations requiring high-load capacity and seismic performance. Infrastructure agencies face extensive backlogs of aging structures requiring retrofit and strengthening projects where post-installed anchoring provides the primary connection method for structural reinforcement. Construction professionals and engineers are increasingly recognizing the essential role of ETA-assessed anchor systems for meeting structural safety requirements and ensuring long-term infrastructure reliability, creating opportunities for certified anchor products specifically designed for demanding civil engineering applications and code-compliant structural connections.
Modern construction anchor manufacturers are incorporating digital specification tools and Building Information Modeling integration to enhance design accuracy, streamline anchor selection, and support comprehensive structural engineering workflows through automated code checking and load calculation capabilities. Leading companies are developing software modules with anchor selection algorithms, implementing BIM-compatible product data libraries, and advancing technologies that integrate anchor specifications into coordinated construction documentation. These technologies improve design efficiency while enabling new market opportunities, including integrated structural analysis, automated bill of materials generation, and digital construction documentation. Advanced digital integration also allows structural engineers to support comprehensive project delivery objectives and design optimization beyond traditional manual specification approaches.
The expansion of coastal construction projects, industrial facility installations, and desert climate applications is driving demand for construction anchors with enhanced corrosion resistance, extreme temperature performance, and environmental durability that exceed standard anchor specifications. These advanced anchor systems incorporate stainless steel materials, specialized coatings, and temperature-stable adhesive formulations that address harsh environmental conditions, creating premium market segments with differentiated performance propositions. Manufacturers are investing in material science development and third-party testing validation to serve demanding environmental applications while supporting long-term structural reliability in challenging exposure conditions.
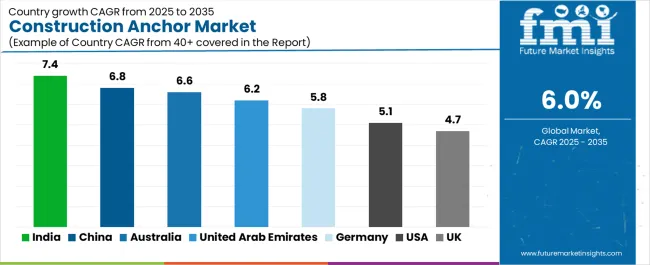
| Country | CAGR (2025-2035) |
|---|---|
| India | 7.4% |
| China | 6.8% |
| Australia | 6.6% |
| United Arab Emirates | 6.2% |
| Germany | 5.8% |
| United States | 5.1% |
| United Kingdom | 4.7% |
The construction anchor market is experiencing solid growth globally, with India leading at a 7.4% CAGR through 2035, driven by large pipeline of transport corridors, industrial parks, and housing programs, alongside increasing seismic-rated anchoring requirements in updated building code provisions. China follows at 6.8%, supported by smart city construction and retrofit programs, extensive utility-scale energy projects needing heavy-duty anchoring systems, and comprehensive infrastructure modernization initiatives. Australia shows growth at 6.6%, emphasizing strong non-residential construction activity and resources sector projects requiring coastal corrosion-resistant specifications. The United Arab Emirates demonstrates 6.2% growth, supported by tourism and logistics megaprojects and premium corrosion/temperature-rated systems for desert climate conditions. Germany records 5.8%, focusing on renovation of public assets and industrial brownfield upgrades with high adoption of ETA-assessed anchor systems. The United States exhibits 5.1% growth, emphasizing infrastructure renewal and resilience programs alongside wind and solar balance-of-plant anchoring demand. The United Kingdom shows 4.7% growth, supported by retrofit focus for safety and energy efficiency and façade remediation programs.
The report covers an in-depth analysis of 40+ countries, Top-performing countries are highlighted below.
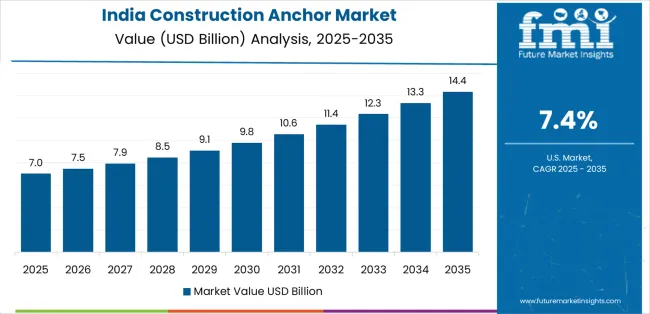
The construction anchors market in India is projected to exhibit exceptional growth with a CAGR of 7.4% through 2035, driven by extensive transport corridor development pipeline and rapidly expanding industrial parks and housing programs supported by government infrastructure investment initiatives and urbanization acceleration. The country's massive construction activity and increasing adoption of seismic design provisions are creating substantial demand for construction anchor solutions. Major fastening manufacturers and construction material suppliers are establishing comprehensive anchor distribution capabilities to serve both infrastructure projects and residential construction markets.
The construction anchors market in China is expanding at a CAGR of 6.8%, supported by the country's comprehensive smart city construction and building retrofit programs, extensive utility-scale renewable energy projects requiring specialized heavy-duty anchoring, and large-scale infrastructure development initiatives driven by government urbanization policies and energy transition objectives. The country's coordinated infrastructure investment and technological advancement are driving sophisticated construction anchor capabilities throughout building and energy sectors. Leading construction material manufacturers and international anchor companies are establishing extensive production and distribution facilities to address growing domestic demand.
The construction anchors industry in Australia is expanding at a CAGR of 6.6%, supported by the country's robust non-residential construction activity, extensive resources sector infrastructure projects, and stringent coastal corrosion-resistant specification requirements. The nation's demanding environmental conditions and high construction standards are driving sophisticated construction anchor capabilities throughout commercial and industrial sectors. Leading international anchor manufacturers and local distributors are investing extensively in technical support and code-compliant product offerings.
Revenue from construction anchors in the United Arab Emirates is expanding at a CAGR of 6.2%, supported by the country's ambitious tourism and logistics megaproject pipeline, premium construction specifications, and specialized corrosion/temperature-rated system requirements for extreme desert climate conditions. The nation's world-class construction projects and quality expectations are driving demand for high-performance construction anchor solutions. International anchor manufacturers and regional distributors are investing in technical capabilities for demanding specification requirements.
Revenue from construction anchors in Germany is expanding at a CAGR of 5.8%, driven by the country's comprehensive renovation of public assets and industrial brownfield upgrade programs, high adoption rates of ETA-assessed anchor systems, and stringent building code compliance requirements supporting certified fastening solutions. Germany's engineering standards and quality consciousness are driving sophisticated construction anchor capabilities throughout renovation and industrial sectors. Leading European anchor manufacturers are establishing comprehensive technical support programs for next-generation anchor technologies.
Revenue from construction anchors in the United States is growing at a CAGR of 5.1%, driven by the country's comprehensive infrastructure renewal and resilience programs, expanding wind and solar balance-of-plant anchoring requirements, and federal funding supporting transportation and utility infrastructure modernization. The US construction market maturity and code sophistication are supporting investment in advanced construction anchor technologies. Major construction distributors and anchor manufacturers are establishing programs addressing infrastructure investment opportunities.
Revenue from construction anchors in the United Kingdom is expanding at a CAGR of 4.7%, supported by the country's comprehensive retrofit focus for building safety and energy efficiency, extensive façade remediation programs following building safety legislation, and renovation activity addressing aging building stock. The UK's building safety priorities and retrofit market are driving demand for specialized construction anchor solutions. Construction material distributors and anchor suppliers are investing in technical support for retrofit and remediation applications.
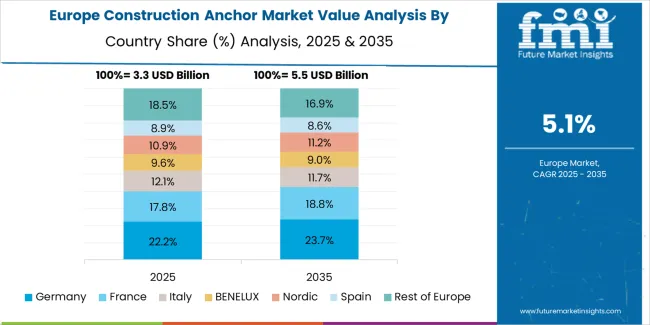
The market in Europe is projected to grow from USD 4.3 billion in 2025 to USD 7.3 billion by 2035, registering a CAGR of 5.5% over the forecast period. Germany is expected to retain leadership with a 22.0% market share in 2025, maintaining approximately 22.0% through 2035, supported by renovation intensity, industrial facility upgrades, and high adoption of ETA/CE-marked anchor systems across construction sectors.
The United Kingdom holds 15.0% in 2025, driven by retrofit and remediation programs addressing building safety and energy efficiency mandates. France accounts for 13.0%, supported by infrastructure renewal and building renovation activities. Italy stands at 12.0%, driven by seismic retrofit requirements and building restoration projects. Spain represents 9.0%, supported by infrastructure investment and commercial construction activity. Nordics account for 8.0%, reflecting advanced construction standards and infrastructure maintenance programs. Benelux holds 6.0%, driven by industrial construction and port facility development. Central & Eastern Europe (including Poland, Czech Republic, Hungary, and Romania) collectively represents 15.0%, reflecting accelerated infrastructure development, EU-funded construction programs, and growing adoption of certified anchor systems across modernization projects throughout the region.
The Construction Anchor Market continues to expand as global building activity accelerates and safety standards become more rigorous across residential, commercial, and infrastructure projects. Anchors are essential for securing structural and non-structural components to concrete, masonry, and steel, and demand is rising alongside growth in high-rise construction, industrial facilities, and retrofitting projects. With stricter seismic design codes and the need for higher load-bearing capacity, manufacturers are investing in advanced fastening technologies, improved corrosion resistance, and easier installation systems.
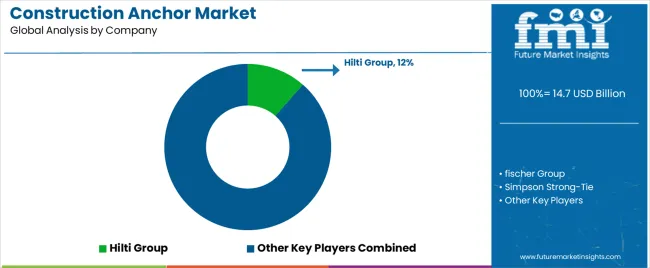
Hilti Group, fischer Group, and Simpson Strong-Tie remain industry frontrunners, offering a broad portfolio that spans mechanical anchors, chemical anchors, and heavy-duty fastening systems. Their focus on engineering reliability, digital installation tools, and onsite technical support keeps them central to large infrastructure and commercial developments. Stanley Black & Decker (Powers/DEWALT) and ITW (Ramset/Red Head) continue to strengthen their presence through contractor-focused solutions designed for rapid installation and consistent performance across demanding jobsite conditions.
European specialists like EJOT, Rawlplug, and Würth Group bring strong expertise in fastening technology, serving both structural applications and high-volume residential construction. Meanwhile, MKT Fastening and Sika are carving out space with chemical anchoring systems and high-strength bonding technologies that support increasingly complex construction requirements. As global construction evolves toward higher safety expectations and faster build cycles, advanced anchor systems are becoming integral to modern project execution.
Construction anchors represent a critical structural fastening technology segment within building construction, civil engineering, and industrial installation applications, projected to grow from USD 14.7 billion in 2025 to USD 26.3 billion by 2035 at a 6.0% CAGR. These essential fastening systems-encompassing chemical, mechanical, and light-duty anchor configurations for diverse substrates-serve as critical structural components in post-installed connections, seismic applications, and load-bearing attachments where structural integrity, code compliance, and long-term reliability are essential. Market expansion is driven by increasing infrastructure renewal programs, growing seismic safety requirements, expanding renewable energy installations, and rising emphasis on corrosion-resistant and temperature-rated specifications across diverse construction and industrial sectors.
How Building Regulators Could Strengthen Safety Standards and Certification Requirements?
How Industry Associations Could Advance Installation Standards and Technical Education?
How Construction Anchor Manufacturers Could Drive Innovation and Market Leadership?
How Construction Professionals Could Optimize Anchor Selection and Installation Quality?
How Research Institutions Could Enable Technology Advancement?
How Investors and Financial Enablers Could Support Market Growth and Innovation?
| Items | Values |
|---|---|
| Quantitative Units (2025) | USD 14.7 billion |
| Product Type | Chemical Anchors (Injectable Adhesive Anchors, Capsule Adhesive Anchors), Metal Anchors (Wedge Anchors, Concrete Screws, Sleeve & Nail Anchors, Drop-in Anchors, Undercut Anchors, Cast-in Anchors), Light-duty Anchors (Nylon Plugs, Drywall Plugs, Drywall Screws, Insulation Anchors, Metal Screws) |
| Application | Building Construction (Residential Superstructure & Interiors, Commercial & Institutional, Industrial Buildings), Civil Engineering (Bridges & Transportation, Energy & Utilities, Water & Wastewater), Construction Installation/MEP/Fit-out (HVAC & Electrical, Façade & Roofing, Process & Plant Installs), DIY/Repair |
| Sales Channel | Distributor Sales (General Building Materials Distributors, Specialty Fastener Dealers), Direct Sales (Project/Specification Sales, OEM/Industrial), Retail & Home Centers (Big-box Retail, Pro Desk/Trade Counters), Online Sales (B2B Marketplaces, Brand Webstores) |
| Regions Covered | Asia Pacific, North America, Europe, Middle East & Africa, Latin America |
| Countries Covered | India, China, Australia, United Arab Emirates, Germany, United States, United Kingdom, and 40+ countries |
| Key Companies Profiled | Hilti Group, fischer Group, Simpson Strong-Tie, Stanley Black & Decker (Powers/DEWALT), ITW (Ramset/Red Head), EJOT, Rawlplug, Würth Group, MKT Fastening, Sika |
| Additional Attributes | Dollar sales by product type, application category, and sales channel segments, regional demand trends, competitive landscape, technological advancements in adhesive formulations, seismic testing and certification, digital specification tools, and corrosion-resistant materials |
The global construction anchor market is estimated to be valued at USD 14.7 billion in 2025.
The market size for the construction anchor market is projected to reach USD 26.3 billion by 2035.
The construction anchor market is expected to grow at a 6.0% CAGR between 2025 and 2035.
The key product types in construction anchor market are chemical anchors , metal anchors and light-duty anchors .
In terms of application, building construction segment to command 44.3% share in the construction anchor market in 2025.


Our Research Products

The "Full Research Suite" delivers actionable market intel, deep dives on markets or technologies, so clients act faster, cut risk, and unlock growth.

The Leaderboard benchmarks and ranks top vendors, classifying them as Established Leaders, Leading Challengers, or Disruptors & Challengers.

Locates where complements amplify value and substitutes erode it, forecasting net impact by horizon

We deliver granular, decision-grade intel: market sizing, 5-year forecasts, pricing, adoption, usage, revenue, and operational KPIs—plus competitor tracking, regulation, and value chains—across 60 countries broadly.

Spot the shifts before they hit your P&L. We track inflection points, adoption curves, pricing moves, and ecosystem plays to show where demand is heading, why it is changing, and what to do next across high-growth markets and disruptive tech

Real-time reads of user behavior. We track shifting priorities, perceptions of today’s and next-gen services, and provider experience, then pace how fast tech moves from trial to adoption, blending buyer, consumer, and channel inputs with social signals (#WhySwitch, #UX).

Partner with our analyst team to build a custom report designed around your business priorities. From analysing market trends to assessing competitors or crafting bespoke datasets, we tailor insights to your needs.
Supplier Intelligence
Discovery & Profiling
Capacity & Footprint
Performance & Risk
Compliance & Governance
Commercial Readiness
Who Supplies Whom
Scorecards & Shortlists
Playbooks & Docs
Category Intelligence
Definition & Scope
Demand & Use Cases
Cost Drivers
Market Structure
Supply Chain Map
Trade & Policy
Operating Norms
Deliverables
Buyer Intelligence
Account Basics
Spend & Scope
Procurement Model
Vendor Requirements
Terms & Policies
Entry Strategy
Pain Points & Triggers
Outputs
Pricing Analysis
Benchmarks
Trends
Should-Cost
Indexation
Landed Cost
Commercial Terms
Deliverables
Brand Analysis
Positioning & Value Prop
Share & Presence
Customer Evidence
Go-to-Market
Digital & Reputation
Compliance & Trust
KPIs & Gaps
Outputs
Full Research Suite comprises of:
Market outlook & trends analysis
Interviews & case studies
Strategic recommendations
Vendor profiles & capabilities analysis
5-year forecasts
8 regions and 60+ country-level data splits
Market segment data splits
12 months of continuous data updates
DELIVERED AS:
PDF EXCEL ONLINE
Construction Anchor Industry Analysis in United Kingdom Size and Share Forecast Outlook 2025 to 2035
Construction Anchor Market Growth – Trends & Forecast 2024-2034
Construction Material Testing Equipment Market Size and Share Forecast Outlook 2025 to 2035
Construction Site Surveillance Robots Market Analysis - Size, Share, and Forecast Outlook 2025 to 2035
Construction Wearable Technology Market Size and Share Forecast Outlook 2025 to 2035
Construction Equipment Fleet Management Software Market Size and Share Forecast Outlook 2025 to 2035
Construction Risk Assessment Software Market Size and Share Forecast Outlook 2025 to 2035
Construction Repair Composites Market Size and Share Forecast Outlook 2025 to 2035
Construction Prime Power Generators Market Size and Share Forecast Outlook 2025 to 2035
Construction Waste Market Size and Share Forecast Outlook 2025 to 2035
Construction Design Software Market Size and Share Forecast Outlook 2025 to 2035
Construction Accounting Software Market Size and Share Forecast Outlook 2025 to 2035
Construction Management Software Market Size and Share Forecast Outlook 2025 to 2035
Construction Punch List Software Market Size and Share Forecast Outlook 2025 to 2035
Construction ERP Software Market Size and Share Forecast Outlook 2025 to 2035
Construction Textile Market Size and Share Forecast Outlook 2025 to 2035
Construction Worker Safety Market Size and Share Forecast Outlook 2025 to 2035
Construction Software As A Service Market Size and Share Forecast Outlook 2025 to 2035
Construction Valve Seat Insert Market Size and Share Forecast Outlook 2025 to 2035
Construction Telemetry Market Size and Share Forecast Outlook 2025 to 2035

Thank you!
You will receive an email from our Business Development Manager. Please be sure to check your SPAM/JUNK folder too.
Chat With
MaRIA