The global small satellite market is likely to expand from USD 6,654.7 million in 2025 to approximately USD 21,997.2 million by 2035, recording an absolute increase of USD 15,342.5 million over the forecast period. This translates into a total growth of 230.6%, with the market forecast to expand at a CAGR of 12.7% between 2025 and 2035.
The market size is expected to grow by nearly 3.3X during the same period, supported by increasing global demand for satellite-based connectivity solutions, growing adoption of constellation deployment strategies in space infrastructure, and rising commercial space economy requirements driving comprehensive small satellite procurement across various orbital applications.
| Metric | Value |
|---|---|
| Market Value (2025) | USD 6,654.7 million |
| Market Forecast Value (2035) | USD 21,997.2 million |
| Forecast CAGR (2025-2035) | 12.7% |
| Space Economy Democratization | Constellation Deployment Strategies | Commercial Space Infrastructure |
|---|---|---|
| Global Space Access Expansion Continuous expansion of space capabilities across established and emerging nations driving demand for cost-effective satellite solutions. Launch Cost Reduction Growing emphasis on rideshare launches and reusable rockets creating demand for standardized small satellite platforms. Technology Miniaturization Superior capability density and mass efficiency making small satellites essential for diverse space applications. | Sophisticated Mission Requirements Modern space operations require satellite platforms delivering precise data collection and enhanced constellation coordination. Rapid Deployment Demands Space operators investing in mass-produced satellites offering consistent performance while maintaining cost efficiency. Quality and Reliability Standards Certified manufacturers with proven track records required for critical space infrastructure applications. | Space Mission Standards Regulatory requirements establishing performance benchmarks favoring reliable small satellite solutions. Orbital Debris Management Sustainability standards requiring superior deorbiting capabilities and resistance to space environment degradation. Frequency Coordination Requirements Diverse operational requirements and spectrum standards driving need for sophisticated satellite communication capabilities. |
| Category | Segments Covered |
|---|---|
| By Satellite Type | Picosatellites, Minisatellite, Microsatellite, CubeSats, Femtosatellites |
| By Orbit Type | Low Earth Orbit (LEO), Medium Earth Orbit (MEO), Geosynchronous Orbit (GEO) |
| By Application | Military Intelligence, Communication and Navigation, Earth Observation, Remote Sensing, Scientific Research & Exploration |
| By Region | North America, Europe, Asia Pacific, Latin America, Middle East & Africa |
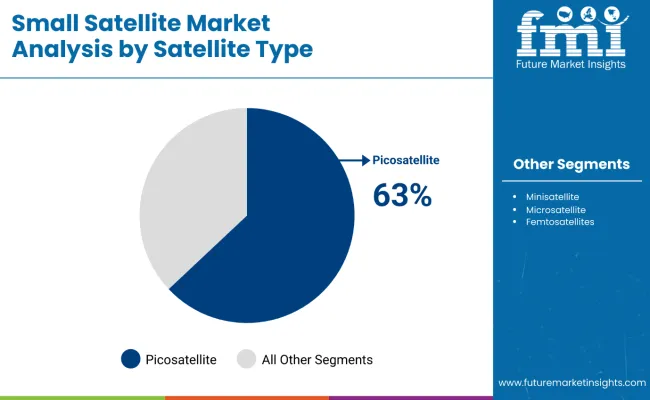
| Segment | 2025 to 2035 Outlook |
|---|---|
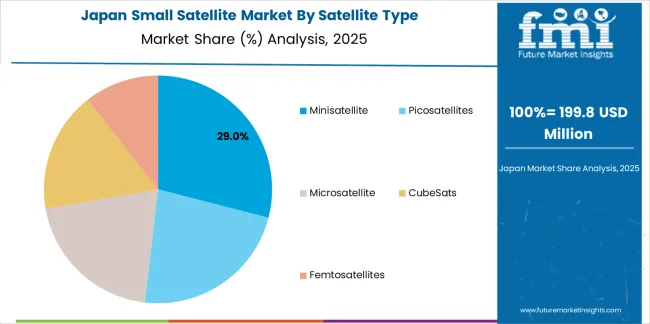
| Minisatellite | Leader in 2025 with 28% market share; likely to maintain leadership through 2035. Broadest use across military reconnaissance, high-resolution Earth observation, and advanced communication applications with mature supply chain and established orbital infrastructure. Mass range of 100-500 kg enables sophisticated payload accommodation while maintaining launch flexibility. Momentum: steady-to-strong growth driven by defense modernization and commercial Earth observation expansion. Watchouts: competition from microsatellite capability advancement and constellation economics favoring smaller platforms. |
| Microsatellite | Strong segment with 26% share, offering optimal balance between capability and cost for constellation deployment. Mass range of 10-100 kg supports meaningful sensor payloads while enabling multi-satellite launch opportunities. Critical for Internet of Things connectivity, narrowband communications, and moderate-resolution imaging. Momentum: rising strongly through 2030 driven by LEO constellation deployment and commercial communication services. Watchouts: technology complexity versus CubeSat standards and custom design costs limiting rapid scaling. |
| CubeSats | Revolutionary segment with 23% share, characterized by standardized 10 cm cubic unit form factor enabling mass production and educational access. Originally limited to technology demonstration but increasingly capable for commercial remote sensing and scientific missions. Momentum: strongest growth trajectory driven by standardization benefits, educational programs, and technology miniaturization enabling advanced capabilities in compact formats. Watchouts: payload volume constraints limiting certain applications and orbital lifetime limitations in low-altitude deployments. |
| Femtosatellites | Emerging segment with 14% share, representing ultra-small satellites below 100 grams enabling swarm applications and distributed sensing architectures. Experimental category with limited current commercial deployment but significant future potential. Momentum: selective growth in technology demonstration and novel mission concepts including atmospheric sensing and space environment monitoring. Watchouts: severely constrained capabilities, communication challenges, and uncertain regulatory frameworks for large swarm deployments. |
| Picosatellites | Specialized segment with 9% share, covering satellites in 0.1-1 kg mass range including multi-unit CubeSat configurations. Bridge between femtosatellites and microsatellites enabling meaningful missions with standardized deployment systems. Momentum: moderate growth concentrated in educational missions, technology validation, and low-cost commercial experiments. Watchouts: capability limitations versus larger platforms and crowded market segment with intense competition. |
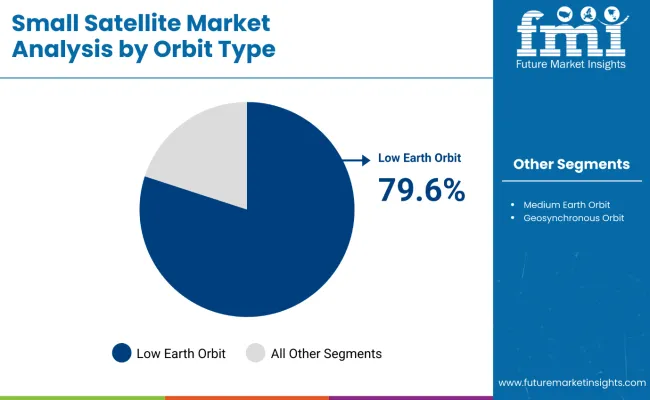
| Segment | 2025 to 2035 Outlook |
|---|---|
| Low Earth Orbit (LEO) | At 79.6%, dominant orbit type in 2025 with established advantages for Earth observation, communications latency reduction, and constellation deployment economics. Altitude range of 300-2,000 km enables high-resolution imaging and reduced communication delays critical for broadband services. Launch cost advantages and shorter mission development cycles favor LEO for commercial applications. Momentum: strongest growth driven by mega-constellation deployment including Starlink, OneWeb, and emerging competitors pursuing global broadband coverage. Watchouts: orbital debris concerns, atmospheric drag requiring propulsion, and spectrum congestion in popular orbital shells. |
| Medium Earth Orbit (MEO) | Established segment with 12.2% share, serving navigation satellite constellations including GPS, Galileo, and BeiDou. Altitude around 20,000 km provides optimal coverage-to-satellite ratio for positioning services. Limited small satellite penetration due to higher launch costs and radiation environment challenges. Momentum: moderate growth constrained by established navigation constellation maturity but supported by augmentation systems and experimental applications. Watchouts: dominated by government navigation programs limiting commercial opportunities and higher cost barriers versus LEO. |
| Geosynchronous Orbit (GEO) | Traditional segment with 8.2% share, characterized by satellites maintaining fixed positions relative to Earth's surface enabling continuous regional coverage. Altitude of 35,786 km creates communication latency and launch cost challenges but provides unique coverage advantages. Small satellite adoption limited by harsh radiation environment and mission duration requirements. Momentum: selective growth in hosted payloads on larger GEO satellites and specialized applications requiring geostationary positioning. Watchouts: launch cost disadvantages versus LEO constellations and LEO broadband competition eroding traditional GEO communication market share. |
| Segment | 2025 to 2035 Outlook |
|---|---|
| Military Intelligence | Leading application with 38.2% share in 2025, encompassing reconnaissance, signals intelligence, and strategic surveillance missions requiring space-based persistent monitoring capabilities. Critical for national security across major powers and regional military forces. Government budgets supporting advanced capabilities and rapid refresh cycles. Momentum: steady-to-strong growth driven by great power competition, space domain awareness requirements, and tactical military satellite programs. Watchouts: export controls limiting international market access and optical surveillance competition from commercial high-resolution Earth observation. |
| Communication and Navigation | Rapidly expanding segment with 24.5% share, dominated by LEO broadband constellation deployment revolutionizing satellite internet services. Includes narrowband IoT connectivity, navigation augmentation, and direct-to-device communication innovations. Momentum: strongest growth trajectory through 2032 driven by Starlink expansion, competing constellation deployment, and 5G integration with non-terrestrial networks. Watchouts: business model validation challenges, intense capital requirements, and potential market oversupply as multiple constellations compete. |
| Earth Observation | Established segment with 16.7% share, providing commercial and government imagery services for agriculture monitoring, disaster response, urban planning, and environmental assessment. High-resolution optical and synthetic aperture radar capabilities increasingly accessible via small satellite platforms. Momentum: strong growth supported by precision agriculture adoption, climate monitoring requirements, and government procurement of commercial imagery. Watchouts: image resolution limitations versus traditional large satellites and market fragmentation among numerous small operators. |
| Remote Sensing | Specialized segment with 11.4% share, focusing on environmental monitoring, weather forecasting data, and scientific measurements beyond visible spectrum imaging. Includes atmospheric composition monitoring, ocean observation, and specialized sensor applications. Momentum: moderate growth driven by climate science requirements and government environmental monitoring programs. Watchouts: niche applications with limited commercial revenue potential and reliance on government research funding. |
| Scientific Research & Exploration | Academic and exploratory segment with 9.2% share, serving university research programs, technology demonstration missions, and fundamental science experiments. Important for workforce development and technology validation but limited commercial revenue. Momentum: steady growth supported by educational access and space agency technology development programs. Watchouts: constrained budgets in academic and research contexts and mission objectives prioritizing scientific return over commercial sustainability. |
| Drivers | Restraints | Key Trends |
|---|---|---|
| Commercial Space Economy Growth Continuing expansion of private space investment across established and emerging markets driving demand for satellite manufacturing and services. Launch Vehicle Innovation Increasing recognition of reusable rockets and rideshare launches importance in satellite deployment cost reduction and mission flexibility. Constellation Economics Growing demand for satellite platforms that support both mass production efficiency and rapid orbital deployment in large numbers. | Orbital Debris Concerns Space sustainability challenges and collision risks affecting long-term orbital environment and regulatory approval complexity. Spectrum Coordination Complexity Radio frequency allocation limitations and international coordination requirements influencing constellation deployment and operational constraints. Capital Intensity High upfront investment requirements and uncertain revenue trajectories affecting commercial constellation financing and business model validation. Technology Obsolescence Risk Rapid satellite technology advancement creating risks of on-orbit assets becoming outdated relative to newly launched capabilities. | Artificial Intelligence Integration Integration of on-board processing, autonomous operations, and edge computing capabilities enabling superior data analysis efficiency. Propulsion System Advancement Enhanced electric propulsion, green propellants, and precision maneuvering technologies compared to traditional chemical systems. Inter-Satellite Connectivity Development of optical inter-satellite links and mesh network architectures providing enhanced constellation coordination and reduced ground station dependence. Vertical Integration Strategies Integration of satellite manufacturing, launch services, and ground infrastructure for end-to-end space systems provision. |
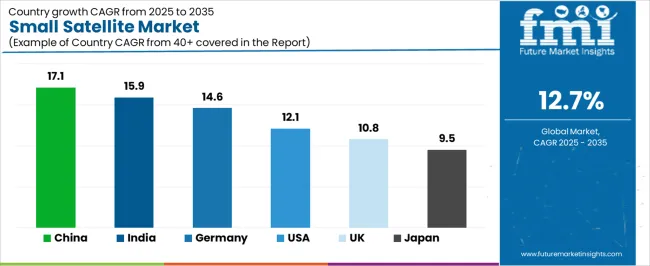
| Country | CAGR (2025-2035) |
|---|---|
| China | 17.1% |
| India | 15.9% |
| Germany | 14.6% |
| United States | 12.1% |
| United Kingdom | 10.8% |
| Japan | 9.5% |
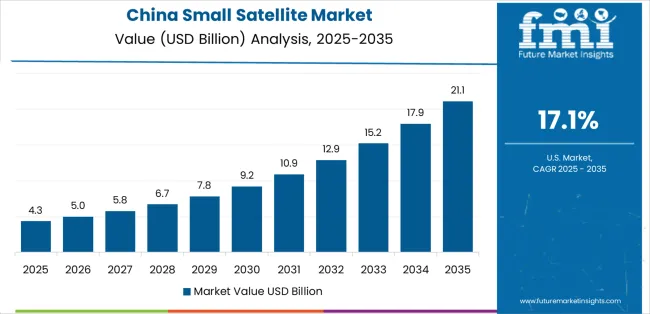
Demand for small satellite in China is projected to exhibit strong growth with a market value of USD 3,770.2 million by 2035, driven by expanding national space infrastructure programs and comprehensive satellite constellation deployment creating substantial opportunities for satellite manufacturers across military reconnaissance operations, communication network development, and civil Earth observation sectors. The country's ambitious space program goals and state-directed industrial policy are creating significant demand for both domestically-produced and internationally-sourced small satellite technologies. Major aerospace companies and emerging commercial space firms are establishing comprehensive satellite manufacturing facilities to support large-scale constellation operations and meet growing demand for space-based services.
Demand for small satellite in India is expanding to reach USD 3,490.8 million by 2035, supported by extensive commercial space policy liberalization and comprehensive satellite manufacturing capability development creating sustained demand for small satellite platforms across diverse application categories and emerging private sector space companies. The country's reformed space sector policies enabling private participation and expanding launch vehicle capabilities are driving demand for satellite solutions that provide innovative services while supporting cost-effective mission execution. Satellite manufacturers and space technology startups are investing in domestic production facilities to support growing commercial space operations and government satellite demand.
Demand for small satellite in Germany is projected to reach USD 3,211.3 million by 2035, supported by the country's leadership in satellite engineering excellence and advanced space technologies requiring sophisticated small satellite systems for Earth observation and scientific research applications. German aerospace companies are producing world-class satellite platforms that support advanced payload integration, operational reliability, and comprehensive quality protocols. The market is characterized by focus on engineering precision, European Space Agency collaboration, and compliance with stringent space industry and export control standards.
Demand for small satellite in United States is growing to reach USD 2,653.7 million by 2035, driven by commercial space industry innovation and increasing LEO broadband constellation deployment creating sustained opportunities for satellite manufacturers serving both commercial communication operators and government defense customers. The country's extensive commercial space ecosystem and expanding military space architecture modernization are creating demand for small satellite platforms that support diverse mission requirements while maintaining rapid deployment schedules. Aerospace companies and space startups are developing advanced manufacturing strategies to support constellation-scale production and competitive positioning.
Demand for Small Satellite in United Kingdom is projected to reach USD 2,373.3 million by 2035, expanding at a CAGR of 10.8%, driven by national space strategy implementation and satellite services sector capabilities supporting commercial Earth observation and comprehensive launch services development. The country's established space industry expertise and OneWeb constellation resurrection are creating demand for small satellite platforms that support commercial services and government applications. Satellite manufacturers and space service providers are maintaining comprehensive development capabilities to support national space strategy objectives.
Demand for Small Satellite in Japan is projected to reach USD 2,093.6 million by 2035, expanding at a CAGR of 9.5%, driven by space exploration ambitions and sophisticated satellite technology capabilities supporting lunar exploration support and comprehensive disaster monitoring applications. The country's established aerospace industry and government space program priorities are creating demand for advanced small satellite platforms that support technology demonstration and operational missions. Satellite manufacturers and research institutions are maintaining rigorous development capabilities to support Japanese space exploration and Earth observation requirements.
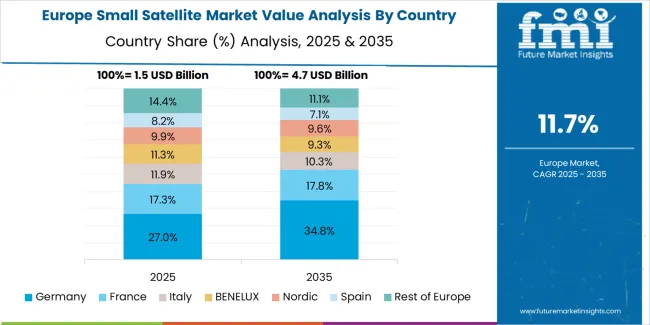
The small satellite market in Europe is projected to grow from USD 974.7 million in 2025 to USD 3,126.5 million by 2035, registering a CAGR of 12.3% over the forecast period. Germany is expected to maintain its leadership position with a 30.2% market share in 2025, supported by its advanced satellite engineering capabilities and comprehensive space industry infrastructure across major aerospace clusters in Bavaria, Baden-Württemberg, and Bremen regions.
France follows with a 26.8% share in 2025, projected to reach 27.3% by 2035, driven by comprehensive national space programs and Airbus Defence and Space manufacturing leadership. United Kingdom holds a 19.4% share in 2025, expected to reach 19.0% by 2035 due to OneWeb constellation development and emerging small satellite startup ecosystem. Italy commands a 13.9% share, while Spain accounts for 9.7% in 2025. The Rest of Europe region is anticipated to maintain momentum, attributed to increasing small satellite development in Nordic countries and emerging Eastern European space programs implementing satellite technology initiatives.
European small satellite operations are increasingly defined by the contrast between established Western European prime contractors and emerging commercial space startups. German and French aerospace companies dominate institutional satellite programs for European Space Agency and national defense applications, leveraging decades of satellite engineering heritage and integration expertise that command premium contracts for complex missions. German companies maintain leadership in radar satellite technology and precision Earth observation platforms, with government and commercial customers driving demanding technical specifications for operational reliability.
British small satellite sector emphasizes commercial innovation with OneWeb constellation development and Surrey Satellite Technology Limited heritage creating strong foundation for export-oriented satellite manufacturing. University spinouts and venture-backed startups pursue novel mission concepts and commercial Earth observation services, benefiting from supportive government policies and access to launch opportunities.
Eastern European space programs in Poland, Czech Republic, and Romania demonstrate growing capabilities with national satellite programs and participation in European collaborative missions. These emerging space nations focus on CubeSat-class platforms and technology demonstration missions while building indigenous space industry capabilities and engineering workforce development.
The regulatory environment shapes competitive dynamics. European Space Agency programs and funding support collaborative missions bringing together prime contractors and small-to-medium enterprises across member states. Export control regulations including ITAR-free technology requirements create market opportunities for European satellite manufacturers serving international customers restricted from U.S. technology access. Orbital debris mitigation guidelines and frequency coordination through European institutions establish operational standards affecting satellite design and mission planning.
Consolidation continues as major aerospace groups acquire small satellite specialists to expand capability portfolios and access emerging commercial markets..
Japanese small satellite operations reflect the country's precision engineering excellence and government-led space program priorities. Major aerospace companies including Mitsubishi Electric, NEC, and emerging players like Axelspace and Synspective maintain rigorous development processes emphasizing reliability and mission success that exceed international norms, requiring extensive testing protocols and quality assurance procedures that extend development timelines but ensure orbital performance.
The Japanese market demonstrates unique mission preferences emphasizing disaster monitoring and Earth observation supporting national resilience priorities following earthquakes and typhoons. Synthetic aperture radar satellite development receives particular attention for all-weather observation capabilities and rapid tasking following natural disasters. Government procurement prioritizes domestic manufacturing supporting indigenous space industry development.
Regulatory oversight through Japan Aerospace Exploration Agency (JAXA) and Ministry of Economy, Trade and Industry establishes comprehensive satellite licensing and frequency coordination requirements. International collaboration through bilateral agreements and participation in international programs creates opportunities for Japanese satellite manufacturers while technology transfer restrictions protect domestic capabilities.
Supply chain dynamics emphasize vertical integration with major electronics and aerospace conglomerates controlling satellite manufacturing from components through final integration. Emerging commercial satellite operators increasingly pursue international partnerships for constellation deployment and service provision while maintaining satellite manufacturing domestically where possible.
The market faces constraints from limited domestic launch opportunities requiring reliance on international launch providers and small launcher development programs pursuing responsive launch capabilities.

South Korean small satellite operations reflect the country's growing space ambitions and technology development capabilities. Government programs through Korea Aerospace Research Institute (KARI) and emerging commercial companies including Contec and Innospace drive satellite development serving national security, Earth observation, and technology demonstration objectives across government and commercial sectors.
The Korean market demonstrates particular strength in leveraging electronics industry capabilities for satellite component manufacturing and ground system development. Companies apply expertise from semiconductor and telecommunications sectors to satellite subsystem development, creating competitive advantages in specific technology domains while pursuing international partnerships for overall satellite integration expertise.
Regulatory frameworks through Ministry of Science and ICT establish space development priorities and licensing procedures for satellite operations. Recent space development promotion legislation aims to accelerate commercial space sector growth and international competitiveness, creating supportive environment for startup formation and private investment in space technologies.
Supply chain infrastructure emphasizes hybrid approach combining domestic component manufacturing with international procurement for specialized subsystems and satellite platform integration. Korean satellite programs increasingly pursue international collaboration for technology access and cost sharing while building indigenous capabilities for future independence.
The market faces challenges from limited heritage in operational satellite programs requiring technology validation and mission success demonstration to build customer confidence. Dependence on international launch providers and limited domestic launch vehicle capabilities constrain responsive deployment options.
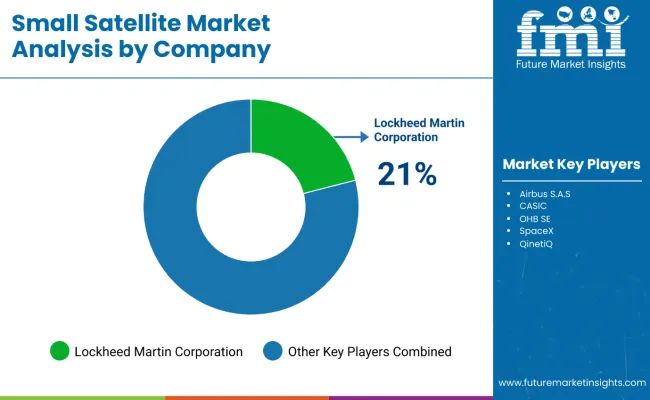
Profit pools are consolidating around vertically-integrated space companies combining satellite manufacturing, constellation operations, and ground infrastructure with established launch access and government relationships. Value is migrating from custom satellite development toward mass-produced constellation platforms where economies of scale, rapid deployment, and integrated services command sustainable business models.
Several archetypes set the pace: aerospace prime contractors defending share through government relationships and system integration expertise; commercial constellation operators vertically integrating manufacturing and services; specialized small satellite manufacturers with technology differentiation and rapid production; and emerging space startups pursuing novel mission concepts and disruptive business models.
Switching costs-orbital infrastructure investment, spectrum licensing, customer integration-stabilize market positions for operational constellation providers, while technology advancement and new space accessibility reopen opportunities for innovative entrants.
Consolidation continues as established aerospace companies acquire small satellite specialists while launch vehicle access and satellite-as-a-service models reshape traditional value chains. Do now: secure mass production capabilities with standardized satellite buses and supply chain scalability; hard-wire spectrum licensing and orbital slot access with regulatory relationships; option: develop vertically-integrated constellation-to-customer service platforms with subscription-based revenue models.
| Stakeholder Type | Primary Advantage | Repeatable Plays |
|---|---|---|
| Aerospace prime contractors | Government relationships, system integration, program management | Defense contracts, ESA/NASA programs, complex mission prime |
| Commercial constellation operators | Vertical integration, operational experience, customer base | Constellation deployment, service subscriptions, global coverage |
| Specialized small satellite manufacturers | Production efficiency, technology differentiation, rapid delivery | Multi-satellite orders, standardized platforms, rideshare optimization |
| Emerging space startups | Innovation agility, novel applications, venture capital access | Technology demonstration, niche services, disruptive pricing |
| Component & subsystem suppliers | Enabling technology, supply chain position, cross-platform sales | COTS components, miniaturization, multi-customer diversification |
| Items | Values |
|---|---|
| Quantitative Units | USD 6,654.7 million |
| Satellite Type | Picosatellites, Minisatellite, Microsatellite, CubeSats, Femtosatellites |
| Orbit Type | Low Earth Orbit (LEO), Medium Earth Orbit (MEO), Geosynchronous Orbit (GEO) |
| Application | Military Intelligence, Communication and Navigation, Earth Observation, Remote Sensing, Scientific Research & Exploration |
| Regions Covered | North America, Latin America, Europe, Asia Pacific, Middle East & Africa |
| Country Covered | United States, Germany, United Kingdom, China, India, Japan, and other 40+ countries |
| Key Companies Profiled | Airbus S.A.S., CASIC, OHB SE, Lockheed Martin Corporation, Boeing, Northrop Grumman Corporation, Thales Alenia Space, Planet Labs Inc., Surrey Satellite Technology Ltd (SSTL), Ball Aerospace |
| Additional Attributes | Dollar sales by satellite type/orbit type/application, regional demand (NA, EU, APAC), competitive landscape, constellation vs. single satellite deployment, commercial vs. government procurement, and technology innovations driving miniaturization, constellation economics, and space sustainability |
The global small satellite market is estimated to be valued at USD 6.7 billion in 2025.
The market size for the small satellite market is projected to reach USD 21,997.2 billion by 2035.
The small satellite market is expected to grow at a 12.7% CAGR between 2025 and 2035.
The key product types in small satellite market are minisatellite, picosatellites, microsatellite, cubesats and femtosatellites.
In terms of orbit type, low earth orbit (leo) segment to command 79.6% share in the small satellite market in 2025.


Full Research Suite comprises of:
Market outlook & trends analysis
Interviews & case studies
Strategic recommendations
Vendor profiles & capabilities analysis
5-year forecasts
8 regions and 60+ country-level data splits
Market segment data splits
12 months of continuous data updates
DELIVERED AS:
PDF EXCEL ONLINE
Industry Share Analysis for Small Satellite Market Leaders
Small Molecule Brominated Flame Retardants Market Size and Share Forecast Outlook 2025 to 2035
Small Form Factor (SFF) Connectors Market Size and Share Forecast Outlook 2025 to 2035
Small Marine Engine Market Forecast Outlook 2025 to 2035
Small Gas Engine Market Size and Share Forecast Outlook 2025 to 2035
Small Molecule CDMO Market Size and Share Forecast Outlook 2025 to 2035
Small Molecule CMO/CDMO Market Size and Share Forecast Outlook 2025 to 2035
Small Animal Metabolic Monitoring System Market Size and Share Forecast Outlook 2025 to 2035
Small Animal Running Wheel System Market Size and Share Forecast Outlook 2025 to 2035
Small Molecule-Drug Conjugates Market Size and Share Forecast Outlook 2025 to 2035
Small Caliber Ammunition Market Size and Share Forecast Outlook 2025 to 2035
Small Boats Market Size and Share Forecast Outlook 2025 to 2035
Small Capacity Electrolyzer Market Size and Share Forecast Outlook 2025 to 2035
Small Animal Imaging (In Vivo) Market Size and Share Forecast Outlook 2025 to 2035
Small Cell Lung Cancer (SCLC) Treatment Market Size and Share Forecast Outlook 2025 to 2035
Small Molecule Innovator CDMO Market Size and Share Forecast Outlook 2025 to 2035
Small Cell Network Market Size and Share Forecast Outlook 2025 to 2035
Small Wind Turbine Market Size and Share Forecast Outlook 2025 to 2035
Small Off-Road Engines Market Size and Share Forecast Outlook 2025 to 2035
Small Continuous Fryer Market Size and Share Forecast Outlook 2025 to 2035

Thank you!
You will receive an email from our Business Development Manager. Please be sure to check your SPAM/JUNK folder too.
Chat With
MaRIA