The global small animal metabolic monitoring system market is projected to grow from USD 150 million in 2025 to approximately USD 292 million by 2035, recording an absolute increase of USD 142 million over the forecast period. This translates into a total growth of 94.9%, with the market forecast to expand at a compound annual growth rate (CAGR) of 7% between 2025 and 2035.
The overall market size is expected to grow by nearly 1.95X during the same period, supported by the rising adoption of advanced monitoring technologies in preclinical research and increasing demand for comprehensive metabolic assessment systems across pharmaceutical and academic research institutions.
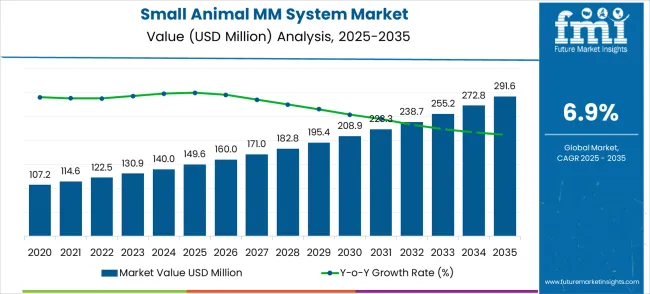
Between 2025 and 2030, the small animal metabolic monitoring system market is projected to expand from USD 150 million to USD 208.8 million, resulting in a value increase of USD 59.2 million, which represents 41.7% of the total forecast growth for the decade.
This phase of growth will be shaped by rising penetration of automated monitoring systems in research facilities, increasing pharmaceutical R&D investments requiring advanced metabolic assessment, and growing awareness among researchers about the importance of comprehensive physiological monitoring. Equipment manufacturers are expanding their monitoring capabilities to address the growing complexity of modern preclinical research requirements across diverse therapeutic areas.
| Metric | Value |
|---|---|
| Estimated Value in (2025E) | USD 150 million |
| Forecast Value in (2035F) | USD 292 million |
| Forecast CAGR (2025 to 2035) | 7% |
The small animal metabolic monitoring system market has been recognized as a vital segment across multiple parent domains. It accounts for nearly 6.2% of the preclinical research equipment market, as such systems are routinely adopted for evaluating animal models in controlled environments. Within the laboratory animal research market, its contribution is around 5.5%, with demand linked to precise measurement of energy expenditure, respiratory exchange, and metabolic biomarkers. In the biomedical research tools market, the share is 4.8%, since metabolic monitoring forms an integral part of disease modeling and translational studies.
The drug discovery and development market sees a 3.9% contribution, with systems being incorporated to analyze the metabolic impact of novel compounds on animal models before moving to clinical phases. Lastly, within the metabolic monitoring devices market, it holds an 8.1% share, reflecting its dominance in specialized animal-focused research instrumentation. Together, these parent markets represent a combined 28.5%, underscoring the indispensable role of metabolic monitoring for small animals in enhancing experimental reliability, facilitating data-driven drug development, and bolstering biomedical research outcomes across academic, pharmaceutical, and contract research settings.
The small animal metabolic monitoring system market is poised for rapid expansion, fueled by disease research, precision nutrition studies, and advanced drug development. By 2035, these pathways together unlock USD 0.45–0.55 billion in incremental revenue opportunities, expanding the market from USD 150 million (2025) to USD 292 million (2035) at a 7% CAGR.
Pathway A – Disease Research Dominance. Single-channel systems are widely adopted in preclinical disease models, offering precise metabolic monitoring for diabetes, obesity, and cardiovascular research. The largest near-term pool is worth USD 0.12–0.18 billion.
Pathway B – Nutrition Research Expansion. Multi-channel setups enable high-throughput studies on animal nutrition, energy balance, and obesity-related conditions. Expected pool: USD 0.10–0.16 billion.
Pathway C – Drug Development Applications. Pharma and biotech industries are increasing adoption for preclinical drug safety and efficacy studies. Incremental pool: USD 0.09–0.14 billion.
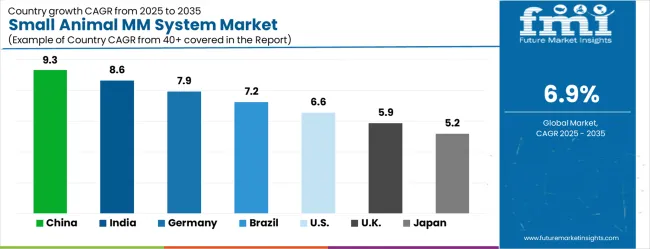
Pathway D – Regional High-Growth Hotspots. China (9.3% CAGR) and India (8.6% CAGR) drive expansion, while Germany and Brazil support growth via advanced life sciences infrastructure. Pool: USD 0.08–0.12 billion.
Pathway E – AI & Digital Integration. Integration of AI-driven analytics, telemetry, and cloud platforms for real-time metabolic tracking unlocks USD 0.06–0.10 billion.
Pathway F – Sustainable & Certified Systems. Eco-friendly designs and certified systems (GLP, AAALAC) cater to ethical research and global compliance, capturing USD 0.05–0.08 billion.
Why is the Small Animal Metabolic Monitoring System Market Growing?
Market expansion is being supported by the rapid increase in pharmaceutical research and development activities worldwide and the corresponding need for advanced monitoring systems to evaluate drug efficacy and safety in preclinical studies. Modern pharmaceutical research relies on precise metabolic monitoring systems to assess energy expenditure, respiratory parameters, and behavioral patterns in laboratory animals throughout drug development processes. Comprehensive monitoring enables researchers to identify potential therapeutic targets, optimize dosing regimens, and predict clinical outcomes with greater accuracy.
The growing complexity of drug development programs and increasing focus on personalized medicine approaches are driving demand for sophisticated metabolic monitoring solutions from certified manufacturers with appropriate technology and validation capabilities. Regulatory agencies are increasingly requiring comprehensive preclinical data including detailed metabolic assessments to support new drug applications and clinical trial authorizations. Industry standards and research protocols are establishing standardized monitoring procedures that require advanced equipment and specialized technical expertise for optimal research outcomes.
The market is segmented by channel capacity, application, and region. By channel capacity, the market is divided into single channel, 8 channels, 16 channels and above, and others. Based on application, the market is categorized into disease research, nutrition research, drug development, and others. Regionally, the market is divided into North America, Europe, East Asia, South Asia & Pacific, Latin America, and Middle East & Africa.
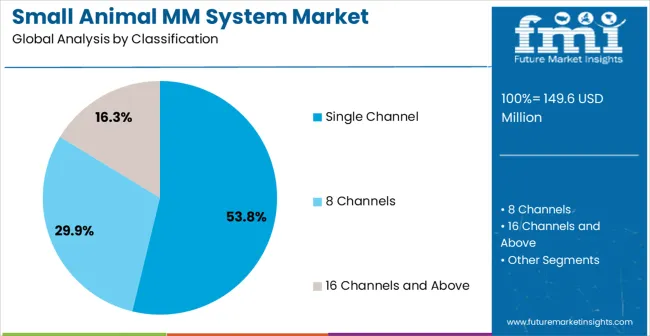
Single channel metabolic monitoring systems are projected to account for 53.8% of the Small Animal Metabolic Monitoring System market in 2025. This leading share is supported by the widespread adoption of single animal monitoring configurations in specialized research applications, which represent the majority of current research protocols requiring detailed individual animal assessment. Single channel systems provide optimal cost-effectiveness while maintaining comprehensive monitoring capabilities for most research applications including pharmacokinetic studies, toxicology assessments, and behavioral analysis programs. The segment benefits from established research protocols and comprehensive equipment availability from multiple specialized manufacturers. These systems offer precise data collection for individual animal studies while ensuring consistent quality standards across research institutions and maintaining competitive pricing structures for research facilities with budget constraints.
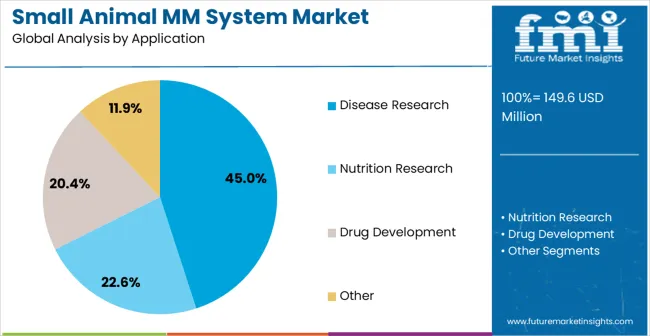
Disease research applications are expected to account for 45% of small animal metabolic monitoring system demand in 2025. This dominant share reflects the extensive use of metabolic monitoring in disease model development, therapeutic efficacy studies, and pathophysiology research that requires comprehensive physiological assessment. Modern disease research programs increasingly feature multiple applications for metabolic monitoring including metabolic syndrome studies, cardiovascular disease research, and neurological disorder investigations for enhanced research outcomes. The segment benefits from growing pharmaceutical investment in disease research and increasing regulatory requirements for comprehensive preclinical data supporting therapeutic development. Market expansion continues as researchers seek advanced monitoring solutions for complex disease models and precision medicine approaches requiring detailed metabolic characterization and enhanced research capabilities.
The small animal metabolic monitoring system market is advancing steadily due to increasing pharmaceutical research activities and growing recognition of metabolic monitoring importance for drug development success. However, the market faces challenges including high equipment costs, need for specialized technical training, and varying research requirements across different therapeutic areas and research applications. Technology standardization efforts and validation programs continue to influence equipment quality and research methodology development patterns across the industry.
The growing deployment of comprehensive monitoring systems is enabling simultaneous measurement of respiratory parameters, energy expenditure, food intake, and behavioral activity through integrated sensor networks and automated data collection platforms. Advanced monitoring systems equipped with real-time data processing provide optimal research efficiency while minimizing animal handling stress for researchers while expanding experimental design possibilities and research throughput capabilities. These technologies are particularly valuable for complex disease research programs and pharmaceutical studies that require continuous monitoring without experimental interference and enhanced data quality.
Modern metabolic monitoring system manufacturers are incorporating advanced data analytics capabilities and predictive modeling systems that improve research insights and reduce analysis time requirements through automated pattern recognition and statistical analysis. Integration of cloud-based data management systems and machine learning algorithms enables more sophisticated research protocols and comprehensive data interpretation capabilities across research institutions. Advanced analytics platforms also support collaborative research initiatives while meeting growing demand for data standardization and regulatory compliance requirements in pharmaceutical research applications.
| Country | CAGR (2025-2035) |
|---|---|
| China | 9.3% |
| India | 8.6% |
| Germany | 7.9% |
| Brazil | 7.2% |
| United States | 6.6% |
| United Kingdom | 5.9% |
| Japan | 5.2% |
The small animal metabolic monitoring system market is growing rapidly, with China leading at a 9.3% CAGR through 2035, driven by massive pharmaceutical industry expansion, growing research infrastructure investments, and comprehensive biotechnology development programs supporting advanced preclinical research capabilities. India follows at 8.6%, supported by expanding pharmaceutical research sector and increasing government initiatives promoting biotechnology research and development activities. Germany records 7.9%, emphasizing precision research technology, advanced equipment integration, and stringent research quality standards. Brazil grows at 7.2%, integrating metabolic monitoring systems into established research programs and expanding pharmaceutical development activities. The United States shows 6.6% growth, focusing on advanced research applications and regulatory compliance requirements. The United Kingdom and Japan demonstrate steady growth at 5.9% and 5.2% respectively, driven by specialized research applications and high-value equipment adoption.
The report covers an in-depth analysis of 40+ countries top-performing countries are highlighted below.
The small animal metabolic monitoring system market in China is expanding at a CAGR of 9.3%, driven by the rapid growth of the pharmaceutical, biotechnology, and research sectors. With an increasing focus on medical research and drug development, there is a rising demand for precise metabolic measurement tools for small animals. China’s growing veterinary care market and expanding research facilities further fuel the adoption of these systems. As the country prioritizes technological advancements in healthcare and research, small animal metabolic monitoring systems are being integrated into numerous veterinary and research applications.
The small animal metabolic monitoring system market in India is projected to grow at a CAGR of 8.6%, driven by the country’s expanding pharmaceutical and healthcare sectors. Increasing research into animal physiology, disease management, and drug efficacy is spurring demand for advanced metabolic monitoring systems. India’s rapidly growing veterinary services market also supports the need for these systems in pet clinics and animal hospitals. As India strengthens its research capabilities and technological advancements in healthcare, the adoption of small animal metabolic monitoring systems continues to rise.
The small animal metabolic monitoring system market in Germany is growing at a CAGR of 7.9%, supported by the country’s robust research and pharmaceutical industries. Germany is a leader in medical research, and its investment in animal research and drug development is driving the adoption of advanced metabolic monitoring systems. The strong presence of universities, research institutions, and pharmaceutical companies in the country is creating a growing need for accurate metabolic monitoring in small animal studies. Germany’s commitment to advancing healthcare technologies further supports the market for these systems.
The small animal metabolic monitoring system market in Brazil is projected to grow at a CAGR of 7.2%, spurred by the increasing demand for animal research in pharmaceutical and biotechnology sectors. As Brazil enhances its research capabilities and focuses on improving animal welfare, the need for advanced metabolic monitoring systems is growing. Veterinary clinics and hospitals are also increasingly adopting these systems to improve pet care and treatment accuracy. The country’s expanding pharmaceutical industry further accelerates the demand for high-quality metabolic measurement tools.
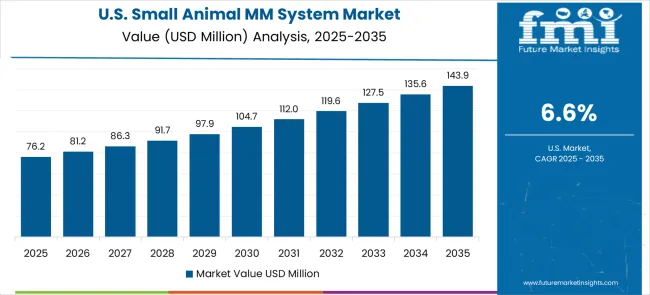
The small animal metabolic monitoring system market in the United States is growing at a CAGR of 6.6%, driven by the country’s advanced research capabilities in the pharmaceutical, biotechnology, and healthcare industries. USA research institutions and pharmaceutical companies are increasingly adopting small animal metabolic monitoring systems for drug testing, pre-clinical trials, and veterinary studies. Furthermore, the increasing focus on pet care and companion animal health is boosting the demand for these systems in veterinary clinics and hospitals. The USA market is also supported by government initiatives promoting healthcare innovation and research.
The small animal metabolic monitoring system market in the United Kingdom is growing at a CAGR of 5.9%, driven by the country’s strong pharmaceutical research industry and veterinary care market. The UK continues to be a leader in animal health research, and with an increasing focus on improving the accuracy of clinical trials and veterinary diagnostics, there is a growing demand for advanced metabolic monitoring systems. Additionally, the adoption of these systems in veterinary hospitals and research institutions is being driven by technological advancements and a focus on improving animal welfare.
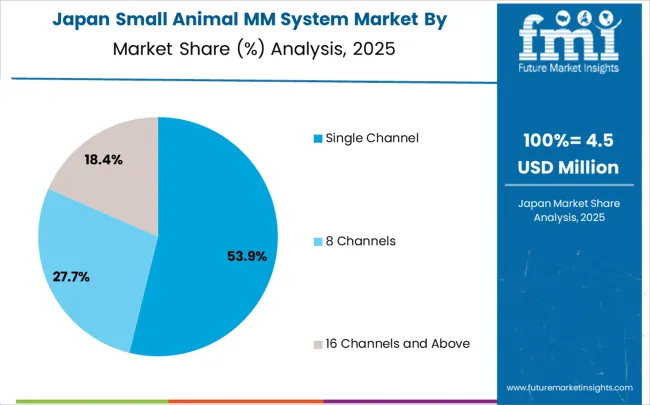
The small animal metabolic monitoring system market in Japan is expanding at a CAGR of 5.2%, supported by the country’s well-established pharmaceutical and biotechnology industries. Japan is a leader in animal research, particularly in drug discovery and pre-clinical trials, where metabolic monitoring systems are essential for accurate data collection. The country’s growing focus on veterinary care and advanced pet health treatments further boosts the demand for these systems. Japan’s emphasis on innovation in healthcare technologies continues to support the adoption of small animal metabolic monitoring systems in both research and clinical settings.
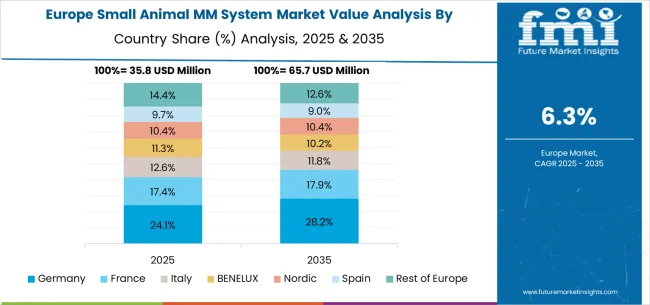
The small animal metabolic monitoring system market in Europe is projected to grow from USD 42.1 million in 2025 to USD 78.6 million by 2035, registering a CAGR of 6.4% over the forecast period. Germany is expected to maintain its leadership with a 28.5% share in 2025, supported by its extensive pharmaceutical research infrastructure and advanced preclinical research capabilities.
The United Kingdom is projected to hold 19.7% market share, followed by France at 16.3%. Italy and Spain account for 12.8% and 10.4% respectively. The Rest of Europe region represents 12.3% of the market, attributed to growing research investments in Eastern European countries and expanding biotechnology sector development across the region.
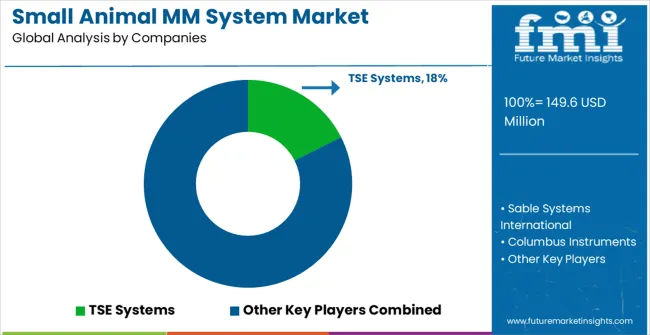
The small animal metabolic monitoring system market is defined by competition among specialized equipment manufacturers, research technology companies, and laboratory instrument suppliers. Companies are investing in advanced monitoring technologies, software integration capabilities, validation and compliance systems, and technical support services to deliver precise, reliable, and comprehensive metabolic monitoring solutions. Strategic partnerships, technological innovation, and geographic expansion are central to strengthening product portfolios and market presence.
TSE Systems, Germany-based, offers comprehensive metabolic monitoring systems with focus on precision measurement, advanced software integration, and technical expertise for research applications. Sable Systems International, operating globally, provides specialized respiratory monitoring solutions integrated with metabolic assessment capabilities for diverse research requirements. Columbus Instruments, USA, delivers technologically advanced monitoring platforms with standardized protocols and intelligent data management integration. Oxylet, France, emphasizes automated monitoring systems and comprehensive coverage for pharmaceutical research applications.
Sciencetool, providing regional solutions, offers metabolic monitoring equipment integrated with comprehensive research support services. Harvard Bioscience, USA, delivers specialized monitoring instrumentation with advanced technical capabilities and validation support. Tecniplast, Italy, provides integrated monitoring solutions alongside laboratory animal housing systems. Anhui Zhenghua Biological Instruments and Equipment, Anhui Yaokun Biotechnology, Shanghai Puyang Biotechnology, Beijing Zhishu Duobao Biotechnology, Hangzhou Jianke Life Science, Huaibei Black Body Software Technology, and Dongguan Bozhiyuan Biotechnology Development offer specialized metabolic monitoring expertise, standardized manufacturing procedures, and technical reliability across regional and domestic research networks.
| Item | Value |
|---|---|
| Quantitative Units (2025) | USD 150 million |
| Channel Capacity | Single Channel, 8 Channels, 16 Channels and Above, Others |
| Application | Disease Research, Nutrition Research, Drug Development, Others |
| Regions Covered | North America, Europe, Asia-Pacific, Latin America, Middle East & Africa |
| Country Covered | United States, Canada, United Kingdom, Germany, France, China, Japan, South Korea, India, Brazil, Australia and 40+ countries |
| Key Companies Profiled | TSE Systems, Sable Systems International, Columbus Instruments, Oxylet, Sciencetool, Harvard Bioscience, Tecniplast, Anhui Zhenghua Biological Instruments and Equipment, Anhui Yaokun Biotechnology, Shanghai Puyang Biotechnology, Beijing Zhishu Duobao Biotechnology, Hangzhou Jianke Life Science, Huaibei Black Body Software Technology, Dongguan Bozhiyuan Biotechnology Development |
| Additional Attributes | Dollar sales by channel capacity and application segments, regional demand trends across North America, Europe, and Asia-Pacific, competitive landscape with established manufacturers and emerging technology providers, customer preferences for single versus multi-channel monitoring systems, integration with automated data collection platforms and cloud-based analytics solutions, innovations in wireless monitoring technologies and real-time data processing systems, and adoption of artificial intelligence-enabled monitoring solutions with enhanced measurement accuracy, predictive analytics capabilities, and standardized research protocols for improved preclinical research outcomes. |
The global small animal metabolic monitoring system market is estimated to be valued at USD 149.6 million in 2025.
The market size for the small animal metabolic monitoring system market is projected to reach USD 291.6 million by 2035.
The small animal metabolic monitoring system market is expected to grow at a 6.9% CAGR between 2025 and 2035.
The key product types in small animal metabolic monitoring system market are single channel, 8 channels and 16 channels and above.
In terms of application, disease research segment to command 45.0% share in the small animal metabolic monitoring system market in 2025.


Our Research Products

The "Full Research Suite" delivers actionable market intel, deep dives on markets or technologies, so clients act faster, cut risk, and unlock growth.

The Leaderboard benchmarks and ranks top vendors, classifying them as Established Leaders, Leading Challengers, or Disruptors & Challengers.

Locates where complements amplify value and substitutes erode it, forecasting net impact by horizon

We deliver granular, decision-grade intel: market sizing, 5-year forecasts, pricing, adoption, usage, revenue, and operational KPIs—plus competitor tracking, regulation, and value chains—across 60 countries broadly.

Spot the shifts before they hit your P&L. We track inflection points, adoption curves, pricing moves, and ecosystem plays to show where demand is heading, why it is changing, and what to do next across high-growth markets and disruptive tech

Real-time reads of user behavior. We track shifting priorities, perceptions of today’s and next-gen services, and provider experience, then pace how fast tech moves from trial to adoption, blending buyer, consumer, and channel inputs with social signals (#WhySwitch, #UX).

Partner with our analyst team to build a custom report designed around your business priorities. From analysing market trends to assessing competitors or crafting bespoke datasets, we tailor insights to your needs.
Supplier Intelligence
Discovery & Profiling
Capacity & Footprint
Performance & Risk
Compliance & Governance
Commercial Readiness
Who Supplies Whom
Scorecards & Shortlists
Playbooks & Docs
Category Intelligence
Definition & Scope
Demand & Use Cases
Cost Drivers
Market Structure
Supply Chain Map
Trade & Policy
Operating Norms
Deliverables
Buyer Intelligence
Account Basics
Spend & Scope
Procurement Model
Vendor Requirements
Terms & Policies
Entry Strategy
Pain Points & Triggers
Outputs
Pricing Analysis
Benchmarks
Trends
Should-Cost
Indexation
Landed Cost
Commercial Terms
Deliverables
Brand Analysis
Positioning & Value Prop
Share & Presence
Customer Evidence
Go-to-Market
Digital & Reputation
Compliance & Trust
KPIs & Gaps
Outputs
Full Research Suite comprises of:
Market outlook & trends analysis
Interviews & case studies
Strategic recommendations
Vendor profiles & capabilities analysis
5-year forecasts
8 regions and 60+ country-level data splits
Market segment data splits
12 months of continuous data updates
DELIVERED AS:
PDF EXCEL ONLINE
Small Animal Running Wheel System Market Size and Share Forecast Outlook 2025 to 2035
Small Animal Imaging (In Vivo) Market Size and Share Forecast Outlook 2025 to 2035
Neuro-monitoring System Market Size and Share Forecast Outlook 2025 to 2035
Urine Monitoring Systems Market Analysis - Size, Trends & Forecast 2025 to 2035
Brain Monitoring Systems Market is segmented by Lateral Flow Readers and Kits and Reagents from 2025 to 2035
Yield Monitoring Systems Market
Metabolic Rate Analysis System Market Size and Share Forecast Outlook 2025 to 2035
Driver Monitoring System Market Growth - Trends & Forecast 2025 to 2035
Tunnel Monitoring System Market Growth - Trends & Forecast 2025 to 2035
Patient Monitoring System Market Size and Share Forecast Outlook 2025 to 2035
B-Ketone Monitoring System Market Size and Share Forecast Outlook 2025 to 2035
Pipeline Monitoring System Market Size and Share Forecast Outlook 2025 to 2035
Air Flow Monitoring System Market
Emission Monitoring Systems Market
Condition Monitoring System Market Size and Share Forecast Outlook 2025 to 2035
Market Share Breakdown of Condition Monitoring System Providers
Livestock Monitoring System Market
Remote ICU Monitoring System Market Size and Share Forecast Outlook 2025 to 2035
Substation Monitoring System Market Size and Share Forecast Outlook 2025 to 2035
RFID Blood Monitoring Systems Market Insights - Trends & Forecast 2024 to 2034

Thank you!
You will receive an email from our Business Development Manager. Please be sure to check your SPAM/JUNK folder too.
Chat With
MaRIA