Reports

- Global Locations -

Headquarters

Future Market Insights, Inc.

Christiana Corporate, 200
Continental Drive, Suite 401,
Newark, Delaware - 19713,
United States

T: +1-845-579-5705

Americas

Future Market Insights, Inc.

616 Corporate Way, Suite 2-9018,
Valley Cottage, NY 10989, United States

T: +1-347-918-3531

MEA

Future Market Insights

1602-6 Jumeirah Bay X2 Tower, Plot No: JLT-PH2-X2A,
Jumeirah Lakes Towers, Dubai,
United Arab Emirates

Europe

Future Market Insights

3rd Floor, 207 Regent Street,
W1B 3HH London
United Kingdom

T: + 44 (0) 20 8123 9659
D: +44 (0) 20 3287 4268

Asia Pacific

Future Market Insights

IndiaLand Global Tech Park, Unit UG-1, Behind Grand HighStreet, Phase 1, Hinjawadi, MH, Pune – 411057, India

Point-of-Care Fentanyl Test Kits Market Outlook (2023 to 2033)

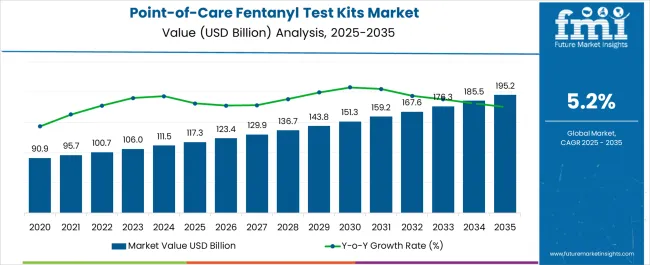
The point-of-care fentanyl test kits market size is projected to be worth US$ 105.4 million in 2023. The market is likely to surpass US$ 180.9 million by 2033 at a CAGR of 5.5% during the forecast period. The market for point-of-care fentanyl test kits has been experiencing substantial growth and is expected to continue expanding. The increasing prevalence of fentanyl abuse, the opioid crisis, and the need for immediate and accurate detection are the key drivers of this market growth. The market size is influenced by factors such as regional variations in fentanyl abuse rates, regulatory policies, and healthcare infrastructure.

Point-of-care fentanyl test kits find applications in diverse settings, including emergency departments, addiction treatment centers, law enforcement agencies, workplace drug testing programs, and community outreach programs. The ability to conduct immediate on-site testing without the need for specialized laboratory equipment makes these kits highly valuable in scenarios where rapid decision-making is critical.

Other Drivers Propelling the Demand for Point-of-Care Fentanyl Test Kits Market include:

  • The growing prevalence of fentanyl abuse is a major driver of the point-of-care fentanyl test kits market. Fentanyl is highly potent and often mixed with other drugs, leading to a significant risk of overdose and fatalities. The need for rapid and accurate on-site testing for fentanyl has increased to address this public health concern.
  • Advances in testing technologies have improved the accuracy and reliability of point-of-care fentanyl test kits. These advancements include the development of highly sensitive immunoassays, lateral flow assays, and spectroscopic techniques. The availability of more precise and efficient testing methods drives the adoption of point-of-care fentanyl test kits.
  • Governments and regulatory authorities have recognized the urgency of addressing the fentanyl crisis. They have implemented regulations and guidelines that emphasize the importance of fentanyl testing, particularly in healthcare settings, addiction treatment centers, and law enforcement agencies. These regulatory initiatives drive the demand for point-of-care fentanyl test kits.
  • The focus on harm reduction strategies and initiatives is growing worldwide to mitigate the risks associated with drug abuse. Point-of-care fentanyl test kits support harm reduction efforts by allowing individuals to test substances for the presence of fentanyl before consumption. This empowers users to make informed decisions about drug use and reduce the risk of fentanyl-related harm.

Challenges for Companies /Manufacturers in the Point-of-Care Fentanyl Test Kits Market:

  • Ensuring high sensitivity and specificity in detecting fentanyl is crucial for point-of-care test kits. The challenge lies in developing tests that can accurately differentiate fentanyl from other substances or analogs, considering the potential presence of various drug combinations. Striving for improved sensitivity and specificity is essential to enhance the reliability of test results.
  • The cost-effectiveness of point-of-care fentanyl test kits is a significant consideration for their widespread adoption. Balancing the need for affordable testing solutions without compromising accuracy and reliability poses a challenge. Manufacturers must strive to optimize production costs while delivering high-quality test kits to make them accessible to a wide range of healthcare providers and organizations.

Opportunities in the Point-of-Care Fentanyl Test Kits Market Industry:

  • The ongoing opioid crisis has increased the focus on preventing opioid-related overdoses and deaths. Point-of-care fentanyl test kits play a critical role in harm reduction strategies, allowing for early detection of fentanyl and timely interventions. Public health initiatives and government programs aimed at tackling the opioid crisis create opportunities for the adoption of these test kits.
  • Advances in testing technologies continue to improve the performance and reliability of point-of-care fentanyl test kits. Enhanced sensitivity, specificity, and ease of use are key focus areas for manufacturers. Opportunities lie in developing innovative testing platforms, integrating new detection methods, and leveraging technologies like smartphone-based testing for increased accessibility.
  • The broader trend of expanding point-of-care testing in healthcare is driving the demand for fentanyl test kits. Point-of-care testing offers benefits such as rapid results, immediate decision-making, and enhanced patient outcomes. The integration of fentanyl testing into point-of-care platforms and the adoption of multiplex testing capabilities present growth opportunities in the market.

Latest Trends in the Point-of-Care Fentanyl Test Kits Market:

  • Integration of point-of-care fentanyl test kits with electronic health records (EHRs) is a growing trend. Seamless connectivity between the test kits and EHR systems enables efficient data management, improves patient tracking, and facilitates real-time monitoring of fentanyl use. This integration enhances the overall efficiency and effectiveness of fentanyl testing in healthcare settings.
  • Multiplex testing, which allows for the detection of multiple substances simultaneously, is gaining trend in the point-of-care fentanyl test kits market. Manufacturers are developing test kits that can detect not only fentanyl but also other opioids or substances commonly found in combination with fentanyl, such as heroin or cocaine.
  • Biosensor technology is gaining trend numerously in the point-of-care fentanyl test kits market. Biosensors offer the advantage of high sensitivity and selectivity, enabling the detection of fentanyl at very low concentrations. These compact and portable devices can be integrated into point-of-care test kits, providing real-time, label-free detection of fentanyl with minimal sample preparation.
Attributes Details
Point-of-Care Fentanyl Test Kits Market Size (2023) US$ 105.4 million
Point-of-Care Fentanyl Test Kits Market Projected Size (2033) US$ 180.9 million
Value CAGR (2023 to 2033) 5.5%

Don't pay for what you don't need

Customize your report by selecting specific countries or regions and save 30%!

2017 to 2022 Point-of-Care Fentanyl Test Kits Market Demand Outlook Compared to 2023 to 2033 Forecast

From 2017 to 2022, the global point-of-care fentanyl test kits Market experienced a CAGR of 4.5%, reaching a market size of US$ 105.4 million in 2023.

From 2017 to 2022, the global point-of-care fentanyl test kits industry witnessed significant growth as regulatory bodies have recognized the need for accurate and reliable fentanyl testing and have provided support and guidelines for the development and use of point-of-care fentanyl test kits. These regulations ensure the quality and safety of the test kits, instilling confidence among end-users and facilitating market growth.

Future Forecast for Point-of-Care Fentanyl Test Kits Market Industry:

Looking ahead, the global point-of-care fentanyl test kits market industry is expected to rise at a CAGR of 5.5% from 2023 to 2033. During the forecast period, the market size is expected to reach US$ 180.9 million by 2033.

The point-of-care fentanyl test kits industry is expected to continue its growth trajectory from 2023 to 2033, driven by growing awareness about the risks associated with fentanyl use and the need for early detection is expected to fuel the demand for point-of-care fentanyl test kits. Government initiatives aimed at combating the opioid crisis and reducing fentanyl-related deaths are likely to drive the adoption of these test kits in various healthcare settings.

The growth of the point-of-care fentanyl test kits market will be driven by increasing awareness, technological advancements, expanding point-of-care testing, regulatory support, integration with digital health technologies, customization for specific settings, international market expansion, and emphasis on user-friendly design and simplified workflows.
Comparative View of the Point-of-Care Fentanyl Test Kits Market

Point-of-Care Fentanyl Test Kits Market:

Attributes Point-of-Care Fentanyl Test Kits Market
CAGR (2023 to 2033) 5.5%
Market Value (2033) US$ 180.9 million
Opportunity Fentanyl is often mixed with other substances, such as heroin or cocaine, which increases the complexity of testing. Developing point-of-care fentanyl test kits that can simultaneously detect multiple substances will provide a comprehensive screening solution. This exclusive opportunity allows for a more accurate and efficient detection process, enabling healthcare professionals to make informed decisions and provide appropriate interventions promptly.
Key Trends here is a growing demand for point-of-care fentanyl test kits that provide rapid results and high sensitivity. Manufacturers are focusing on developing innovative testing technologies and methodologies to achieve faster and more accurate detection of fentanyl. This trend allows for quicker interventions and improved patient outcomes.

Opioid Analgesics Market:

Attributes Opioid Analgesics Market
CAGR (2023 to 2033) 5.4%
Market Value (2033) US$ 73.2 billion
Opportunity The field of cancer treatment is advancing rapidly, with a growing number of patients undergoing chemotherapy, radiation therapy, and surgery. These treatments often result in severe pain that requires effective management. Opioid analgesics are commonly used in cancer pain management, presenting a significant opportunity in this segment.
Key Trends In response to the opioid crisis and concerns about opioid misuse, there has been a significant trend towards the development and utilization of abuse-deterrent formulations (ADF). These formulations are designed to deter or make it more difficult to abuse opioids by specific routes, such as crushing, snorting, or injecting.

Opioid Use Disorder Treatment Market:

Attributes Opioid Use Disorder Treatment Market
CAGR (2023 to 2033) 10.5%
Market Value (2033) US$ 8.4 billion
Opportunity The growing awareness of the opioid crisis has led to increased attention and focus on opioid addiction and its treatment. This heightened awareness has created an opportunity for the OUD treatment market to expand as healthcare providers, policymakers, and society as a whole recognize the need for effective interventions.
Key Trends Medication-Assisted Treatment (MAT) continues to be a dominant trend in OUD treatment. FDA-approved medications, such as methadone, naltrexone, and buprenorphine, are commonly used in MAT, in combination with counseling and behavioral therapies. MAT has gained recognition as an effective approach to OUD treatment, and there is an increasing emphasis on expanding access to MAT services.
Sabyasachi Ghosh
Sabyasachi Ghosh

Principal Consultant

Talk to Analyst

Find your sweet spots for generating winning opportunities in this market.

Country-Wise Insights

Point-of-Care Fentanyl Test Kits Market to Surge in the United States Due to Opioid Crisis & Fentanyl Epidemic

Country The United States
Market Size (US$ million) by End of Forecast Period (2033) US$ 61.8 million
CAGR % 2023 to End of Forecast (2033) 6.0%

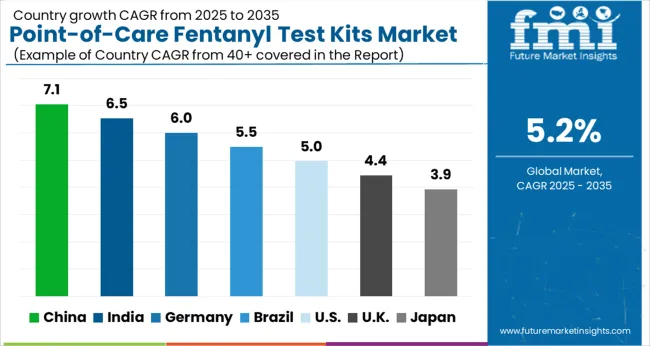
The point-of-care fentanyl test kits industry in the United States is expected to reach a market size of US$ 61.8 million by 2033, expanding at a CAGR of 6.0%. The opioid crisis in the United States has reached alarming levels, with fentanyl contributing significantly to overdose deaths. Fentanyl is a potent synthetic opioid that is often mixed with other drugs, leading to accidental overdoses. The need for accurate and rapid detection of fentanyl at the point of care has become crucial in combating the opioid crisis, driving the demand for fentanyl test kits.

Rise in Fentanyl Misuse in United Kingdom Has Propelled the Market

Country The United Kingdom
Market Size (US$ million) by End of Forecast Period (2033) US$ 10.0 million
CAGR % 2023 to End of Forecast (2033) 6.2%

The point-of-care fentanyl test kits industry in the United Kingdom is expected to reach a market size of US$ 10.0 million, expanding at a CAGR of 6.2% during the forecast period. The United Kingdom has seen an increase in the misuse and illicit distribution of fentanyl, which has raised concerns about its impact on public health and safety. Fentanyl is a potent synthetic opioid that poses a significant risk of overdose and death. The need for accurate and accessible fentanyl testing at the point of care has become crucial to address this growing concern.

Notable Growth Expected in China's Point-of-Care Fentanyl Test Kits Market due to Rising Awareness & Education

Country China
Market Size (US$ million) by End of Forecast Period (2033) US$ 11.1 million
CAGR % 2023 to End of Forecast (2033) 5.9%

The point-of-care fentanyl test kits industry in China is anticipated to reach a market size of US$ 11.1 million, moving at a CAGR of 5.9% during the forecast period. The Chinese government, along with healthcare organizations and non-profit groups, is actively involved in raising awareness about the risks associated with fentanyl use. Public education campaigns and targeted interventions aim to inform the public, healthcare professionals, and relevant stakeholders about the dangers of fentanyl and the importance of testing. Increased awareness drives the demand for point-of-care fentanyl test kits as a preventive measure.
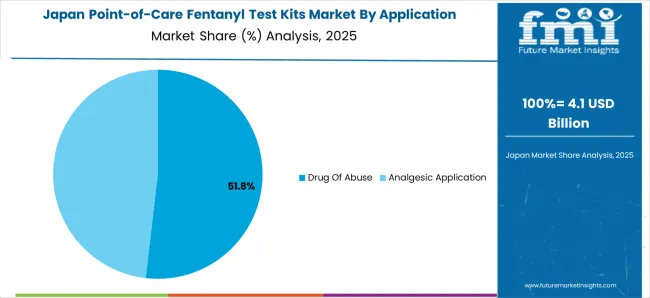
Technological Advancement in Test Kits is Driving Market Growth in Japan

Country Japan
Market Size (US$ million) by End of Forecast Period (2033) US$ 8.2 million
CAGR % 2023 to End of Forecast (2033) 5.8%

The point-of-care fentanyl test kits industry in Japan is estimated to reach a market size of US$ 8.2 million by 2033, thriving at a CAGR of 5.8%. The point-of-care fentanyl test kits market in Japan is influenced by advancements in technology and product innovations. Manufacturers are continuously developing more sensitive, specific, and user-friendly test kits that deliver rapid and accurate results. These advancements contribute to the wider adoption and use of point-of-care fentanyl test kits in various healthcare and non-healthcare settings.

Demand for Point-of-Care Fentanyl Test Kits Market is Rising Due to Drug Testing & Monitoring Programs

table style="width:100%"> Country South Korea Market Size (US$ million) by End of Forecast Period (2033) US$ 6.1 million CAGR % 2023 to End of Forecast (2033) 5.6%

The point-of-care fentanyl test kits industry in South Korea is expected to reach a market size of US$ 6.1 million, expanding at a CAGR of 5.6% during the forecast period. Drug testing and monitoring programs are gaining prominence in South Korea, particularly in workplaces, educational institutions, and rehabilitation centers. These programs aim to identify drug use and provide appropriate interventions. Fentanyl detection is a critical component of these programs due to its high potency and potential risks. Point-of-care fentanyl test kits offer a convenient and rapid screening tool for detecting fentanyl in urine or other samples, supporting the effectiveness of drug testing initiatives.

Category-Wise Insights

Which Application Are Driving the Point-of-Care Fentanyl Test Kits Market?

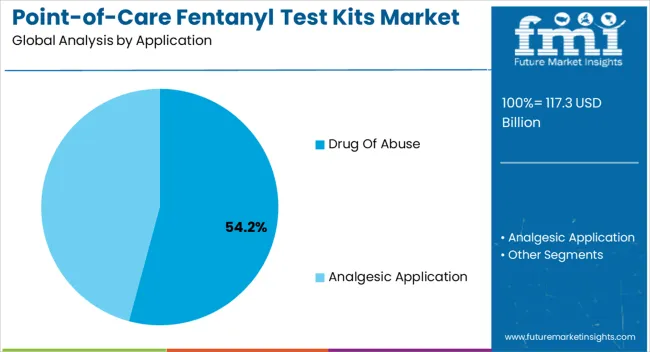
Drug of Abuse are expected to dominate the point-of-care fentanyl test kits industry with a CAGR of 5.2% from 2023 to 2033. The development of advanced technologies in point-of-care fentanyl test kits has significantly contributed to their market growth. Innovations such as improved sensitivity, specificity, and ease of use have made these test kits more reliable and accessible. Manufacturers continue to invest in research and development to enhance the performance and efficiency of point-of-care fentanyl test kits, driving their adoption in drug abuse testing programs.

Which End User is Widely Adopted the Point-of-Care Fentanyl Test Kits Market?

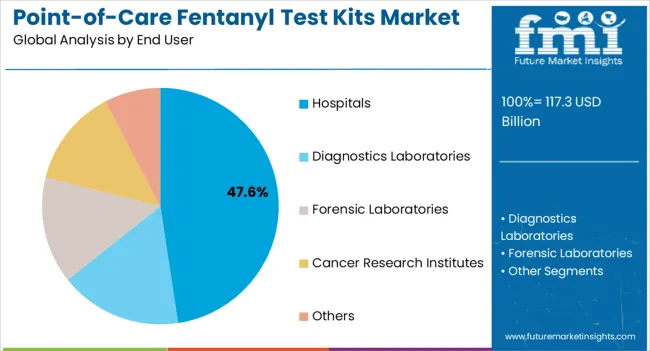
Forensic Laboratories is expected to dominate the point-of-care fentanyl test kits industry with a CAGR of 5.7% from 2023 to 2033. Forensic investigations often take place at crime scenes or other field settings, where immediate drug detection is crucial. Point-of-care fentanyl test kits enable forensic professionals to conduct preliminary drug screening at the scene, providing real-time information for decision-making and ensuring the collection of relevant evidence. This aids in the effective investigation of drug-related crimes and enhances the overall efficiency of forensic processes.
Get the data you need at a Fraction of the cost

Personalize your report by choosing insights you need
and save 40%!

How Key Players Stay Competitive in the Point-of-care Fentanyl Test Kits Market Industry?

The point-of-care fentanyl test kits market is fiercely competitive, with many companies fighting for market dominance. To stay ahead of the competition in such a circumstance, essential players must develop effective conjugates.

Key Strategies Used by the Participants

  • Product Development

Companies are investing in research & development to deliver product that improve efficiency, dependability, and cost-effectiveness. Product innovation allows businesses to differentiate themselves from their competition while also catering to the changing demands of their clients.

  • Strategic Alliances & Collaborations

Key industry leaders frequently develop strategic partnerships and collaborations with other companies in order to harness their strengths and increase their market reach. Companies might also gain access to new technology and markets through such agreements.

  • Expansion into Emerging Markets

The point-of-care fentanyl test kits market is expanding rapidly in emerging regions such as China and India. Key firms are enhancing their distribution networks and developing local manufacturing facilities to increase their presence in these areas.

  • Acquisitions and mergers

Mergers and acquisitions are frequently used by key players in the point-of-care fentanyl test kits industry to consolidate their market position, extend their product range, and gain access to new markets.

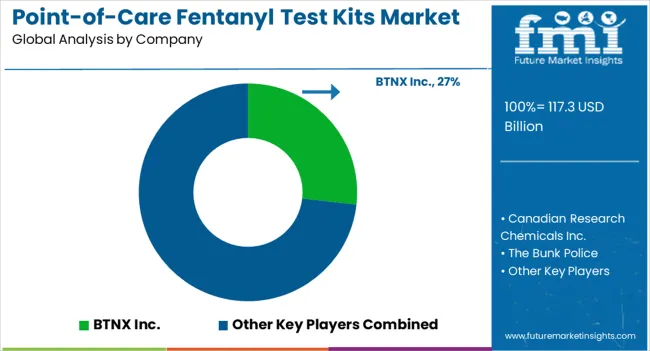
Key Players in the Point-of-Care Fentanyl Test Kits Market Industry

  • BTNX Inc.
  • Canadian Research Chemicals Inc.
  • The Bunk Police
  • DanceSafe
  • Microgenics Corporation
  • NarcCheck
  • Opioid Crisis Response Network (OCRN)
  • SD Biosensor, Inc.
  • Toronto Research Chemicals Inc.
  • Wondfo
  • Carolina Liquid Chemistries Corp.

Key Developments in the Point-of-Care Fentanyl Test Kits Market:

  • In March 2023, USFDA has approved Carolina Liquid Chemistries Corp.'s Shenzhen Superbio Technology product for its point-of-care instrument meant for qualitative identification of fentanyl within human urine and has fully authorised Bioeasy USA to sell this product in the USA
  • In January 2023, Meridian Bioscience, Inc., SD Biosensor, Inc., and SJL Partners LLC announced that the acquisition of Meridian had been completed.

Segmentation Analysis of the Point-of-Care Fentanyl Test Kits Market

By Application:

  • Drug of Abuse
  • Analgesic Application

By End User:

  • Hospitals
  • Diagnostics Laboratories
  • Forensic Laboratories
  • Cancer Research Institutes
  • Others

By Region:

  • North America
  • Latin America
  • Europe
  • East Asia
  • South Asia
  • Oceania
  • The Middle East & Africa

Frequently Asked Questions

How Much the Point-of-Care Fentanyl Test Kits Market is Slated to Attain?

The point-of-care fentanyl test kits market is slated to attain US$ 105.4 million in 2023.

At What Speed, the Market is Expected to Expand?

The market is expected to expand at a CAGR of 5.5% through 2033.

Which Factors are Stimulating Market Growth?

Widespread prevalence of fentanyl abuse and advances in testing technologies are stimulating the market growth.

Which Trend has Taken Over the Global Market?

Integration of point-of-care fentanyl test kits with EHRs is a major trend in the global market.

Which Opportunity is Cropping up in the Market?

The ongoing opioid crisis is creating an opportunity for the point-of-care fentanyl test kits market players.

Table of Content

1. Executive Summary

    1.1. Global Market Outlook

    1.2. Demand Side Trends

    1.3. Supply Side Trends

    1.4. Analysis and Recommendations

2. Market Overview

    2.1. Market Coverage / Taxonomy

    2.2. Market Definition / Scope / Limitations

    2.3. Inclusions and Exclusions

3. Key Market Trends

    3.1. Key Trends Impacting the Market

    3.2. Product Innovation / Development Trends

4. Value Added Insights

    4.1. Product Adoption/ Usage Analysis

    4.2. Regulatory Landscape

    4.3. PESTEL Analysis

    4.4. Porter’s Analysis

    4.5. Value Chain Analysis

5. Market Background

    5.1. Macro-Economic Factors

        5.1.1. Global GDP Growth Outlook

        5.1.2. Global Healthcare Expenditure Outlook

        5.1.3. Global Drug of Abuse Testing Market

    5.2. Forecast Factors - Relevance & Impact

        5.2.1. Key Player’s Historic Growth

        5.2.2. Diagnosis Rate (%)

        5.2.3. Favourable Government Regulations

        5.2.4. Rising Demand for Fentanyl Test Kits

        5.2.5. Cost Per Kit

        5.2.6. Increasing Incidence of Drug Abuse

        5.2.7. Frequency of Product Approvals

    5.3. Dynamics

        5.3.1. Drivers

        5.3.2. Restraints

        5.3.3. Opportunity Analysis

6. Global Market Volume (in Units) Analysis 2017 to 2022 and Forecast, 2023 to 2033

    6.1. Historical Volume (in Units) Analysis, 2017 to 2022

    6.2. Current and Future Volume (in Units) Projections, 2023 to 2033

        6.2.1. Y-o-Y Growth Trend Analysis

7. Global Market - Pricing Analysis

    7.1. Regional Pricing Analysis By Product

    7.2. Pricing Break-up

        7.2.1. Manufacturer Level Pricing

        7.2.2. Distributor Level Pricing

    7.3. Global Average Pricing Analysis Benchmark

    7.4. Pricing Assumptions

8. Global Market Demand (in Value or Size in US$ Mn) Analysis 2017 to 2022 and Forecast, 2023 to 2033

    8.1. Historical Market Value (US$ Million) Analysis, 2017 to 2022

    8.2. Current and Future Market Value (US$ Million) Projections, 2023 to 2033

        8.2.1. Y-o-Y Growth Trend Analysis

        8.2.2. Absolute $ Opportunity Analysis

9. Global Market Analysis 2017 to 2022 and Forecast 2023 to 2033, By Application

    9.1. Introduction / Key Findings

    9.2. Historical Market Size (US$ Million) Analysis By Application, 2017 to 2022

    9.3. Current and Future Market Size (US$ Million) Analysis and Forecast By Application, 2023 to 2033

        9.3.1. Drug of Abuse

        9.3.2. Analgesic Application

    9.4. Market Attractiveness Analysis By Application

10. Global Market Analysis 2017 to 2022 and Forecast 2023 to 2033, By End User

    10.1. Introduction / Key Findings

    10.2. Historical Market Size (US$ Million) Analysis By End User, 2017 to 2022

    10.3. Current and Future Market Size (US$ Million) Analysis and Forecast By End User, 2023 to 2033

        10.3.1. Hospitals

        10.3.2. Diagnostics Laboratories

        10.3.3. Forensic Laboratories

        10.3.4. Cancer Research Institutes

        10.3.5. Others

    10.4. Market Attractiveness Analysis By End User

11. Global Market Analysis 2017 to 2022 and Forecast 2023 to 2033, by Region

    11.1. Introduction

    11.2. Historical Market Size (US$ Million) and Volume (Units) Analysis By Region, 2017 to 2022

    11.3. Current and Future Market Size (US$ Million) and Volume (Units) Analysis and Forecast By Region, 2023 to 2033

        11.3.1. North America

        11.3.2. Latin America

        11.3.3. Europe

        11.3.4. South Asia

        11.3.5. East Asia

        11.3.6. Oceania

        11.3.7. Middle East and Africa (Middle East & Africa)

    11.4. Market Attractiveness Analysis By Region

12. North America Market Analysis 2017 to 2022 and Forecast 2023 to 2033

    12.1. Introduction

    12.2. Historical Market Size (US$ Million) and Volume (Units) Analysis By Market Taxonomy, 2017 to 2022

    12.3. Current and Future Market Size (US$ Million) and Volume (Units) Analysis and Forecast By Market Taxonomy, 2023 to 2033

        12.3.1. By Country

            12.3.1.1. USA

            12.3.1.2. Canada

        12.3.2. By Application

        12.3.3. By End User

    12.4. Market Attractiveness Analysis

        12.4.1. By Country

        12.4.2. By Application

        12.4.3. By End User

    12.5. Country Level Analysis & Forecast

        12.5.1. USA Market Analysis

            12.5.1.1. Introduction

            12.5.1.2. Market Analysis and Forecast by Market Taxonomy

                12.5.1.2.1. By Application

                12.5.1.2.2. By End User

        12.5.2. Canada Market Analysis

            12.5.2.1. Introduction

            12.5.2.2. Market Analysis and Forecast by Market Taxonomy

                12.5.2.2.1. By Application

                12.5.2.2.2. By End User

    12.6. Market Trends

    12.7. Key Market Participants - Intensity Mapping

    12.8. Drivers and Restraints - Impact Analysis

13. Latin America Market Analysis 2017 to 2022 and Forecast 2023 to 2033

    13.1. Introduction

    13.2. Historical Market Size (US$ Million) and Volume (Units) Analysis By Market Taxonomy, 2017 to 2022

    13.3. Current and Future Market Size (US$ Million) and Volume (Units) Analysis and Forecast By Market Taxonomy, 2023 to 2033

        13.3.1. By Country

            13.3.1.1. Brazil

            13.3.1.2. Mexico

            13.3.1.3. Argentina

            13.3.1.4. Rest of Latin America

        13.3.2. By Application

        13.3.3. By End User

    13.4. Market Attractiveness Analysis

        13.4.1. By Country

        13.4.2. By Application

        13.4.3. By End User

    13.5. Country Level Analysis & Forecast

        13.5.1. Brazil Market Analysis

            13.5.1.1. Introduction

            13.5.1.2. Market Analysis and Forecast by Market Taxonomy

                13.5.1.2.1. By Application

                13.5.1.2.2. By End User

        13.5.2. Mexico Market Analysis

            13.5.2.1. Introduction

            13.5.2.2. Market Analysis and Forecast by Market Taxonomy

                13.5.2.2.1. By Application

                13.5.2.2.2. By End User

        13.5.3. Argentina Market Analysis

            13.5.3.1. Introduction

            13.5.3.2. Market Analysis and Forecast by Market Taxonomy

                13.5.3.2.1. By Application

                13.5.3.2.2. By End User

    13.6. Market Trends

    13.7. Key Market Participants - Intensity Mapping

    13.8. Drivers and Restraints - Impact Analysis

14. Europe Market Analysis 2017 to 2022 and Forecast 2023 to 2033

    14.1. Introduction

    14.2. Historical Market Size (US$ Million) and Volume (Units) Analysis By Market Taxonomy, 2017 to 2022

    14.3. Current and Future Market Size (US$ Million) and Volume (Units) Analysis and Forecast By Market Taxonomy, 2023 to 2033

        14.3.1. By Country

            14.3.1.1. Germany

            14.3.1.2. France

            14.3.1.3. Italy

            14.3.1.4. UK

            14.3.1.5. Spain

            14.3.1.6. Russia

            14.3.1.7. BENELUX

            14.3.1.8. Rest of Europe

        14.3.2. By Application

        14.3.3. By End User

    14.4. Market Attractiveness Analysis

        14.4.1. By Country

        14.4.2. By Application

        14.4.3. By Material

        14.4.4. By End User

    14.5. Country Level Analysis & Forecast

        14.5.1. Germany Market Analysis

            14.5.1.1. Introduction

            14.5.1.2. Market Analysis and Forecast by Market Taxonomy

                14.5.1.2.1. By Application

                14.5.1.2.2. By End User

        14.5.2. France Market Analysis

            14.5.2.1. Introduction

            14.5.2.2. Market Analysis and Forecast by Market Taxonomy

                14.5.2.2.1. By Application

                14.5.2.2.2. By End User

        14.5.3. Italy Market Analysis

            14.5.3.1. Introduction

            14.5.3.2. Market Analysis and Forecast by Market Taxonomy

                14.5.3.2.1. By Application

                14.5.3.2.2. By End User

        14.5.4. UK Market Analysis

            14.5.4.1. Introduction

            14.5.4.2. Market Analysis and Forecast by Market Taxonomy

                14.5.4.2.1. By Application

                14.5.4.2.2. By End User

        14.5.5. Spain Market Analysis

            14.5.5.1. Introduction

            14.5.5.2. Market Analysis and Forecast by Market Taxonomy

                14.5.5.2.1. By Application

                14.5.5.2.2. By End User

        14.5.6. Russia Market Analysis

            14.5.6.1. Introduction

            14.5.6.2. Market Analysis and Forecast by Market Taxonomy

                14.5.6.2.1. By Application

                14.5.6.2.2. By End User

        14.5.7. BENELUX Market Analysis

            14.5.7.1. Introduction

            14.5.7.2. Market Analysis and Forecast by Market Taxonomy

                14.5.7.2.1. By Application

                14.5.7.2.2. By End User

    14.6. Market Trends

    14.7. Key Market Participants - Intensity Mapping

    14.8. Drivers and Restraints - Impact Analysis

15. South Asia Market Analysis 2017 to 2022 and Forecast 2023 to 2033

    15.1. Introduction

    15.2. Historical Market Size (US$ Million) and Volume (Units) Analysis By Market Taxonomy, 2017 to 2022

    15.3. Current and Future Market Size (US$ Million) and Volume (Units) Analysis and Forecast By Market Taxonomy, 2023 to 2033

        15.3.1. By Country

            15.3.1.1. India

            15.3.1.2. Thailand

            15.3.1.3. Indonesia

            15.3.1.4. Malaysia

            15.3.1.5. Rest of South Asia

        15.3.2. By Application

        15.3.3. By End User

    15.4. Market Attractiveness Analysis

        15.4.1. By Country

        15.4.2. By Application

        15.4.3. By End User

    15.5. Country Level Analysis & Forecast

        15.5.1. India Market Analysis

            15.5.1.1. Introduction

            15.5.1.2. Market Analysis and Forecast by Market Taxonomy

                15.5.1.2.1. By Application

                15.5.1.2.2. By End User

        15.5.2. Thailand Market Analysis

            15.5.2.1. Introduction

            15.5.2.2. Market Analysis and Forecast by Market Taxonomy

                15.5.2.2.1. By Application

                15.5.2.2.2. By End User

        15.5.3. Indonesia Market Analysis

            15.5.3.1. Introduction

            15.5.3.2. Market Analysis and Forecast by Market Taxonomy

                15.5.3.2.1. By Application

                15.5.3.2.2. By End User

        15.5.4. Malaysia Market Analysis

            15.5.4.1. Introduction

            15.5.4.2. Market Analysis and Forecast by Market Taxonomy

                15.5.4.2.1. By Application

                15.5.4.2.2. By End User

    15.6. Market Trends

    15.7. Key Market Participants - Intensity Mapping

    15.8. Drivers and Restraints - Impact Analysis

16. East Asia Market Analysis 2017 to 2022 and Forecast 2023 to 2033

    16.1. Introduction

    16.2. Historical Market Size (US$ Million) and Volume (Units) Analysis By Market Taxonomy, 2017 to 2022

    16.3. Current and Future Market Size (US$ Million) and Volume (Units) Analysis and Forecast By Market Taxonomy, 2023 to 2033

        16.3.1. By Country

            16.3.1.1. China

            16.3.1.2. Japan

            16.3.1.3. South Korea

        16.3.2. By Application

        16.3.3. By End User

    16.4. Market Attractiveness Analysis

        16.4.1. By Country

        16.4.2. By Application

        16.4.3. By End User

    16.5. Country Level Analysis & Forecast

        16.5.1. China Market Analysis

            16.5.1.1. Introduction

            16.5.1.2. Market Analysis and Forecast by Market Taxonomy

                16.5.1.2.1. By Application

                16.5.1.2.2. By End User

        16.5.2. Japan Market Analysis

            16.5.2.1. Introduction

            16.5.2.2. Market Analysis and Forecast by Market Taxonomy

                16.5.2.2.1. By Application

                16.5.2.2.2. By End User

        16.5.3. South Korea Market Analysis

            16.5.3.1. Introduction

            16.5.3.2. Market Analysis and Forecast by Market Taxonomy

                16.5.3.2.1. By Application

                16.5.3.2.2. By End User

    16.6. Market Trends

    16.7. Key Market Participants - Intensity Mapping

    16.8. Drivers and Restraints - Impact Analysis

17. Oceania Market Analysis 2017 to 2022 and Forecast 2023 to 2033

    17.1. Introduction

    17.2. Historical Market Size (US$ Million) and Volume (Units) Analysis By Market Taxonomy, 2017 to 2022

    17.3. Current and Future Market Size (US$ Million) and Volume (Units) Analysis and Forecast By Market Taxonomy, 2023 to 2033

        17.3.1. By Country

            17.3.1.1. Australia

            17.3.1.2. New Zealand

        17.3.2. By Application

        17.3.3. By End User

    17.4. Market Attractiveness Analysis

        17.4.1. By Country

        17.4.2. By Application

        17.4.3. By End User

    17.5. Country Level Analysis & Forecast

        17.5.1. Australia Market Analysis

            17.5.1.1. Introduction

            17.5.1.2. Market Analysis and Forecast by Market Taxonomy

                17.5.1.2.1. By Application

                17.5.1.2.2. By End User

        17.5.2. New Zealand Market Analysis

            17.5.2.1. Introduction

            17.5.2.2. Market Analysis and Forecast by Market Taxonomy

                17.5.2.2.1. By Application

                17.5.2.2.2. By End User

    17.6. Market Trends

    17.7. Key Market Participants - Intensity Mapping

    17.8. Drivers and Restraints - Impact Analysis

18. Middle East and Africa Market Analysis 2017 to 2022 and Forecast 2023 to 2033

    18.1. Introduction

    18.2. Historical Market Size (US$ Million) and Volume (Units) Analysis By Market Taxonomy, 2017 to 2022

    18.3. Current and Future Market Size (US$ Million) and Volume (Units) Analysis and Forecast By Market Taxonomy, 2023 to 2033

        18.3.1. By Country

            18.3.1.1. GCC Countries

            18.3.1.2. Türkiye

            18.3.1.3. Northern Africa

            18.3.1.4. South Africa

            18.3.1.5. Rest of Middle East and Africa

        18.3.2. By Application

        18.3.3. By End User

    18.4. Market Attractiveness Analysis

        18.4.1. By Country

        18.4.2. By Application

        18.4.3. By End User

    18.5. Country Level Analysis & Forecast

        18.5.1. GCC Countries Market Analysis

            18.5.1.1. Introduction

            18.5.1.2. Market Analysis and Forecast by Market Taxonomy

                18.5.1.2.1. By Application

                18.5.1.2.2. By End User

        18.5.2. Türkiye Market Analysis

            18.5.2.1. Introduction

            18.5.2.2. Market Analysis and Forecast by Market Taxonomy

                18.5.2.2.1. By Application

                18.5.2.2.2. By End User

        18.5.3. Northern Africa Market Analysis

            18.5.3.1. Introduction

            18.5.3.2. Market Analysis and Forecast by Market Taxonomy

                18.5.3.2.1. By Application

                18.5.3.2.2. By End User

        18.5.4. South Africa Market Analysis

            18.5.4.1. Introduction

            18.5.4.2. Market Analysis and Forecast by Market Taxonomy

                18.5.4.2.1. By Application

                18.5.4.2.2. By End User

    18.6. Market Trends

    18.7. Key Market Participants - Intensity Mapping

    18.8. Drivers and Restraints - Impact Analysis

19. Market Structure Analysis

    19.1. Market Analysis by Tier of Companies

    19.2. Market Share Analysis of Top Players

    19.3. Market Presence Analysis

20. Competition Analysis

    20.1. Competition Dashboard

    20.2. Branding and Promotional Strategies, By Key Players

    20.3. Key Development Analysis

    20.4. Competition Deep Dive

        20.4.1. BTNX Inc.

            20.4.1.1. Overview

            20.4.1.2. Product Portfolio

            20.4.1.3. Key Financials

            20.4.1.4. Sales Footprint

            20.4.1.5. SWOT Analysis

            20.4.1.6. Strategy Overview

                20.4.1.6.1. Marketing Strategy

                20.4.1.6.2. Product Strategy

                20.4.1.6.3. Channel Strategy

        20.4.2. Canadian Research Chemicals Inc.

        20.4.3. The Bunk Police

        20.4.4. DanceSafe

        20.4.5. Microgenics Corporation

        20.4.6. NarcCheck

        20.4.7. Opioid Crisis Response Network (OCRN)

        20.4.8. SD Biosensor, Inc.

        20.4.9. Toronto Research Chemicals Inc.

        20.4.10. Wondfo

        20.4.11. Carolina Liquid Chemistries Corp.

21. Assumptions and Acronyms Used

22. Research Methodology

List of Tables

Table 01: Global Market Value (US$ Million) Analysis and Forecast 2017 to 2023, by Application

Table 02: Global Market Value (US$ Million) Analysis and Forecast 2017 to 2023, by End User

Table 03: Global Market Value (US$ Million) Analysis and Forecast 2017 to 2023, by Region

Table 04: Global Market Volume (Units) Analysis and Forecast 2017 to 2023, by Region

Table 05: North America Market Value (US$ Million) Analysis 2017 to 2022 and Forecast 2023 to 2033, by Country

Table 06: North America Market Volume (Units) Analysis and Forecast 2017 to 2023, by Country

Table 07: North America Market Value (US$ Million) Analysis and Forecast 2017 to 2023, by Application

Table 08: North America Market Value (US$ Million) Analysis and Forecast 2017 to 2023, by End User

Table 09: Latin America Market Value (US$ Million) Analysis 2017 to 2022 and Forecast 2023 to 2033, by Country

Table 10: Latin America Market Volume (Units) Analysis and Forecast 2017 to 2023, by Country

Table 11: Latin America Market Value (US$ Million) Analysis and Forecast 2017 to 2023, by Application

Table 12: Latin America Market Value (US$ Million) Analysis and Forecast 2017 to 2023, by End User

Table 13: Europe Market Value (US$ Million) Analysis 2017 to 2022 and Forecast 2023 to 2033, by Country

Table 14: Europe Market Volume (Units) Analysis and Forecast 2017 to 2023, by Country

Table 15: Europe Market Value (US$ Million) Analysis and Forecast 2017 to 2023, by Application

Table 16: Europe Market Value (US$ Million) Analysis and Forecast 2017 to 2023, by End User

Table 17: South Asia Market Value (US$ Million) Analysis 2017 to 2022 and Forecast 2023 to 2033, by Country

Table 18: South Asia Market Volume (Units) Analysis and Forecast 2017 to 2023, by Country

Table 19: South Asia Market Value (US$ Million) Analysis and Forecast 2017 to 2023, by Application

Table 20: South Asia Market Value (US$ Million) Analysis and Forecast 2017 to 2023, by End User

Table 21: East Asia Market Value (US$ Million) Analysis 2017 to 2022 and Forecast 2023 to 2033, by Country

Table 22: East Asia Market Volume (Units) Analysis and Forecast 2017 to 2023, by Country

Table 23: East Asia Market Value (US$ Million) Analysis and Forecast 2017 to 2023, by Application

Table 24: East Asia Market Value (US$ Million) Analysis and Forecast 2017 to 2023, by End User

Table 25: Oceania Market Value (US$ Million) Analysis 2017 to 2022 and Forecast 2023 to 2033, by Country

Table 26: Oceania Market Volume (Units) Analysis and Forecast 2017 to 2023, by Country

Table 27: Oceania Market Value (US$ Million) Analysis and Forecast 2017 to 2023, by Application

Table 28: Oceania Market Value (US$ Million) Analysis and Forecast 2017 to 2023, by End User

Table 29: Middle East & Africa Market Value (US$ Million) Analysis 2017 to 2022 and Forecast 2023 to 2033, by Country

Table 30: Middle East & Africa Market Volume (Units) Analysis and Forecast 2017 to 2023, by Country

Table 31: Middle East & Africa Market Value (US$ Million) Analysis and Forecast 2017 to 2023, by Application

Table 32: Middle East & Africa Market Value (US$ Million) Analysis and Forecast 2017 to 2023, by End User

List of Charts

Figure 01: Global Market Volume (Units), 2017 to 2022

Figure 02: Global Market Volume (Units) & Y-o-Y Growth (%) Analysis, 2023 to 2033

Figure 03: Pricing Analysis per unit (US$), in 2022

Figure 04: Pricing Forecast per unit (US$), in 2033

Figure 05: Global Market Value (US$ Million) Analysis, 2017 to 2022

Figure 06: Global Market Forecast & Y-o-Y Growth, 2023 to 2033

Figure 07: Global Market Absolute $ Opportunity (US$ Million) Analysis, 2023 to 2033

Figure 08: Global Market Value Share (%) Analysis 2023 and 2033, by Application

Figure 09: Global Market Y-o-Y Growth (%) Analysis 2023-2033, by Application

Figure 10: Global Market Attractiveness Analysis 2023 to 2033, by Application

Figure 11: Global Market Value Share (%) Analysis 2023 and 2033, by End User

Figure 12: Global Market Y-o-Y Growth (%) Analysis 2023-2033, by End User

Figure 13: Global Market Attractiveness Analysis 2023 to 2033, by End User

Figure 14: Global Market Value Share (%) Analysis 2023 and 2033, by Region

Figure 15: Global Market Y-o-Y Growth (%) Analysis 2023-2033, by Region

Figure 16: Global Market Attractiveness Analysis 2023 to 2033, by Region

Figure 17: North America Market Value (US$ Million) Analysis, 2017 to 2022

Figure 18: North America Market Value (US$ Million) Forecast, 2022 to 2032

Figure 19: North America Market Value Share, by Application (2023 E)

Figure 20: North America Market Value Share, by End User (2023 E)

Figure 21: North America Market Value Share, by Country (2023 E)

Figure 22: North America Market Attractiveness Analysis by Application, 2023 to 2033

Figure 23: North America Market Attractiveness Analysis by End User, 2023 to 2033

Figure 24: North America Market Attractiveness Analysis by Country, 2023 to 2033

Figure 25: USA Market Value Proportion Analysis, 2022

Figure 26: Global Vs. USA Growth Comparison

Figure 27: USA Market Share Analysis (%) by Application, 2022 & 2032

Figure 28: USA Market Share Analysis (%) by End User, 2022 & 2032

Figure 29: Canada Market Value Proportion Analysis, 2022

Figure 30: Global Vs. Canada. Growth Comparison

Figure 31: Canada Market Share Analysis (%) by Application, 2023 & 2033

Figure 32: Canada Market Share Analysis (%) by End User, 2023 & 2033

Figure 33: Latin America Market Value (US$ Million) Analysis, 2017 to 2022

Figure 34: Latin America Market Value (US$ Million) Forecast, 2022 to 2032

Figure 35: Latin America Market Value Share, by Application (2023 E)

Figure 36: Latin America Market Value Share, by End User (2023 E)

Figure 37: Latin America Market Value Share, by Country (2023 E)

Figure 38: Latin America Market Attractiveness Analysis by Application, 2023 to 2033

Figure 39: Latin America Market Attractiveness Analysis by End User, 2023 to 2033

Figure 40: Latin America Market Attractiveness Analysis by Country, 2023 to 2033

Figure 41: Mexico Market Value Proportion Analysis, 2022

Figure 42: Global Vs Mexico Growth Comparison

Figure 43: Mexico Market Share Analysis (%) by Application, 2023 & 2033

Figure 44: Mexico Market Share Analysis (%) by End User, 2023 & 2033

Figure 45: Brazil Market Value Proportion Analysis, 2022

Figure 46: Global Vs. Brazil. Growth Comparison

Figure 47: Brazil Market Share Analysis (%) by Application, 2023 & 2033

Figure 48: Brazil Market Share Analysis (%) by End User, 2023 & 2033

Figure 49: Argentina Market Value Proportion Analysis, 2022

Figure 50: Global Vs Argentina Growth Comparison

Figure 51: Argentina Market Share Analysis (%) by Application, 2023 & 2033

Figure 52: Argentina Market Share Analysis (%) by End User, 2023 & 2033

Figure 53: Europe Market Value (US$ Million) Analysis, 2017 to 2022

Figure 54: Europe Market Value (US$ Million) Forecast, 2022 to 2032

Figure 55: Europe Market Value Share, by Application (2023 E)

Figure 56: Europe Market Value Share, by End User (2023 E)

Figure 57: Europe Market Value Share, by Country (2023 E)

Figure 58: Europe Market Attractiveness Analysis by Application, 2023 to 2033

Figure 59: Europe Market Attractiveness Analysis by End User, 2023 to 2033

Figure 60: Europe Market Attractiveness Analysis by Country, 2023 to 2033

Figure 61: UK Market Value Proportion Analysis, 2022

Figure 62: Global Vs. UK Growth Comparison

Figure 63: UK Market Share Analysis (%) by Application, 2023 & 2033

Figure 64: UK Market Share Analysis (%) by End User, 2023 & 2033

Figure 65: Germany Market Value Proportion Analysis, 2022

Figure 66: Global Vs. Germany Growth Comparison

Figure 67: Germany Market Share Analysis (%) by Application, 2023 & 2033

Figure 68: Germany Market Share Analysis (%) by End User, 2023 & 2033

Figure 69: Italy Market Value Proportion Analysis, 2022

Figure 70: Global Vs. Italy Growth Comparison

Figure 71: Italy Market Share Analysis (%) by Application, 2023 & 2033

Figure 72: Italy Market Share Analysis (%) by End User, 2023 & 2033

Figure 73: France Market Value Proportion Analysis, 2022

Figure 74: Global Vs France Growth Comparison

Figure 75: France Market Share Analysis (%) by Application, 2023 & 2033

Figure 76: France Market Share Analysis (%) by End User, 2023 & 2033

Figure 77: Spain Market Value Proportion Analysis, 2022

Figure 78: Global Vs Spain Growth Comparison

Figure 79: Spain Market Share Analysis (%) by Application, 2023 & 2033

Figure 80: Spain Market Share Analysis (%) by End User, 2023 & 2033

Figure 81: Russia Market Value Proportion Analysis, 2022

Figure 82: Global Vs Russia Growth Comparison

Figure 83: Russia Market Share Analysis (%) by Application, 2023 & 2033

Figure 84: Russia Market Share Analysis (%) by End User, 2023 & 2033

Figure 85: BENELUX Market Value Proportion Analysis, 2022

Figure 86: Global Vs BENELUX Growth Comparison

Figure 87: BENELUX Market Share Analysis (%) by Application, 2023 & 2033

Figure 88: BENELUX Market Share Analysis (%) by End User, 2023 & 2033

Figure 89: East Asia Market Value (US$ Million) Analysis, 2017 to 2022

Figure 90: East Asia Market Value (US$ Million) Forecast, 2022 to 2032

Figure 91: East Asia Market Value Share, by Application (2023 E)

Figure 92: East Asia Market Value Share, by End User (2023 E)

Figure 93: East Asia Market Value Share, by Country (2023 E)

Figure 94: East Asia Market Attractiveness Analysis by Application, 2023 to 2033

Figure 95: East Asia Market Attractiveness Analysis by End User, 2023 to 2033

Figure 96: East Asia Market Attractiveness Analysis by Country, 2023 to 2033

Figure 97: China Market Value Proportion Analysis, 2022

Figure 98: Global Vs. China Growth Comparison

Figure 99: China Market Share Analysis (%) by Application, 2023 & 2033

Figure 100: China Market Share Analysis (%) by End User, 2023 & 2033

Figure 101: Japan Market Value Proportion Analysis, 2022

Figure 102: Global Vs. Japan Growth Comparison

Figure 103: Japan Market Share Analysis (%) by Application, 2023 & 2033

Figure 104: Japan Market Share Analysis (%) by End User, 2023 & 2033

Figure 105: South Korea Market Value Proportion Analysis, 2022

Figure 106: Global Vs South Korea Growth Comparison

Figure 107: South Korea Market Share Analysis (%) by Application, 2023 & 2033

Figure 108: South Korea Market Share Analysis (%) by End User, 2023 & 2033

Figure 109: South Asia Market Value (US$ Million) Analysis, 2017 to 2022

Figure 110: South Asia Market Value (US$ Million) Forecast, 2022 to 2032

Figure 111: South Asia Market Value Share, by Application (2023 E)

Figure 112: South Asia Market Value Share, by End User (2023 E)

Figure 113: South Asia Market Value Share, by Country (2023 E)

Figure 114: South Asia Market Attractiveness Analysis by Application, 2023 to 2033

Figure 115: South Asia Market Attractiveness Analysis by End User, 2023 to 2033

Figure 116: South Asia Market Attractiveness Analysis by Country, 2023 to 2033

Figure 117: India Market Value Proportion Analysis, 2022

Figure 118: Global Vs. India Growth Comparison

Figure 119: India Market Share Analysis (%) by Application, 2023 & 2033

Figure 120: India Market Share Analysis (%) by End User, 2023 & 2033

Figure 121: Indonesia Market Value Proportion Analysis, 2022

Figure 122: Global Vs. Indonesia Growth Comparison

Figure 123: Indonesia Market Share Analysis (%) by Application, 2023 & 2033

Figure 124: Indonesia Market Share Analysis (%) by End User, 2023 & 2033

Figure 125: Malaysia Market Value Proportion Analysis, 2022

Figure 126: Global Vs. Malaysia Growth Comparison

Figure 127: Malaysia Market Share Analysis (%) by Application, 2023 & 2033

Figure 128: Malaysia Market Share Analysis (%) by End User, 2023 & 2033

Figure 129: Thailand Market Value Proportion Analysis, 2022

Figure 130: Global Vs. Thailand Growth Comparison

Figure 131: Thailand Market Share Analysis (%) by Application, 2023 & 2033

Figure 132: Thailand Market Share Analysis (%) by End User, 2023 & 2033

Figure 133: Oceania Market Value (US$ Million) Analysis, 2017 to 2022

Figure 134: Oceania Market Value (US$ Million) Forecast, 2022 to 2032

Figure 135: Oceania Market Value Share, by Application (2023 E)

Figure 136: Oceania Market Value Share, by End User (2023 E)

Figure 137: Oceania Market Value Share, by Country (2023 E)

Figure 138: Oceania Market Attractiveness Analysis by Application, 2023 to 2033

Figure 139: Oceania Market Attractiveness Analysis by End User, 2023 to 2033

Figure 140: Oceania Market Attractiveness Analysis by Country, 2023 to 2033

Figure 141: Australia Market Value Proportion Analysis, 2022

Figure 142: Global Vs. Australia Growth Comparison

Figure 143: Australia Market Share Analysis (%) by Application, 2023 & 2033

Figure 144: Australia Market Share Analysis (%) by End User, 2023 & 2033

Figure 145: New Zealand Market Value Proportion Analysis, 2022

Figure 146: Global Vs New Zealand Growth Comparison

Figure 147: New Zealand Market Share Analysis (%) by Application, 2023 & 2033

Figure 148: New Zealand Market Share Analysis (%) by End User, 2023 & 2033

Figure 149: Middle East & Africa Market Value (US$ Million) Analysis, 2017 to 2022

Figure 150: Middle East & Africa Market Value (US$ Million) Forecast, 2022 to 2032

Figure 151: Middle East & Africa Market Value Share, by Application (2023 E)

Figure 152: Middle East & Africa Market Value Share, by End User (2023 E)

Figure 153: Middle East & Africa Market Value Share, by Country (2023 E)

Figure 154: Middle East & Africa Market Attractiveness Analysis by Application, 2023 to 2033

Figure 155: Middle East & Africa Market Attractiveness Analysis by End User, 2023 to 2033

Figure 156: Middle East & Africa Market Attractiveness Analysis by Country, 2023 to 2033

Figure 157: GCC Countries Market Value Proportion Analysis, 2022

Figure 158: Global Vs GCC Countries Growth Comparison

Figure 159: GCC Countries Market Share Analysis (%) by Application, 2023 & 2033

Figure 160: GCC Countries Market Share Analysis (%) by End User, 2023 & 2033

Figure 161: Türkiye Market Value Proportion Analysis, 2022

Figure 162: Global Vs. Türkiye Growth Comparison

Figure 163: Türkiye Market Share Analysis (%) by Application, 2023 & 2033

Figure 164: Türkiye Market Share Analysis (%) by End User, 2023 & 2033

Figure 165: South Africa Market Value Proportion Analysis, 2022

Figure 166: Global Vs. South Africa Growth Comparison

Figure 167: South Africa Market Share Analysis (%) by Application, 2023 & 2033

Figure 168: South Africa Market Share Analysis (%) by End User, 2023 & 2033

Figure 169: Northern Africa Market Value Proportion Analysis, 2022

Figure 170: Global Vs Northern Africa Growth Comparison

Figure 171: Northern Africa Market Share Analysis (%) by Application, 2023 & 2033

Figure 172: Northern Africa Market Share Analysis (%) by End User, 2023 & 2033

Explore Healthcare Insights

View Reports

Point-of-Care Fentanyl Test Kits Market