Reports

- Global Locations -

Headquarters

Future Market Insights, Inc.

Christiana Corporate, 200
Continental Drive, Suite 401,
Newark, Delaware - 19713,
United States

T: +1-845-579-5705

Americas

Future Market Insights, Inc.

616 Corporate Way, Suite 2-9018,
Valley Cottage, NY 10989, United States

T: +1-347-918-3531

MEA

Future Market Insights

1602-6 Jumeirah Bay X2 Tower, Plot No: JLT-PH2-X2A,
Jumeirah Lakes Towers, Dubai,
United Arab Emirates

Europe

Future Market Insights

3rd Floor, 207 Regent Street,
W1B 3HH London
United Kingdom

T: + 44 (0) 20 8123 9659
D: +44 (0) 20 3287 4268

Asia Pacific

Future Market Insights

IndiaLand Global Tech Park, Unit UG-1, Behind Grand HighStreet, Phase 1, Hinjawadi, MH, Pune – 411057, India

HDL Cholesterol Kits Market Outlook (2022 to 2029)

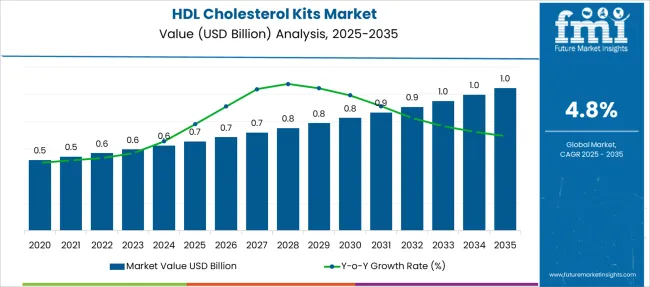
[187 Pages Report] Sales in the global HDL Cholesterol Kits Market are slated to top US$ 568.1 Million in 2022. Expanding at a healthy 4.8% CAGR, the market size is projected to total US$ 786.2 Million by 2029.

Attributes Details
HDL Cholesterol Kits Market Estimated Size 2022 US$ 568.1 Million
HDL Cholesterol Kits Market Value-based CAGR (2022 to 2029) 4.8%
HDL Cholesterol Kits Market Size in Projected 2029 US$ 786.2 Million

The increasing adoption of an unhealthy diet, rising cases of obesity, and lack of physical activities as life gets more hectic will result in a higher prevalence of cholesterol. Consequently, the demand for HDL cholesterol kits is expected to increase in the coming years.

The consumption of certain medications for the treatment of health problems such as high blood pressure, organ transplants, acne, HIV/AIDS, cancer, and irregular heart rhythms can also lead to the occurrence of HDL cholesterol.

Drinking too much alcohol, smoking cigarettes, and eating full-fat dairy products and fatty cuts of meat may raise an individual’s total cholesterol level. Thanks to awareness programs conducted by government bodies, the general public is better educated about the consequences of high cholesterol levels, such as the development of stroke, heart attack, or chest pain.

These factors are therefore expected to spur the sales of HDL cholesterol test kits.

Don't pay for what you don't need

Customize your report by selecting specific countries or regions and save 30%!

How The Market Progressed Till June 2022?

Particulars Details
H1, 2021 4.70%
H1, 2022 Projected 4.75%
H1, 2022 Outlook 4.65%
BPS Change - H1, 2022 (O) - H1, 2022 (P) (-) 10 ↓
BPS Change - H1, 2022 (O) - H1, 2021 (-) 05 ↓

The comparative analysis and market growth rate of the global HDL cholesterol kits market as studied by Future Market Insights will show a negative BPS growth in the H1-2022 outlook as compared to H1-2022 projected period by 10 BPS, and a decline in the BPS values is expected in H1-2022 over H1- 2021 duration with 05 Basis Point Share (BPS).

The drop in the BPS values is associated with the development of home test kits, however, the adoption of these products is limited because of the high costs associated with the product, and their inefficiency in providing an accurate diagnosis. Moreover, the home test kits are not easily comprehensible, and thus detain the future adoption of HDL cholesterol kits in the future.

Conversely, the advent of several regional government initiatives in the regions of Asia Pacific for comprehensive diagnosis and point-of-care for infectious and chronic diseases will subsequently present positive outcomes for market growth over the forecasted years.

The market is subject to regulatory impositions and product adoption rate, as per the macro and industry standards. The key developments in the market include product revamp strategies that incorporate an electronic meter within the test kits.

2014 to 2021 HDL Cholesterol Kits Market Outlook in Comparison to 2022 to 2029 Growth Forecast

The HDL cholesterol kits market is expected to register a 4.8% CAGR between 2022 and 2029, up from a 4.0% CAGR recorded from 2014 to 2021, predicts Future Market Insights.

The soaring need for the prompt determination of a person’s risk for stroke or heart disease is likely to propel the demand for HDL cholesterol level kits in the forthcoming years. This is mainly happening because of the surging geriatric population across the globe who are at a high risk of developing severe heart conditions.

As per the World Population Prospects 2019 published by the United Nations (UN), 1 in 6 people in the world will be over the age of 65 years by 2050, up from 1 in 11 in 2019. The organization further revealed that in 2019 there were approximately 703 million individuals belonging to the age group of 65 years and above in the world. In 2050, this number is estimated to double to 1.5 billion.

HDL Cholesterol Kits Market

Thus, the increasing geriatric population in various parts of the globe is set to bolster the sales of HDL cholesterol test kits in the forthcoming years.

Uncontrolled diabetes, untreated hypothyroidism, liver disease, high sugar intake, and low or high-fat percentage in the body are some of the other crucial factors that are anticipated to negatively affect a person’s level of cholesterol. These factors are projected to increase the need for timely cholesterol testing and help in propelling the sales of novel kits.

How is Diabetes Augmenting the Sales of HDL Cholesterol Level Test Kits?

The rising prevalence of diabetes is expected to propel the demand for HDL cholesterol level test kits in the forecast period. Diabetic dyslipidemia is often linked with elevated levels of LDL cholesterol and lower levels of HDL cholesterol. As changing cholesterol levels can cause heart disease even with well-controlled blood glucose levels, healthcare professionals recommend diabetic patients enhance their coronary health by lowering their cholesterol levels.

According to the International Diabetes Federation (IDF), around 537 million adults belonging to the age group of 20 to 79 years were living with diabetes in 2021. It is projected to reach 783 million by 2045 and 643 million by 2030. Also, 1 in 6 live births is impacted by diabetes during pregnancy. These trends are estimated to continue in the near future and augment the sales of HDL cholesterol detection kits.   

Many research and educational institutions are conducting extensive Research and Development activities to discover new approaches for treating diabetes and other associated conditions. Some of the others are trying to investigate the risk factors of diabetic dyslipidemia.

For instance, in October 2018, the National Institute for Nutrition and Health found that the prevalence of dyslipidemia was 59.3%, 46.8%, and 39.9% in individuals with Type 2 Diabetes Mellitus (T2DM), prediabetes, and normal glucose, respectively. Hence, the rising prevalence of this condition among people worldwide is expected to bolster the sales of innovative kits.
Sabyasachi Ghosh
Sabyasachi Ghosh

Principal Consultant

Talk to Analyst

Find your sweet spots for generating winning opportunities in this market.

Country-wise Insights

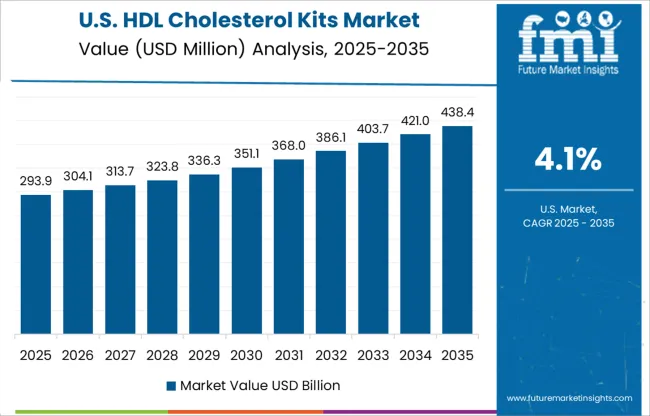
Why is the USA HDL Cholesterol Kits Market Showcasing Robust Growth?

“Increasing Obesity Cases to Drive Sales of HDL Cholesterol Test Kits”

The surging cases of obesity in the USA owing to the rapid adoption of sedentary lifestyles and the increasing consumption of junk food are anticipated to propel the demand for HDL cholesterol test kits in North America. The sales of home test kits are likely to rise as body weight has a direct association with cardiovascular risk factors, such as high and low cholesterol.

As per the Centers for Disease Control and Prevention (CDC), from 2017 to 2018, the prevalence of obesity was 42.4% in the USA The organization further mentioned that medical costs for people who were affected by obesity were $1,429 higher than medical costs for those with a healthy weight. Thus, the increasing risk of developing obesity-related conditions is projected to compel people to get their medical tests done from time to time, which would propel the sales of HDL cholesterol detection kits in the USA

Which Factors are Driving the UK HDL Cholesterol Kits Market?

“Prevalence of Hypothyroidism to Bolster Demand for HDL Cholesterol Level Test Kits”

The increasing prevalence of hypothyroidism among people in the UK is estimated to drive the demand for HDL cholesterol level test kits in Europe over the forthcoming years. Radiation therapy, certain medications containing lithium compounds, thyroid surgery, and the occurrence of autoimmune disorders are some of the major causes of hypothyroidism.

According to the National Institute for Health and Care Excellence (NICE), hypothyroidism is found in more than 5% of the UK population over the age of 60. Compared to men, women are 5 to 10 times more likely to be affected by this condition. These numbers are expected to surge in the upcoming years, thereby driving the market in the UK

Is the China HDL Cholesterol Kits Market Exhibiting Lucrative Growth?

“Surging Government Funding in Healthcare to Spur Sales of HDL Cholesterol Detection Kits”

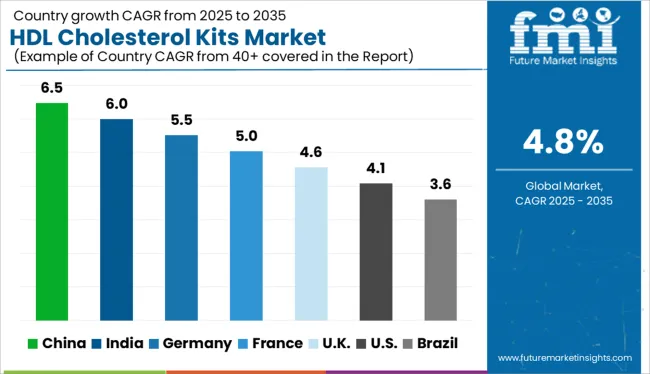
The rising demand for cholesterol testing in China because of the need to prevent chronic diseases is projected to push the sales of HDL cholesterol detection kits in East Asia. The growing awareness about the significance of regular healthcare testing among people is another factor that is set to surge sales in China.

The high healthcare expenditure and the ongoing development of the healthcare infrastructure in this country are anticipated to bode well for the market. In 2018, for instance, China spent about 6.6% of its GDP on healthcare, which amounts to US$ 1,665 billion. Out of this, 28% was paid out-of-pocket, 44% was financed by social health donations, private health insurance, or publicly funded health insurance, and 28% was financed by the local and central governments. Hence, increasing government support in terms of funding in this country is projected to accelerate the market. 

Category-wise Insights

Which is the Top-selling product in the HDL Cholesterol Kits Market?

“HDL and LDL/VLDL Cholesterol Level Kits to Be in High Demand among CVD Patients”

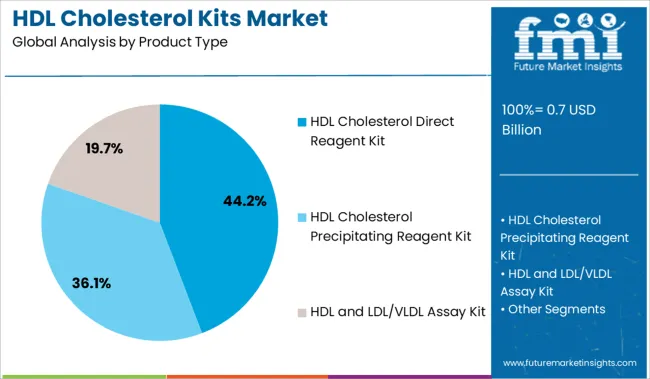
Based on product type, the HDL and LDL/VLDL assay kit segment is likely to dominate the HDL cholesterol kits market in the near future. The rising prevalence of lifestyle disorders, such as Cardiovascular Disease (CVD) globally owing to the higher adoption of a sedentary culture and the lack of time to prepare healthy meals is anticipated to fuel the sales of HDL and LDL/VLDL cholesterol level kits.

As per the World Health Organization (WHO), in 2019, around 17.9 million people died from CVDs, thereby exhibiting 32% of all global deaths. The organization also stated that CVD can be prevented by eliminating the harmful use of alcohol and tobacco, physical inactivity, and the adoption of an unhealthy diet. This trend is set to continue in the forecast period, thereby propelling the segment’s growth.

Who is the Leading End User of HDL Cholesterol Kits?

“Availability of Advanced HDL Cholesterol Test Kits in Hospitals to Continue Increasing”

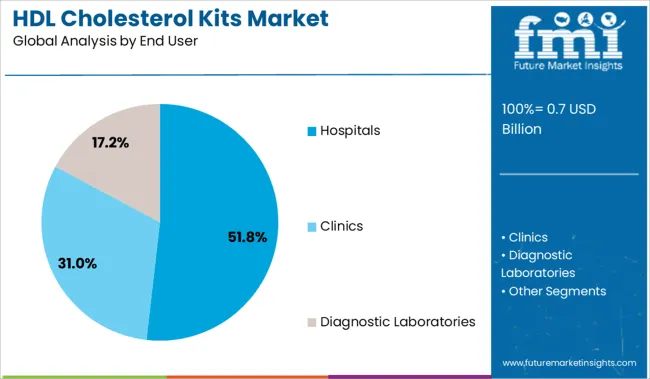
In terms of end users, the hospital's segment is projected to remain at the forefront by accounting for 50.1% of the HDL cholesterol kits market share in 2022, estimated by FMI. The ongoing development of cutting-edge hospitals equipped with technologically advanced medical testing products, such as HDL cholesterol test kits is anticipated to drive the segment.

On the other hand, the diagnostic labs and clinics segments are estimated to generate approximately 31.3% and 18.6% of the market share in 2022, respectively. The cost-effectiveness of laboratory testing and the ability of clinics to provide urgent medical attention to those who require it are likely to bolster both segments.
Get the data you need at a Fraction of the cost

Personalize your report by choosing insights you need
and save 40%!

Competition Landscape

Key players operating in the HDL cholesterol kits market are focusing on acquisitions and collaborations with international and regional companies to surge their sales and attract large consumer bases across the globe.

Meanwhile, some of the other HDL cholesterol level kit manufacturers are aiming to broaden their global presence by opening new manufacturing facilities and signing distribution agreements with firms located in developed, as well as emerging markets of Europe, the Middle East, and Asia Pacific. A few of the players are engaging in the development of point-of-care testing as it is convenient and helpful for making quick decisions.

For instance,

  • In January 2022, CallonDoc, a provider of affordable and reliable online medical care based in Texas, introduced its latest at-home testing kits with free doorstep delivery. These kits would help users to test themselves for several health conditions, such as cholesterol, liver, kidney, STDs, diabetes, and thyroid problems. Priced from $35-$50, each multi-specimen kit comes in a pre-paid box, thereby allowing users to send their specimens to the lab and get results within 3 to 5 days through a patient account.  
  • In January 2022, Eurofins, an international group of laboratories headquartered in Europe, unveiled the first direct-to-consumer at-home test called PFAS Exposure in the U.S. It can be used to detect the levels of Per- and Polyfluorinated Alkyl Substances (PFAS) in a person’s blood. It is also capable of measuring 47 of the PFAS “forever chemical” compounds. The presence of these chemicals may often lead to adverse health effects, including elevated cholesterol, thyroid disease, decreased fertility, and cancer. The kits are available online for $399 in the USA

Scope of Report

Attributes Details
Forecast Period 2014 to 2021
Historical Data Available for 2022 to 2029
Market Analysis Units for Volume and US$ Million for Value
Key Regions Covered North America, Latin America, Europe, East Asia, South Asia, Oceania, and the Middle East & Africa (MEA).
Key Countries Covered United States, Canada, Brazil, Mexico, Germany, UK, France, Italy, Spain, Nordic, Russia, Poland, China, India, Thailand, Indonesia, Australia and New Zealand, Japan, GCC countries, North Africa, South Africa, and others.
Key Market Segments Covered Product Type, End User, and Region
Key Companies Profiled
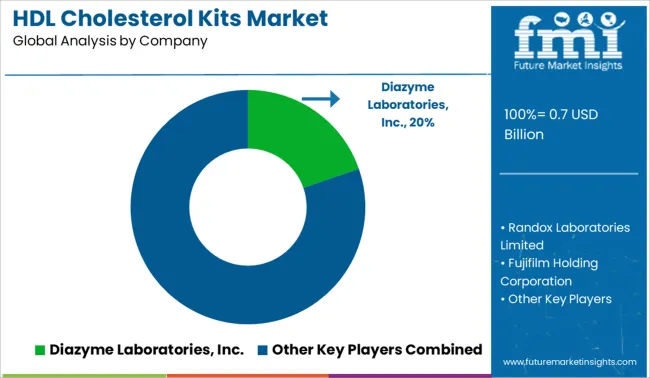
  • Diazyme Laboratories, Inc.
  • Randox Laboratories Limited
  • Fujifilm Holding Corporation
  • Thermo Fisher Scientific
  • Abcam plc.
  • Merck KGaA
  • Abbott Laboratories
  • Danaher Corporation
  • PerkinElmer, Inc.
  • Hoffmann-La Roche Ltd.
Pricing Available upon Request

HDL Cholesterol Kits Market by Category

Product Type:

  • HDL Cholesterol Precipitating Reagent Kit
  • HDL Cholesterol Direct Reagent Kit
  • HDL and LDL/VLDL Assay Kit

End User:

  • Hospitals
  • Clinics
  • Diagnostic Laboratories

Region:

  • North America
  • Latin America
  • Europe
  • Oceania
  • East Asia
  • South Asia
  • Middle East & Africa (MEA)

Frequently Asked Questions

What is the global HDL cholesterol kits market size?

The global HDL cholesterol kits market is expected to reach a valuation of US$ 568.1 Million in 2022.

At what rate did the global HDL cholesterol kits market grow between 2014 and 2021?

The global HDL cholesterol kits market grew at a healthy 4.0% CAGR between 2014 and 2021.

What are the key trends boosting sales of HDL cholesterol kits?

The increasing prevalence of diabetes and the rising alcohol consumption are the key trends boosting the sales of HDL cholesterol kits.

Who are the leading HDL cholesterol kits market players?

Diazyme Laboratories, Inc., Randox Laboratories Limited, Fujifilm Holding Corporation, Thermo Fisher Scientific, Abcam plc, Merck KGaA, and Abbott Laboratories are some of the leading players present in the global HDL cholesterol kits market.

What is the share of the hospitals segment in the HDL cholesterol kits market?

The hospital segment is anticipated to account for 50.1% of the HDL cholesterol kits market share in 2022.

What is the share of the clinics end user segment in the HDL cholesterol kits market?

The clinic's end-user segment is projected to account for 18.6% of the HDL cholesterol kits market share in the forecast period.

Table of Content

1. Executive Summary | HDL Cholesterol Kits Market

    1.1. Global Market Outlook

    1.2. Market Trends

    1.3. Analysis and Recommendations

2. Market Overview

    2.1. Market Coverage / Taxonomy

    2.2. Market Definition / Scope / Limitations

3. Key Market Trends

    3.1. Key Trends Impacting the Market

    3.2. Product Innovation / Development Trends

4. Global Market (Size in US$ Million) Analysis 2014 to 2021 and Forecast, 2022 to 2029

    4.1. Historical Market Value (US$ Million) Analysis, 2014 to 2021

    4.2. Current and Future Market Value (US$ Million) Projections, 2022 to 2029

        4.2.1. Y-o-Y Growth Trend Analysis

        4.2.2. Absolute $ Opportunity Analysis

5. Market Background

    5.1. Macro-Economic Factors

        5.1.1. Global GDP Growth Outlook

        5.1.2. Global Industry Value Added

        5.1.3. Healthcare Expenditure and Sector Outlook

    5.2. Forecast Factors - Relevance & Impact

    5.3. Market Dynamics

        5.3.1. Drivers

        5.3.2. Restraints

        5.3.3. Opportunity

6. Global Market Analysis 2014 to 2021 and Forecast 2022 to 2029, By Product Type

    6.1. Introduction / Key Findings

    6.2. Historical Market Size (US$ Million) Analysis By Product Type, 2014 to 2021

    6.3. Current and Future Market Size (US$ Million) Analysis and Forecast By Product Type, 2022 to 2029

        6.3.1. HDL Cholesterol Precipitating Reagent Kit

        6.3.2. HDL Cholesterol Direct Reagent Kit

        6.3.3. HDL and LDL/VLDL Assay Kit

    6.4. Market Attractiveness Analysis By Product Type 

7. Global Market Analysis 2014 to 2021 and Forecast 2022 to 2029, By End User

    7.1. Introduction / Key Findings

    7.2. Historical Market Size (US$ Million) Analysis By End User, 2014 to 2021

    7.3. Current and Future Market Size (US$ Million) Analysis and Forecast By End User, 2022 to 2029

        7.3.1. Hospitals

        7.3.2. Clinics

        7.3.3. Diagnostic Laboratories

    7.4. Market Attractiveness Analysis By End User

8. Global Market Analysis 2014 to 2021 and Forecast 2022 to 2029, By Region

    8.1. Introduction

    8.2. Historical Market Size (US$ Million) Analysis By Region, 2014 to 2021

    8.3. Current Market Size (US$ Million) Analysis and Forecast By Region, 2022 to 2029

        8.3.1. North America

        8.3.2. Latin America

        8.3.3. Europe

        8.3.4. East Asia

        8.3.5. South Asia

        8.3.6. Oceania

        8.3.7. Middle East & Africa (MEA)

    8.4. Market Attractiveness Analysis By Region

9. North America Market Analysis 2014 to 2021 and Forecast 2022 to 2029

    9.1. Introduction

    9.2. Historical Market Size (US$ Million) Trend Analysis By Market Taxonomy, 2014 to 2021

    9.3. Market Size (US$ Million) Forecast By Market Taxonomy, 2022 to 2029

        9.3.1. By Country

            9.3.1.1. The USA

            9.3.1.2. Canada

        9.3.2. By Product Type

        9.3.3. By End User

    9.4. Market Attractiveness Analysis

        9.4.1. By Country

        9.4.2. By Product Type

        9.4.3. By End User

10. Latin America Market Analysis 2014 to 2021 and Forecast 2022 to 2029

    10.1. Introduction

    10.2. Historical Market Size (US$ Million) Trend Analysis By Market Taxonomy, 2014 to 2021

    10.3. Market Size (US$ Million) Forecast By Market Taxonomy, 2022 to 2029

        10.3.1. By Country

            10.3.1.1. Brazil

            10.3.1.2. Argentina

            10.3.1.3. Mexico

            10.3.1.4. Rest of Latin America

        10.3.2. By Product Type

        10.3.3. By End User

    10.4. Market Attractiveness Analysis

        10.4.1. By Country

        10.4.2. By Product Type

        10.4.3. By End User

11. Europe Market Analysis 2014 to 2021 and Forecast 2022 to 2029

    11.1. Introduction

    11.2. Historical Market Size (US$ Million) Trend Analysis By Market Taxonomy, 2014 to 2021

    11.3. Market Size (US$ Million) Forecast By Market Taxonomy, 2022 to 2029

        11.3.1. By Country

            11.3.1.1. Germany

            11.3.1.2. Italy

            11.3.1.3. France

            11.3.1.4. The UK

            11.3.1.5. Spain

            11.3.1.6. Rest of Europe

        11.3.2. By Product Type

        11.3.3. By End User

    11.4. Market Attractiveness Analysis

        11.4.1. By Country

        11.4.2. By Product Type

        11.4.3. By End User

12. East Asia Market Analysis 2014 to 2021 and Forecast 2022 to 2029

    12.1. Introduction

    12.2. Historical Market Size (US$ Million) Trend Analysis By Market Taxonomy, 2014 to 2021

    12.3. Market Size (US$ Million) Forecast By Market Taxonomy, 2022 to 2029

        12.3.1. By Country

            12.3.1.1. China

            12.3.1.2. Japan

            12.3.1.3. South Korea

        12.3.2. By Product Type

        12.3.3. By End User

    12.4. Market Attractiveness Analysis

        12.4.1. By Country

        12.4.2. By Product Type

        12.4.3. By End User

13. South Asia Market Analysis 2014 to 2021 and Forecast 2022 to 2029

    13.1. Introduction

    13.2. Historical Market Size (US$ Million) Trend Analysis By Market Taxonomy, 2014 to 2021

    13.3. Market Size (US$ Million) Forecast By Market Taxonomy, 2022 to 2029

        13.3.1.  By Country

            13.3.1.1. India

            13.3.1.2. Thailand

            13.3.1.3. Indonesia

            13.3.1.4. Malaysia

            13.3.1.5. Singapore

            13.3.1.6. Rest of South Asia

        13.3.2. By Product Type

        13.3.3. By End User

    13.4. Market Attractiveness Analysis

        13.4.1. By Country

        13.4.2. By Product Type

        13.4.3. By End User

14. Oceania Market Analysis 2014 to 2021 and Forecast 2022 to 2029

    14.1. Introduction

    14.2. Historical Market Size (US$ Million) Trend Analysis By Market Taxonomy, 2014 to 2021

    14.3. Market Size (US$ Million) Forecast By Market Taxonomy, 2022 to 2029

        14.3.1.  By Country

            14.3.1.1. Australia

            14.3.1.2. New Zealand

        14.3.2. By Product Type

        14.3.3. By End User

    14.4. Market Attractiveness Analysis

        14.4.1. By Country

        14.4.2. By Product Type

        14.4.3. By End User

15. Middle East and Africa Market Analysis 2014 to 2021 and Forecast 2022 to 2029

    15.1. Introduction

    15.2. Historical Market Size (US$ Million) Trend Analysis By Market Taxonomy, 2014 to 2021

    15.3. Market Size (US$ Million) Forecast By Market Taxonomy, 2022 to 2029

        15.3.1.  By Country

            15.3.1.1. South Africa

            15.3.1.2. GCC Countries

            15.3.1.3. Turkey

            15.3.1.4. Rest of Middle East and Africa

        15.3.2. By Product Type

        15.3.3. By End User

    15.4. Market Attractiveness Analysis

        15.4.1. By Country

        15.4.2. By Product Type

        15.4.3. By End User

16. Market Structure Analysis

    16.1. Market Analysis by Tier of Companies

    16.2. Market Share Analysis of Top Players

17. Competition Analysis

    17.1. Competition Dashboard

    17.2. Competition Deep Dive

        17.2.1. Diazyme Laboratories, Inc.

            17.2.1.1. Overview

            17.2.1.2. Portfolio

            17.2.1.3. Profitability by Market Segments (Solution/Region)

            17.2.1.4. Regional Footprint

            17.2.1.5. Strategy Overview

                17.2.1.5.1. Marketing Strategy

                17.2.1.5.2. Product Strategy

        17.2.2. Randox Laboratories Limited

            17.2.2.1. Overview

            17.2.2.2. Portfolio

            17.2.2.3. Profitability by Market Segments (Solution/Region)

            17.2.2.4. Regional Footprint

            17.2.2.5. Strategy Overview

                17.2.2.5.1. Marketing Strategy

                17.2.2.5.2. Product Strategy

        17.2.3. Fujifilm Holding Corporation

            17.2.3.1. Overview

            17.2.3.2. Portfolio

            17.2.3.3. Profitability by Market Segments (Solution/Region)

            17.2.3.4. Regional Footprint

            17.2.3.5. Strategy Overview

                17.2.3.5.1. Marketing Strategy

                17.2.3.5.2. Product Strategy

        17.2.4. Thermo Fisher Scientific

            17.2.4.1. Overview

            17.2.4.2. Portfolio

            17.2.4.3. Profitability by Market Segments (Solution/Region)

            17.2.4.4. Regional Footprint

            17.2.4.5. Strategy Overview

                17.2.4.5.1. Marketing Strategy

                17.2.4.5.2. Product Strategy

        17.2.5. Abcam plc.

            17.2.5.1. Overview

            17.2.5.2. Portfolio

            17.2.5.3. Profitability by Market Segments (Solution/Region)

            17.2.5.4. Regional Footprint

            17.2.5.5. Strategy Overview

                17.2.5.5.1. Marketing Strategy

                17.2.5.5.2. Product Strategy

        17.2.6. Merck KGaA

            17.2.6.1. Overview

            17.2.6.2. Portfolio

            17.2.6.3. Profitability by Market Segments (Solution/Region)

            17.2.6.4. Regional Footprint

            17.2.6.5. Strategy Overview

                17.2.6.5.1. Marketing Strategy

                17.2.6.5.2. Product Strategy

        17.2.7. Abbott Laboratories

            17.2.7.1. Overview

            17.2.7.2. Portfolio

            17.2.7.3. Profitability by Market Segments (Solution/Region)

            17.2.7.4. Regional Footprint

            17.2.7.5. Strategy Overview

                17.2.7.5.1. Marketing Strategy

                17.2.7.5.2. Product Strategy

        17.2.8. Danaher Corporation

            17.2.8.1. Overview

            17.2.8.2. Portfolio

            17.2.8.3. Profitability by Market Segments (Solution/Region)

            17.2.8.4. Regional Footprint

            17.2.8.5. Strategy Overview

                17.2.8.5.1. Marketing Strategy

                17.2.8.5.2. Product Strategy

        17.2.9. PerkinElmer, Inc.

            17.2.9.1. Overview

            17.2.9.2. Portfolio

            17.2.9.3. Profitability by Market Segments (Solution/Region)

            17.2.9.4. Regional Footprint

            17.2.9.5. Strategy Overview

                17.2.9.5.1. Marketing Strategy

                17.2.9.5.2. Product Strategy

        17.2.10. Hoffmann-La Roche Ltd.

            17.2.10.1. Overview

            17.2.10.2. Portfolio

            17.2.10.3. Profitability by Market Segments (Solution/Region)

            17.2.10.4. Regional Footprint

            17.2.10.5. Strategy Overview

                17.2.10.5.1. Marketing Strategy

                17.2.10.5.2. Product Strategy

18. Assumptions and Acronyms Used

19. Research Methodology

Don't pay for what you don't need

Customize your report by selecting specific countries or regions and save 30%!

List of Tables

Table 01: Expenditure on Health, (% of GDP), by Country, 2016 to 2020 (1/2)

Table 02: Expenditure on Health, (% of GDP), by Country, 2016 to 2020 (2/2)

Table 03: Global Market Value (US$ Million) Analysis 2014 to 2021 and Forecast 2022 to 2029, By Product Type

Table 04: Global Market Value (US$ Million) Analysis 2014 to 2021 and Forecast 2022 to 2029, By End User

Table 05: Global Market Value (US$ Million) Analysis 2014 to 2021 and Forecast 2022 to 2029, By Region

Table 06: North America Market Value (US$ Million) Analysis 2014 to 2021 and Forecast 2022 to 2029, By Country

Table 07: North America Market Value (US$ Million) Analysis 2014 to 2021 and Forecast 2022 to 2029, By Product Type

Table 08: North America Market Value (US$ Million) Analysis 2014 to 2021 and Forecast 2022 to 2029, By End User

Table 09: Latin America Market Value (US$ Million) Analysis 2014 to 2021 and Forecast 2022 to 2029, By Country

Table 10: Latin America Market Value (US$ Million) Analysis 2014 to 2021 and Forecast 2022 to 2029, By Product Type

Table 11: Latin America Market Value (US$ Million) Analysis 2014 to 2021 and Forecast 2022 to 2029, By End User

Table 12: Europe Market Value (US$ Million) Analysis 2014 to 2021 and Forecast 2022 to 2029, By Country

Table 13: Europe Market Value (US$ Million) Analysis 2014 to 2021 and Forecast 2022 to 2029, By Product Type

Table 14: Europe Market Value (US$ Million) Analysis 2014 to 2021 and Forecast 2022 to 2029, By End User

Table 15: South Asia Market Value (US$ Million) Analysis 2014 to 2021 and Forecast 2022 to 2029, By Country

Table 16: South Asia Market Value (US$ Million) Analysis 2014 to 2021 and Forecast 2022 to 2029, By Product Type

Table 17: South Asia Market Value (US$ Million) Analysis 2014 to 2021 and Forecast 2022 to 2029, By End User

Table 18: East Asia Market Value (US$ Million) Analysis 2014 to 2021 and Forecast 2022 to 2029, By Country

Table 19: East Asia Market Value (US$ Million) Analysis 2014 to 2021 and Forecast 2022 to 2029, By Product Type

Table 20: East Asia Market Value (US$ Million) Analysis 2014 to 2021 and Forecast 2022 to 2029, By End User

Table 21: Oceania Market Value (US$ Million) Analysis 2014 to 2021 and Forecast 2022 to 2029, By Country

Table 22: Oceania Market Value (US$ Million) Analysis 2014 to 2021 and Forecast 2022 to 2029, By Product Type

Table 23: Oceania Market Value (US$ Million) Analysis 2014 to 2021 and Forecast 2022 to 2029, By End User

Table 24: MEA Market Value (US$ Million) Analysis 2014 to 2021 and Forecast 2022 to 2029, By Country

Table 25: MEA Market Value (US$ Million) Analysis 2014 to 2021 and Forecast 2022 to 2029, By Product Type

Table 26: MEA Market Value (US$ Million) Analysis 2014 to 2021 and Forecast 2022 to 2029, By End User

Table 27: China Market Value (US$ Million) Analysis 2014 to 2021 and Forecast 2022 to 2029, By Product Type

Table 28: China Market Value (US$ Million) Analysis 2014 to 2021 and Forecast 2022 to 2029, By End User

Table 29: Brazil Market Value (US$ Million) Analysis 2014 to 2021 and Forecast 2022 to 2029, By Product Type

Table 30: Brazil Market Value (US$ Million) Analysis 2014 to 2021 and Forecast 2022 to 2029, By End User

Table 31: India Market Value (US$ Million) Analysis 2014 to 2021 and Forecast 2022 to 2029, By Product Type

Table 32: India Market Value (US$ Million) Analysis 2014 to 2021 and Forecast 2022 to 2029, By End User
Sabyasachi Ghosh
Sabyasachi Ghosh

Principal Consultant

Talk to Analyst

Find your sweet spots for generating winning opportunities in this market.

List of Charts

Figure 01: Global Market Value Analysis (US$ Million), 2014 to 2021

Figure 02: Global Market Value Forecast (US$ Million), 2022 to 2029

Figure 03: Global Market Absolute $ Opportunity, 2022 to 2029

Figure 04: Global Market Share Analysis (%), By Product Type, 2022 to 2029

Figure 05: Global Market Y-o-Y Analysis (%), By Product Type, 2021 to 2029

Figure 06: Global Market Attractiveness Analysis by Product Type, 2022 to 2029

Figure 07: Global Market Share Analysis (%), By End User, 2022 to 2029

Figure 08: Global Market Y-o-Y Analysis (%), By End User, 2021 to 2029

Figure 09: Global Market Attractiveness Analysis by End User, 2022 to 2029

Figure 10: Global Market Share Analysis (%), By Region, 2022 to 2029

Figure 11: Global Market Y-o-Y Analysis (%), By Region, 2021 to 2029

Figure 12: Global Market Attractiveness Analysis by Region, 2022 to 2029

Figure 13: North America Market Share Analysis (%), By Product Type, 2022 to 2029

Figure 14: North America Market Share Analysis (%), By End User, 2022 to 2029

Figure 15: North America Market Share Analysis (%), By Country, 2022E

Figure 16: North America Market Value Analysis (US$ Million), 2014 to 2021

Figure 17: North America Market Value Forecast (US$ Million), 2022 to 2029

Figure 18: North America Market Attractiveness Analysis by Product Type, 2022 to 2029

Figure 19: North America Market Attractiveness Analysis by End User, 2022 to 2029

Figure 20: North America Market Attractiveness Analysis by Country, 2022 to 2029

Figure 21: Latin America Market Share Analysis (%), By Product Type, 2022 to 2029

Figure 22: Latin America Market Share Analysis (%), By End User, 2022 to 2029

Figure 23: Latin America Market Share Analysis (%), By Country, 2022E

Figure 24: Latin America Market Value Analysis (US$ Million), 2014 to 2021

Figure 25: Latin America Market Value Forecast (US$ Million), 2022 to 2029

Figure 26: Latin America Market Attractiveness Analysis by Product Type, 2022 to 2029

Figure 27: Latin America Market Attractiveness Analysis by End User, 2022 to 2029

Figure 28: Latin America Market Attractiveness Analysis by Country, 2022 to 2029

Figure 29: Europe Market Share Analysis (%), By Product Type, 2022 to 2029

Figure 30: Europe Market Share Analysis (%), By End User, 2022 to 2029

Figure 31: Europe Market Share Analysis (%), By Country, 2022E

Figure 32: Europe Market Value Analysis (US$ Million), 2014 to 2021

Figure 33: Europe Market Value Forecast (US$ Million), 2022 to 2029

Figure 34: Europe Market Attractiveness Analysis by Product Type, 2022 to 2029

Figure 35: Europe Market Attractiveness Analysis by End User, 2022 to 2029

Figure 36: Europe Market Attractiveness Analysis by Country, 2022 to 2029

Figure 37: South Asia Market Share Analysis (%), By Product Type, 2022 to 2029

Figure 38: South Asia Market Share Analysis (%), By End User, 2022 to 2029

Figure 39: South Asia Market Share Analysis (%), By Country, 2022E

Figure 40: South Asia Market Value Analysis (US$ Million), 2014 to 2021

Figure 41: South Asia Market Value Forecast (US$ Million), 2022 to 2029

Figure 42: South Asia Market Attractiveness Analysis by Product Type, 2022 to 2029

Figure 43: South Asia Market Attractiveness Analysis by End User, 2022 to 2029

Figure 44: South Asia Market Attractiveness Analysis by Country, 2022 to 2029

Figure 45: East Asia Market Share Analysis (%), By Product Type, 2022 to 2029

Figure 46: East Asia Market Share Analysis (%), By End User, 2022 to 2029

Figure 47: East Asia Market Share Analysis (%), By Country, 2022E

Figure 48: East Asia Market Value Analysis (US$ Million), 2014 to 2021

Figure 49: East Asia Market Value Forecast (US$ Million), 2022 to 2029

Figure 50: East Asia Market Attractiveness Analysis by Product Type, 2022 to 2029

Figure 51: East Asia Market Attractiveness Analysis by End User, 2022 to 2029

Figure 52: East Asia Market Attractiveness Analysis by Country, 2022 to 2029

Figure 53: Oceania Market Share Analysis (%), By Product Type, 2022 to 2029

Figure 54: Oceania Market Share Analysis (%), By End User, 2022 to 2029

Figure 55: Oceania Market Share Analysis (%), By Country, 2022E

Figure 56: Oceania Market Value Analysis (US$ Million), 2014 to 2021

Figure 57: Oceania Market Value Forecast (US$ Million), 2022 to 2029

Figure 58: Oceania Market Attractiveness Analysis by Product Type, 2022 to 2029

Figure 59: Oceania Market Attractiveness Analysis by End User, 2022 to 2029

Figure 60: Oceania Market Attractiveness Analysis by Country, 2022 to 2029

Figure 61: MEA Market Share Analysis (%), By Product Type, 2022 to 2029

Figure 62: MEA Market Share Analysis (%), By End User, 2022 to 2029

Figure 63: MEA Market Share Analysis (%), By Country, 2022E

Figure 64: MEA Market Value Analysis (US$ Million), 2014 to 2021

Figure 65: MEA Market Value Forecast (US$ Million), 2022 to 2029

Figure 66: MEA Market Attractiveness Analysis by Product Type, 2022 to 2029

Figure 67: MEA Market Attractiveness Analysis by End User, 2022 to 2029

Figure 68: MEA Market Attractiveness Analysis by Country, 2022 to 2029

Figure 69: Global Market Value Proportion Analysis, By Emerging Countries, 2021

Figure 70: Market, Global Vs. Country Growth Y-o-Y (%) Comparison, 2021 to 2029

Figure 71: China Market Value Analysis (US$ Million), 2014 to 2021

Figure 72: China Market Value Forecast (US$ Million), 2022 to 2029

Figure 73: China Market Attractiveness Analysis by Product Type, 2022 to 2029

Figure 74: China Market Attractiveness Analysis by End User, 2022 to 2029

Figure 75: Brazil Market Value Analysis (US$ Million), 2014 to 2021

Figure 76: Brazil Market Value Forecast (US$ Million), 2022 to 2029

Figure 77: Brazil Market Attractiveness Analysis by Product Type, 2022 to 2029

Figure 78: Brazil Market Attractiveness Analysis by End User, 2022 to 2029

Figure 79: India Market Value Analysis (US$ Million), 2014 to 2021

Figure 80: India Market Value Forecast (US$ Million), 2022 to 2029

Figure 81: India Market Attractiveness Analysis by Product Type, 2022 to 2029

Figure 82: India Market Attractiveness Analysis by End User, 2022 to 2029

Recommendations

Healthcare

Prescription Delivery Service Market

Published : March 2024

Healthcare

Pharmaceutical Lipids Market

Published : May 2023

Healthcare

HDL Cholesterol Kits Market

Published : July 2022

Healthcare

Point-of-care Cholesterol Monitoring Device Market

Published : June 2022

Explore Healthcare Insights

View Reports

HDL Cholesterol Kits Market