The Cholesterol and Lipid Test Market is estimated to be valued at USD 3.1 billion in 2025 and is projected to reach USD 6.3 billion by 2035, registering a compound annual growth rate (CAGR) of 7.3% over the forecast period.
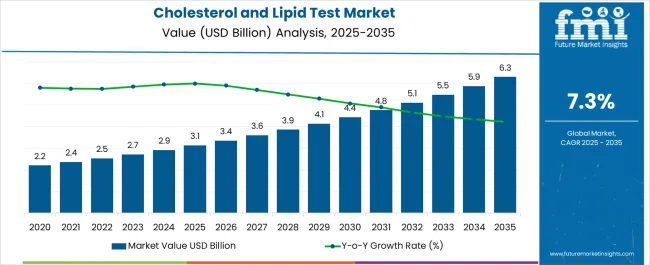
| Metric | Value |
|---|---|
| Cholesterol and Lipid Test Market Estimated Value in (2025 E) | USD 3.1 billion |
| Cholesterol and Lipid Test Market Forecast Value in (2035 F) | USD 6.3 billion |
| Forecast CAGR (2025 to 2035) | 7.3% |
The cholesterol and lipid test market is expanding steadily as cardiovascular disease prevalence continues to rise globally. The current scenario reflects growing awareness regarding preventive healthcare, an increase in routine health screenings, and wider availability of point-of-care testing solutions. Adoption is further supported by government-led screening programs and insurer-backed wellness initiatives that encourage regular lipid profiling.
Technological advancements have improved test accuracy, turnaround time, and accessibility, strengthening patient and physician confidence. The future outlook is defined by the integration of digital health platforms, self-monitoring kits, and advanced assay systems that provide greater convenience and real-time results.
Growth rationale is underpinned by the critical role of lipid profiling in early diagnosis and disease management, the cost-effectiveness of preventive monitoring compared to treatment of advanced cardiovascular complications, and the expanding reach of diagnostics into homecare and retail pharmacy settings Collectively, these drivers are ensuring sustained demand and positioning the market for long-term growth.
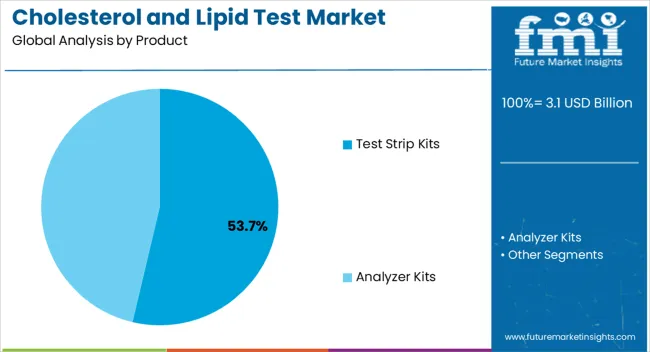
The test strip kits segment, accounting for 53.70% of the product category, has emerged as the dominant product due to its affordability, portability, and ease of use for both clinical and home-based testing. Widespread adoption has been supported by rising consumer preference for self-monitoring solutions that enable proactive health management.
The segment has benefited from strong distribution through pharmacies and retail outlets, ensuring accessibility in both developed and emerging regions. Improvements in strip sensitivity and compatibility with digital readers have reinforced diagnostic accuracy, further strengthening patient trust.
The shift toward point-of-care diagnostics has accelerated growth of this category, and ongoing product innovations are expected to sustain its leadership in the cholesterol and lipid test market.
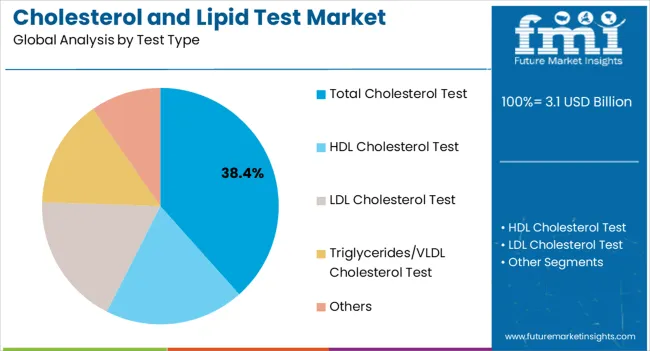
The total cholesterol test segment, holding 38.40% of the test type category, has been leading due to its fundamental role in assessing cardiovascular risk and supporting early intervention strategies. The test’s established use in clinical practice guidelines has ensured consistent demand across hospitals, diagnostic centers, and preventive health programs.
Widespread availability and cost-effectiveness have supported adoption, while technological enhancements in assay platforms have improved speed and accuracy of results. Growth has been further reinforced by routine incorporation of cholesterol testing into annual health check-ups, particularly in regions with rising incidence of lifestyle-related conditions.
Over the forecast period, continued emphasis on preventive healthcare and integration into digital health monitoring systems is expected to sustain the segment’s share.
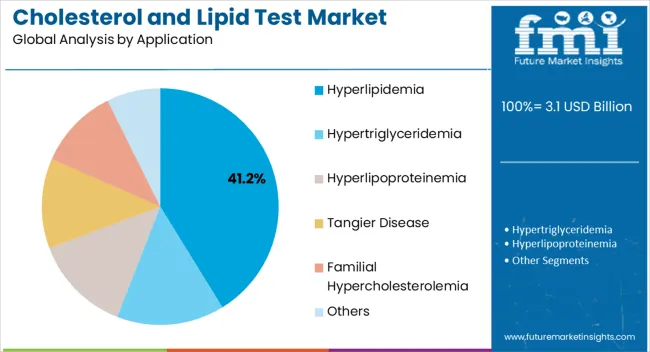
The hyperlipidemia application segment, representing 41.20% of the application category, has retained its leading position due to the growing prevalence of lipid disorders and the strong clinical necessity for regular monitoring. Rising cases linked to obesity, sedentary lifestyles, and dietary patterns have reinforced testing demand in both developed and emerging markets.
Diagnostic adoption has been supported by healthcare systems prioritizing early detection and management to reduce cardiovascular risk. Availability of user-friendly and cost-efficient testing solutions has enhanced patient compliance with regular lipid monitoring.
Continued expansion of healthcare infrastructure, coupled with government-backed awareness campaigns, is expected to drive further uptake As personalized treatment regimens become more common, demand for accurate and frequent testing for hyperlipidemia management will sustain the segment’s dominant market position.
The cholesterol and lipid test market expanded historically at a CAGR of 7.6% between 2020 and 2025. It attained a value of around USD 3.1 billion at the end of 2025.
In 2025, the cholesterol and lipid test market accounted for around 9.6% of the global rapid test market, valued at USD 28.5 billion. Over the forecast period, the global market for cholesterol and lipid tests is anticipated to expand at a CAGR of 7.6%.
| Historical CAGR (2020 to 2025) | 7.6% |
|---|---|
| Forecast CAGR (2025 to 2035) | 7.6% |
Cholesterol and lipid testing have been critical to cardiovascular disease management for several decades. The development of cholesterol testing began in the mid-20th century with the introduction of tests for total cholesterol levels.
The market for cholesterol and lipids tests is anticipated to expand as a result of the rising demand for over-the-counter cholesterol and lipids test kits and expanding electronic miniaturization. Subsequently, the rising popularity of preventive healthcare, the development of self-testing kits, and raising awareness about the importance of cholesterol level assessment will boost the market.
The aging population and the widespread adoption of the Western lifestyle in developing nations result in higher levels of atherogenic dyslipidemia and cholesterol. This is expected to fuel sales of cholesterol and lipid test products.
Cardiovascular diseases, including heart disease and strokes, remain a leading cause of mortality worldwide. The rising prevalence of these conditions and the growing awareness of the importance of cholesterol and lipid management are expected to drive the demand for cholesterol and lipids tests.
There is also a shift toward proactive healthcare and preventive measures to mitigate the risk of cardiovascular diseases. Cholesterol and lipid tests are crucial for identifying individuals at risk and guiding preventive strategies. The emphasis on preventive care is expected to fuel cholesterol and lipid test industry demand.
Demand for early diagnosis and treatment is anticipated to increase rapidly. This is due to the increasing prevalence of cardiovascular illnesses and their risk factors, including diabetes and hypertension.
Regular cholesterol and lipids testing is necessary for patients with a history of heart attacks to assess how well their therapy is working. As a result, the cholesterol and lipid test market is anticipated to expand steadily throughout the forecast period due to the increasing incidence of cardiac illnesses.
There is a growing emphasis on preventive healthcare to address the burden of cardiovascular diseases. Cholesterol and lipids tests are essential for early detection, risk assessment, and monitoring of lipid profiles. The increasing adoption of preventive healthcare strategies opens up opportunities for the market.
Long-term difficulties with cost, misinterpretation of the electronic result, and fasting before cholesterol testing could significantly limit the use of cholesterol and lipid tests during the forecast period. Similarly, the lack of LDL and HDL testing characteristics will restrain market growth.
Understanding the results of a handful of at-home cholesterol test kits can be challenging since they are tough to use. End-users might not get an accurate result if the tool is not used properly. It could be more expensive to get electronic testing kits or cholesterol test kits that check triglycerides, LDL, and HDL levels.
Certain cholesterol and lipid tests require end-users to send a blood sample to the laboratory for analysis. This can cost money and put users through weeks of waiting for results.
The table below shows the anticipated growth rates of the top countries. India, Germany, and the United Kingdom are expected to record lucrative CAGRs of 8.4%, 7.6%, and 7.8%, respectively, through 2035.
| Countries | CAGR (2025 to 2035) |
|---|---|
| United States | 6.4% |
| China | 6.8% |
| United Kingdom | 7.8% |
| Japan | 6.5% |
| Germany | 7.6% |
| India | 8.4% |
The United States held a significant revenue share of about 90.6% of the North America cholesterol and lipid test market in 2025. The total cholesterol and lipid test market value in the United States reached USD 3.1 million at the end of 2025.
As per the latest report, demand for cholesterol and lipid tests in the United States is projected to rise at a 6.4% CAGR through 2035. This is attributable to the rising rates of obesity and heart disease in the United States and the increasing need for preventive healthcare.
There has been a sharp rise in the cases of obesity and other cardiovascular diseases in the United States during the last several years. For instance, as per the 2020 to 2020 National Health and Nutrition Examination Survey (NHANES), around 42% of the United States-based adults aged 20 and over had obesity.
Obesity and other cardiovascular diseases are often linked to high cholesterol levels. As a result, demand for cholesterol and lipid tests is expected to rise rapidly in the country. This is because these tests can help in the early detection and monitoring of CVD risk by providing accurate cholesterol level assessment.
The United States government and several organizations are increasing their efforts to raise public awareness about cardiovascular diseases, including their diagnosis and treatments. This will likely improve the United States cholesterol and lipid test market share through 2035.
Germany’s cholesterol and lipid test market value totaled USD 157.10 million in 2025. Over the forecast period, demand for cholesterol and lipid test products in Germany is predicted to rise at a 7.6% CAGR.
Multiple factors are expected to drive cholesterol and lipid test demand in Germany. These include increasing cases of cardiovascular diseases, rising need for lipoprotein measurement to detect the risk of cardiovascular diseases, and rising support from the government and other organizations.
The National Nutrition Society is a key player in Germany's effort to create clinical standards for treating cardiovascular disease. It has created new health promotion initiatives, especially in light of the nation’s growth in diabetes and obesity.
The new promotional strategies and policies will likely boost the adoption rate of cholesterol and lipid testing devices in the country. This will foster the growth of the cholesterol and lipid test market in Germany.
China dominated the East Asia cholesterol and lipid test market in 2025 with a share of about 45.3%. Total cholesterol and lipid test revenue in China reached USD 194.01 million at the end of 2025.
Over the forecast period, China’s cholesterol and lipid test industry size is projected to expand at a 6.8% CAGR. This is attributable to rising obesity rates across the country, advancements in cholesterol testing technologies, and the portability of electronics and their usefulness in the creation of self-testing kits.
Thanks to advancements in testing technologies, China-based companies are developing more convenient and accurate cholesterol and lipid testing methods. These include home testing kits, pint-of-care testing devices, and other advanced laboratory-based tests. This is expected to improve China's cholesterol and lipid test market share.
The United Kingdom’s cholesterol and lipid test market size reached USD 137.09 million in 2025. For the projection period, a CAGR of 7.8% has been predicted for the United Kingdom’s cholesterol and lipid test industry.
Several factors are expected to boost the growth of the cholesterol and lipid test market in the United Kingdom. These include rising incidence of cholesterol and lipid disorder and rising awareness about the benefits of cholesterol & lipid management.
People across the United Kingdom are becoming aware of the importance of cholesterol and lipid management for preventing cardiovascular disorders. As a result, they are opting for different cholesterol and lipid tests, thereby fostering market growth.
India is emerging as a highly lucrative market for cholesterol and lipid testing products across South Asia. This is due to the rising incidence of cardiovascular disease, increasing government initiatives, and expanding healthcare infrastructure.
The cholesterol and lipid test market value in India totaled USD 79.74 million in 2025. Over the forecast period, demand for cholesterol and lipid tests in India is anticipated to rise at an 8.4% CAGR.
Growing demand for liquid profile diagnostics is another key factor expected to fuel sales of cholesterol and lipid test products. Subsequently, increasing emphasis on blood lipid analysis to determine the risk of developing cardiovascular disease will foster growth.
The section below shows the analyzer kits leading the cholesterol and lipid test market. It is poised to exhibit a CAGR of 7.4% during the forecast period. By test type, the total cholesterol test asthma segment is anticipated to thrive at 6.0% CAGR.
Based on application, the hyperlipidemia segment is expected to dominate the global cholesterol and lipid test industry. It will likely expand at 6.9% CAGR between 2025 and 2035. By end-user, the hospital segment is projected to register a CAGR of 7.5% through 2035.
Market Growth Outlook by Product
| Product | Value CAGR |
|---|---|
| Test Strip Kits | 8.3% |
| Analyzer Kits | 7.4% |
Based on product, the analyzer kits segment generated a revenue of USD 3.1 billion in 2025. Over the assessment period, demand for analyzer kits is projected to rise at a CAGR of 7.4%. This is due to the rising usage of analyzer kits in a variety of settings, including hospitals, clinics, and diagnostic centers.
Advancements in analyzer kits will also drive growth of the target segment. Patients now have better access to cholesterol testing due to the development of cutting-edge testing kits.
Market Growth Outlook by Test Type
| Test Type | Value CAGR |
|---|---|
| Total Cholesterol Test | 6.0% |
| HDL Cholesterol Test | 7.1% |
| LDL Cholesterol Test | 7.9% |
| Triglycerides/VLDL Cholesterol Test | 8.7% |
| Others | 9.0% |
By test type, the total cholesterol test segment attained a valuation of USD 704.0 million in 2025. Over the forecast period, the target segment is anticipated to thrive at a healthy CAGR of 6.0%. It will likely retain its dominance throughout the assessment period.
Demand for total cholesterol tests is anticipated to increase due to the rising prevalence of cardiovascular illnesses and related risk factors, including diabetes and hypertension. Similarly, increasing the prevalence of high cholesterol and other related diseases will also boost the target segment.
Regular cholesterol testing is necessary for patients with a history of heart attacks to assess the efficacy of their medication. As a result, demand for total cholesterol tests is anticipated to rise significantly throughout the forecast period due to the rising prevalence of cardiac disorders.
Market Growth Outlook by Application
| Application | Value CAGR |
|---|---|
| Hyperlipidemia | 6.9% |
| Hypertriglyceridemia | 8.0% |
| Hyperlipoproteinemia | 8.5% |
| Tangier Disease | 6.4% |
| Familial Hypercholesterolemia | 7.5% |
| Others | 8.8% |
Based on application, the hyperlipidemia segment dominated the global cholesterol and lipid test market, holding a value share of about 25.9% in 2025. It will likely expand at a 6.9% CAGR through 2035. This is attributable to the rising prevalence of hyperlipidemia globally.
Poor dietary habits, characterized by high intake of saturated fats, trans fats, and cholesterol-rich foods, contribute to the development of hyperlipidemia. The rising incidence of this medical condition is expected to create demand for cholesterol and lipid tests.
Consuming foods such as red meat, full-fat dairy products, fried foods, and processed snacks can elevate cholesterol levels, especially low-density lipoprotein (LDL) cholesterol, commonly referred to as "bad" cholesterol. This will foster the growth of the target segment.
Market Growth Outlook by End-user
| End-user | Value CAGR |
|---|---|
| Clinics | 6.8% |
| Hospitals | 7.5% |
| Ambulatory Surgical Centers | 8.3% |
| Homecare Settings | 7.8% |
| Diagnostic Centers | 7.2% |
By end-users, the adoption of cholesterol and lipid test products remains high in hospitals. The target segment generated a revenue of about USD 765.5 million in 2025, holding 28.1% of the total market share.
For the assessment period, the hospitals segment is poised to exhibit a CAGR of 7.5%. This is due to the rising preference of people towards opting for cholesterol and lipid tests in hospitals due to lower costs.
Patients’ preference over choosing hospitals also includes factors such as disease severity, medical personnel availability, and availability of advanced machinery & better healthcare facilities. Hence, the hospital segment will continue to dominate the target market through 2035.
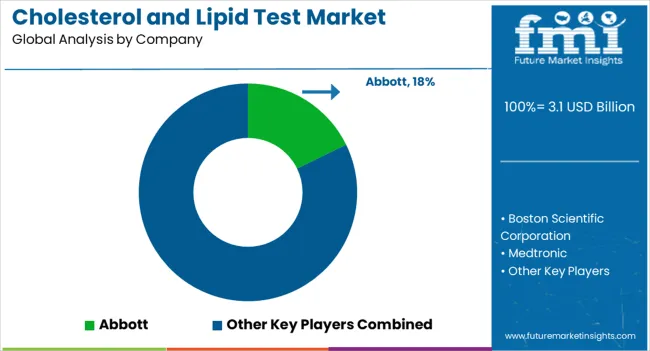
In recent years, leading players have introduced new technologies and products in the cholesterol and lipid test market. For example, Boditech Med introduced Ichorma LDL Cholesterol Direct in October 2024, and Ichroma AST secured export licenses. Both serve as warning signs for preventing lifestyle disorders, including arteriosclerosis, hypertension, diabetes, stroke, liver disease, etc.
Recent Developments in the Cholesterol and Lipid Test Market
The global cholesterol and lipid test market is estimated to be valued at USD 3.1 billion in 2025.
The market size for the cholesterol and lipid test market is projected to reach USD 6.3 billion by 2035.
The cholesterol and lipid test market is expected to grow at a 7.3% CAGR between 2025 and 2035.
The key product types in cholesterol and lipid test market are test strip kits and analyzer kits.
In terms of test type, total cholesterol test segment to command 38.4% share in the cholesterol and lipid test market in 2025.


Full Research Suite comprises of:
Market outlook & trends analysis
Interviews & case studies
Strategic recommendations
Vendor profiles & capabilities analysis
5-year forecasts
8 regions and 60+ country-level data splits
Market segment data splits
12 months of continuous data updates
DELIVERED AS:
PDF EXCEL ONLINE
Cholesterol Esterase Market Size and Share Forecast Outlook 2025 to 2035
Cholesterol Medicine Market Size and Share Forecast Outlook 2025 to 2035
Cholesterol Monitors Market Size and Share Forecast Outlook 2025 to 2035
Cholesterol API Market Analysis - Size, Share, and Forecast 2025 to 2035
Cholesterol Control Supplements Market – Growth, Demand & Health Trends
Cholesterol Reduced Butter Market
HDL Cholesterol Kits Market Size and Share Forecast Outlook 2025 to 2035
Point-of-care Cholesterol Monitoring Device Market Size and Share Forecast Outlook 2025 to 2035
Low-Fat and Low-Cholesterol Diet Market Growth - Health Trends 2025 to 2035
Heterozygous Familial Hypercholesterolemia (HEFH) Management Market Trends - Innovations & Growth 2025 to 2035
Android Automotive OS (AAOS) Market Size and Share Forecast Outlook 2025 to 2035
Anderson Cascade Impactor Market Size and Share Forecast Outlook 2025 to 2035
Andersen-Tawil Syndrome Treatment Market Trends - Growth & Future Prospects 2025 to 2035
Andro Supplements Market
Handheld Electrostatic Meter Market Size and Share Forecast Outlook 2025 to 2035
Hand Towel Automatic Folding Machine Market Size and Share Forecast Outlook 2025 to 2035
Handheld Ultrasound Scanner Market Size and Share Forecast Outlook 2025 to 2035
Handheld Tagging Gun Market Forecast and Outlook 2025 to 2035
Handheld Imaging Systems Market Size and Share Forecast Outlook 2025 to 2035
Sandwich Panel System Market Size and Share Forecast Outlook 2025 to 2035

Thank you!
You will receive an email from our Business Development Manager. Please be sure to check your SPAM/JUNK folder too.
Chat With
MaRIA