Cholesterol Monitors Market
Market Insights on Cholesterol Monitors covering sales outlook, demand forecast & up-to-date key trends
Cholesterol Monitors Market by Product Type, End User & Region - Forecast 2022 - 2032
Cholesterol Monitors Market Outlook (2022-2032)
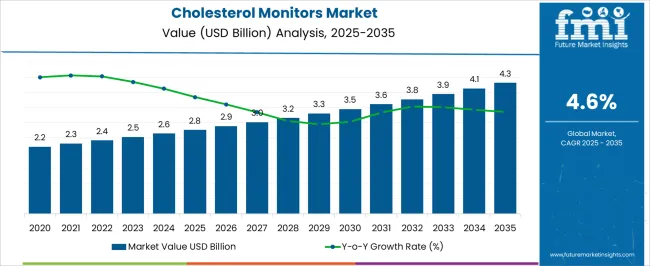
[279 Pages Report] The global cholesterol monitors market is expected to garner a market value worth US$ 2,514.6 Million in 2022. The growing popularity of non-invasive devices for cholesterol monitoring will further propel the growth of the global cholesterol monitor market. From 2022-2032, a CAGR of 7.4% has been projected for the cholesterol monitors market, anticipated to reach US4 5,502.4 Million.
“Rising cases of obesity and geriatric population in major countries like U.S, Germany and France have boosted the cases of patients suffering from high bad cholesterol, thereby the need for cholesterol testing kits is increasing day by day across the globe”
Attributes |
Key Statistics |
Global Cholesterol Monitors Market CAGR (2022-2032) |
7.4% |
Anticipated Market Value (2022) |
US$ 2,514.6 Million |
Global Cholesterol Monitors Market (2032) |
US$ 5,502.4 Million |
Global Cholesterol Monitors Market Attraction |
Innovation in miniaturization and increasing preference for preventive healthcare and self-monitoring are the major trends observed in the global cholesterol monitor market across the globe |
Cholesterol is a waxy fat-like substance (known as lipid) occurring naturally in all parts of the body and is vital for the normal functioning of the body. All the cholesterol that the body needs to build cells mainly comes from the liver but this can also be found in some foods. High levels of cholesterol (hyperlipidemia) in the blood lead to an increased risk of serious health conditions.
Proteins carry the cholesterol in the body and when combined they form lipoproteins, which are of two types - high-density lipoprotein (HDL) and low-density lipoprotein (LDL). HDL is known as ‘good cholesterol as it carries cholesterol away from the cells and back to the liver.
There it’s either broken down or eliminated from the body as a waste product. LDL is known as ‘bad cholesterol as it carries cholesterol to the cells needing it, however, excessive levels of cholesterol can build up in the walls of arteries which leads to artery diseases.
High cholesterol levels increase the risk of heart attack, stroke, atherosclerosis, and peripheral arterial disease (PAD) as cholesterol can build up in the artery wall and restrict the blood flow to the heart, brain, and other parts of the body. High cholesterol coupled with other factors such as an unhealthy diet, smoking, and hypertension can also increase the chances of developing heart problems.
Thus, cholesterol levels should be tested if a person has been diagnosed with a stroke, PAD, coronary heart disease, family history of early CVD, overweight, diabetes, cholesterol-related condition, or high blood pressure. As per the Centers for Disease Control and Prevention, 1 in 6 adults (16.3%) of the population has high cholesterol (which is defined as 240 mg/dL or higher).
Blood cholesterol is measured in units called millimoles per liter of blood (mmol/L). Blood tests or cholesterol monitors can measure the amount of cholesterol in the body. Cholesterol monitors are portable hand-held automatic devices that monitor the total cholesterol, LDL, HDL, and triglycerides.
Let us know your requirement to get
100% FREE customization
What are the Factors Propelling the Global Cholesterol Monitors Market?
The increasing prevalence of cardiovascular disorders coupled with a growing emphasis on early diagnosis and miniaturization of cholesterol monitors will drive the growth of the global cholesterol monitor market. In addition to this, the growing preference for self-monitoring to improve the quality of life and live a healthy lifestyle will further stimulate the growth of the global cholesterol monitor market.
Moreover, the growing emphasis to reduce the global burden of cardiovascular diseases (CVDs) along with measures for preventive healthcare practices such as screening and health check-up programs will propel the growth of the cholesterol monitor market. Further, government reforms to provide advanced healthcare services and awareness programs to improve the quality of testing will stimulate the growth of the global cholesterol monitor market.
What are the Factors Hampering the Global Cholesterol Monitors Market?
The dearth of awareness regarding health benefits linked with lipid testing for food and beverages in emerging economies such as Bangladesh, Africa, and Afghanistan is likely to restrict the market growth throughout the forecast period.
Moreover, the deficiency of food safety infrastructure and resources in the northern regions of Asia Pacific and the north and middle part of Africa is one of the key factors impeding the market expansion of cholesterol Monitors.
Find your sweet spots for generating winning opportunities in this market.
Talk to AnalystWhy is North America Emerging as an Opportunistic Cholesterol Monitors Market?
North America dominates the global cholesterol monitors market, accounting for nearly 35% in 2022. This market growth is primarily due to the rise in the incidence of CVDs coupled with the rapidly aging population, high preference for self-monitoring devices, and increased awareness related to prevention and early diagnosis of the diseases in the region.
According to the Centers for Disease Control and Prevention, nearly 1 in 2 American have high cholesterol i.e nearly 38% of American adults have high cholesterol (total blood cholesterol ≥ 200 mg/dL).1 Too much cholesterol puts you at risk for heart disease and stroke, two leading causes of death in the United States. Owing to the increased risk of high cholesterol and its asymptomatic nature, the need for cholesterol monitors is burgeoning incessantly in the region.
Additionally, the prevalence of heart diseases and obesity in the region is a major concern. The United Health Foundation's annual report revealed that the obesity rate increased from 31.5% in 2021 to 30.4% in 2020 in the United States. This, in turn, the mounting preference for preventive healthcare is also anticipated to drive regional growth. Rising awareness and initiatives from the government and several healthcare organizations are expected to propel market growth.
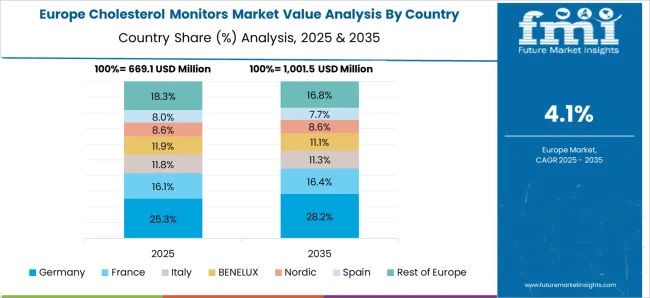
Why is the Demand for Cholesterol Monitors Burgeoning in Europe?
Europe is the second-largest region with the accountability for nearly 26% share in 2022. The region is likely to maintain its projected growth over the forecast period, reveals Future Market Insights. Weight problems and obesity are snowballing at a rapid rate Across the EU, with estimates of nearly 53% of the adult EU populace overweight in 2020. Obesity significantly increases the risk of chronic diseases such as cardiovascular disease, type-2 diabetes, and hypertension. Along with this, it is a major cause of rising cases of bad cholesterol in the Europe region.
According to the World Health Organisation, nearly 54% of men and women in Europe, the highest percentage for any region of the world are affected by ‘bad’ cholesterol. Besides, approx. 133.3 million people in the five largest states (Germany, France, Italy, Spain, and the UK) are suffering from high levels of bad cholesterol. Thereby, the government in several countries is making efforts to increase the testing and make certain guidelines to direct the people towards awareness of bad cholesterol.
Prominent manufacturers of cholesterol monitors are developing novel technologies and innovative testing kits to make cholesterol level testing easier and cheaper. Owing to the aforementioned factors, the region is offering a pool of growth prospects for the key players.

An unified Market Research Subscription Platform, built for today’s disparate research needs.
How Start-ups are Adding Value to the Global Cholesterol Monitors Market?
The swelling dispersion of start-ups in the Cholesterol Monitors market has improved the product quality and upsurged global sales. Besides, to gain a competitive edge, new start-ups are working on novel developments and launching new products such as:
- In March 2021, Ro scored a hefty US$ 500 Million Series D round led by existing investors General Catalyst, FirstMark Capital, and TQ Ventures. The company has raised $876 million since its founding in 2017. Kit diagnostic tests for patients directly through Ro’s platform, providing the objective health data necessary to inform high-quality care for a range of health conditions—from sexual health to chronic conditions like high cholesterol, hypertension, and diabetes.
- NuGenomics-a start-up launched in July 2021, uses patented technology to prognosis, prevent, diagnose, and cure lifestyle disorders by providing health-oriented data, insights, and actionable suggestions made by its AI/ML system as opposed to a nutritionist. The startup’s product offerings include Genetic Test Report, which is priced at Rs 8,999 and it helps people understand their pre-dispositions towards cholesterol, HDL, LDL, Triglyceride, and Blood Sugar levels along with several other conditions to help their existing trainers and nutritionists.
Who are the Key Players in the Global Cholesterol Monitors Market?
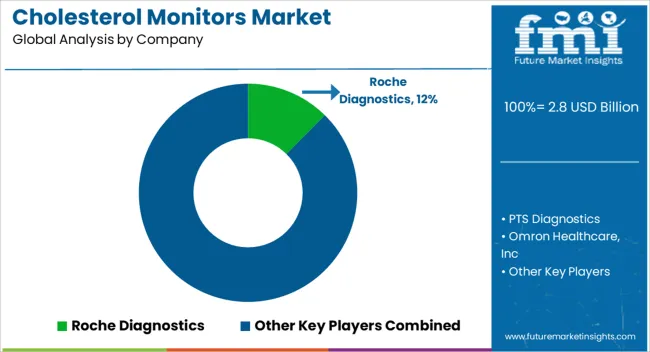
Some of the players identified in the global cholesterol monitors market include Roche Diagnostics, PTS Diagnostics, Omron Healthcare, Inc., ACON Laboratories, Inc., AccuTech, LLC, Alere Inc., Siemens, and Medline Industries, Inc., Abaxis, Inc., ManthaMed, and Fisher Scientific, among others. A key development in the Cholesterol Monitors market is follows:
- In May 2021, Roche and GenMark Diagnostics entered into a merger agreement in which Roche will fully acquire GenMark for $1.8 billion. Through the acquisition, Roche aims to expand its portfolio of molecular diagnostics with GenMark’s expertise in syndromic testing. The companies believe that GenMark’s ePlex systems will enhance Roche’s work in managing infectious diseases and antibiotic resistance.
- In May 2022, Zydus Lifesciences launched a Bempedoic Acid drug under the Bemdac brand for the treatment of uncontrolled levels of bad cholesterol.
- In February 2020, Esperion received approval from FDA for its cholesterol-lowering combo-Nexlizet (bempedoic acid-ezetimibe) to lower LDL cholesterol in patients with high cholesterol or established atherosclerotic cardiovascular disease who have reached maximum-tolerated statin therapy.
Report Scope
Report Attribute |
Details |
Growth Rate |
CAGR of 7.4% from 2022 to 2032 |
Market Value in 2022 |
US$ 2,514.6 Million |
Market Value in 2032 |
US$ 5,502.4 Million |
Base Year for Estimation |
2021 |
Forecast Period |
2022-2032 |
Quantitative Units |
Revenue in US$ Million, and CAGR from 2022-2032 |
Report Coverage |
Revenue Forecast, Company Ranking, Competitive Landscape, Growth Factors, Trends, and Pricing Analysis |
Segments Covered |
|
Regions Covered |
|
Key Countries Profiled |
|
Key Companies Profiled |
|
Customization |
Available Upon Request |
Key Segments Covered in the Cholesterol Monitors Industry Survey
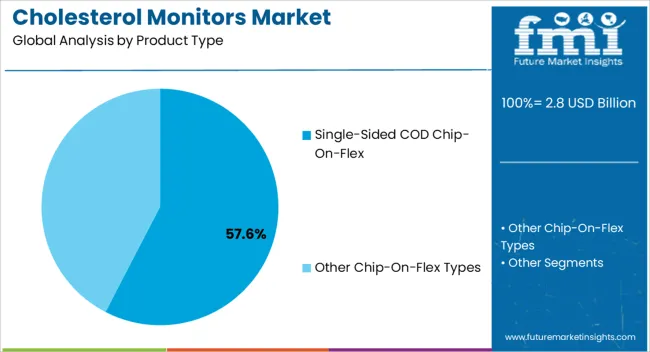
Cholesterol Monitors Market by Product Type:
- Cholesterol Monitors
- Cholesterol Monitoring Accessories
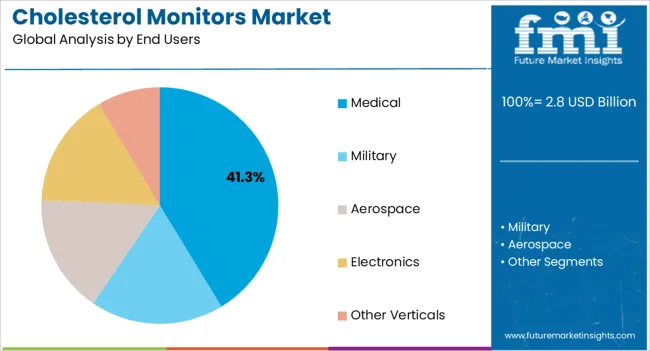
Cholesterol Monitors Market by End Users:
- Cholesterol Monitors for Hospitals
- Cholesterol Monitors for Clinics
- Cholesterol Monitors for Homecare Settings
- Cholesterol Monitors for Other End Users
Cholesterol Monitors Market by Region:
- North America Cholesterol Monitors Market
- Europe Cholesterol Monitors Market
- Asia-Pacific Cholesterol Monitors Market
- Middle East & Africa Cholesterol Monitors Market
- Latin America Cholesterol Monitors Market
Frequently Asked Questions
The global cholesterol monitors market is likely to value at US$ 2,514.6 Million in 2022
The global cholesterol monitors market is estimated to grow at a CAGR of 7.4% from 2022 to 2032
The global cholesterol monitors market is predicted to procure US$ 5.502.4 Million from 2022 to 2032
Table of Content
1. Executive Summary
1.1. Global Market Outlook
1.2. Demand-side Trends
1.3. Supply-side Trends
1.4. Technology Roadmap Analysis
1.5. Analysis and Recommendations
2. Market Overview
2.1. Market Coverage / Taxonomy
2.2. Market Definition / Scope / Limitations
3. Market Background
3.1. Market Dynamics
3.1.1. Drivers
3.1.2. Restraints
3.1.3. Opportunity
3.1.4. Trends
3.2. Scenario Forecast
3.2.1. Demand in Optimistic Scenario
3.2.2. Demand in Likely Scenario
3.2.3. Demand in Conservative Scenario
3.3. Opportunity Map Analysis
3.4. Product Life Cycle Analysis
3.5. Supply Chain Analysis
3.5.1. Supply Side Participants and their Roles
3.5.1.1. Producers
3.5.1.2. Mid-Level Participants (Traders/ Agents/ Brokers)
3.5.1.3. Wholesalers and Distributors
3.5.2. Value Added and Value Created at Node in the Supply Chain
3.5.3. List of Raw Material Suppliers
3.5.4. List of Existing and Potential Buyer’s
3.6. Investment Feasibility Matrix
3.7. Value Chain Analysis
3.7.1. Profit Margin Analysis
3.7.2. Wholesalers and Distributors
3.7.3. Retailers
3.8. PESTLE and Porter’s Analysis
3.9. Regulatory Landscape
3.9.1. By Key Regions
3.9.2. By Key Countries
3.10. Regional Parent Market Outlook
3.11. Production and Consumption Statistics
3.12. Import and Export Statistics
4. Global Cholesterol Monitors Market Analysis 2017-2021 and Forecast, 2022-2032
4.1. Historical Market Size Value (US$ Mn) & Volume (Units) Analysis, 2017-2021
4.2. Current and Future Market Size Value (US$ Mn) & Volume (Units) Projections, 2022-2032
4.2.1. Y-o-Y Growth Trend Analysis
4.2.2. Absolute $ Opportunity Analysis
5. Global Cholesterol Monitors Market Analysis 2017-2021 and Forecast 2022-2032, By Product
5.1. Introduction / Key Findings
5.2. Historical Market Size Value (US$ Mn) & Volume (Units) Analysis By Product, 2017-2021
5.3. Current and Future Market Size Value (US$ Mn) & Volume (Units) Analysis and Forecast By Product, 2022-2032
5.3.1. Cholesterol Monitors
5.3.2. Accessories
5.4. Y-o-Y Growth Trend Analysis By Product, 2017-2021
5.5. Absolute $ Opportunity Analysis By Product, 2022-2032
6. Global Cholesterol Monitors Market Analysis 2017-2021 and Forecast 2022-2032, By End User
6.1. Introduction / Key Findings
6.2. Historical Market Size Value (US$ Mn) & Volume (Units) Analysis By End User , 2017-2021
6.3. Current and Future Market Size Value (US$ Mn) & Volume (Units) Analysis and Forecast By End User , 2022-2032
6.3.1. Hospitals
6.3.2. Clinics
6.3.3. Homecare Settings
6.3.4. Others
6.4. Y-o-Y Growth Trend Analysis By End User , 2017-2021
6.5. Absolute $ Opportunity Analysis By End User , 2022-2032
7. Global Cholesterol Monitors Market Analysis 2017-2021 and Forecast 2022-2032, By Region
7.1. Introduction
7.2. Historical Market Size Value (US$ Mn) & Volume (Units) Analysis By Region, 2017-2021
7.3. Current Market Size Value (US$ Mn) & Volume (Units) Analysis and Forecast By Region, 2022-2032
7.3.1. North America
7.3.2. Latin America
7.3.3. Europe
7.3.4. Asia Pacific
7.3.5. MEA
7.4. Market Attractiveness Analysis By Region
8. North America Cholesterol Monitors Market Analysis 2017-2021 and Forecast 2022-2032, By Country
8.1. Historical Market Size Value (US$ Mn) & Volume (Units) Trend Analysis By Market Taxonomy, 2017-2021
8.2. Market Size Value (US$ Mn) & Volume (Units) Forecast By Market Taxonomy, 2022-2032
8.2.1. By Country
8.2.1.1. U.S.
8.2.1.2. Canada
8.2.2. By Product
8.2.3. By End User
8.3. Market Attractiveness Analysis
8.3.1. By Country
8.3.2. By Product
8.3.3. By End User
8.4. Key Takeaways
9. Latin America Cholesterol Monitors Market Analysis 2017-2021 and Forecast 2022-2032, By Country
9.1. Historical Market Size Value (US$ Mn) & Volume (Units) Trend Analysis By Market Taxonomy, 2017-2021
9.2. Market Size Value (US$ Mn) & Volume (Units) Forecast By Market Taxonomy, 2022-2032
9.2.1. By Country
9.2.1.1. Brazil
9.2.1.2. Mexico
9.2.1.3. Rest of Latin America
9.2.2. By Product
9.2.3. By End User
9.3. Market Attractiveness Analysis
9.3.1. By Country
9.3.2. By Product
9.3.3. By End User
9.4. Key Takeaways
10. Europe Cholesterol Monitors Market Analysis 2017-2021 and Forecast 2022-2032, By Country
10.1. Historical Market Size Value (US$ Mn) & Volume (Units) Trend Analysis By Market Taxonomy, 2017-2021
10.2. Market Size Value (US$ Mn) & Volume (Units) Forecast By Market Taxonomy, 2022-2032
10.2.1. By Country
10.2.1.1. Germany
10.2.1.2. U.K.
10.2.1.3. France
10.2.1.4. Spain
10.2.1.5. Italy
10.2.1.6. Rest of Europe
10.2.2. By Product
10.2.3. By End User
10.3. Market Attractiveness Analysis
10.3.1. By Country
10.3.2. By Product
10.3.3. By End User
10.4. Key Takeaways
11. Asia Pacific Cholesterol Monitors Market Analysis 2017-2021 and Forecast 2022-2032, By Country
11.1. Historical Market Size Value (US$ Mn) & Volume (Units) Trend Analysis By Market Taxonomy, 2017-2021
11.2. Market Size Value (US$ Mn) & Volume (Units) Forecast By Market Taxonomy, 2022-2032
11.2.1. By Country
11.2.1.1. China
11.2.1.2. Japan
11.2.1.3. South Korea
11.2.1.4. Malaysia
11.2.1.5. Singapore
11.2.1.6. Australia
11.2.1.7. New Zealand
11.2.1.8. Rest of APAC
11.2.2. By Product
11.2.3. By End User
11.3. Market Attractiveness Analysis
11.3.1. By Country
11.3.2. By Product
11.3.3. By End User
11.4. Key Takeaways
12. MEA Cholesterol Monitors Market Analysis 2017-2021 and Forecast 2022-2032, By Country
12.1. Historical Market Size Value (US$ Mn) & Volume (Units) Trend Analysis By Market Taxonomy, 2017-2021
12.2. Market Size Value (US$ Mn) & Volume (Units) Forecast By Market Taxonomy, 2022-2032
12.2.1. By Country
12.2.1.1. GCC Countries
12.2.1.2. South Africa
12.2.1.3. Israel
12.2.1.4. Rest of MEA
12.2.2. By Product
12.2.3. By End User
12.3. Market Attractiveness Analysis
12.3.1. By Country
12.3.2. By Product
12.3.3. By End User
12.4. Key Takeaways
13. Key Countries Cholesterol Monitors Market Analysis
13.1. U.S.
13.1.1. Pricing Analysis
13.1.2. Market Share Analysis, 2021
13.1.2.1. By Product
13.1.2.2. By End User
13.2. Canada
13.2.1. Pricing Analysis
13.2.2. Market Share Analysis, 2021
13.2.2.1. By Product
13.2.2.2. By End User
13.3. Brazil
13.3.1. Pricing Analysis
13.3.2. Market Share Analysis, 2021
13.3.2.1. By Product
13.3.2.2. By End User
13.4. Mexico
13.4.1. Pricing Analysis
13.4.2. Market Share Analysis, 2021
13.4.2.1. By Product
13.4.2.2. By End User
13.5. Germany
13.5.1. Pricing Analysis
13.5.2. Market Share Analysis, 2021
13.5.2.1. By Product
13.5.2.2. By End User
13.6. U.K.
13.6.1. Pricing Analysis
13.6.2. Market Share Analysis, 2021
13.6.2.1. By Product
13.6.2.2. By End User
13.7. France
13.7.1. Pricing Analysis
13.7.2. Market Share Analysis, 2021
13.7.2.1. By Product
13.7.2.2. By End User
13.8. Spain
13.8.1. Pricing Analysis
13.8.2. Market Share Analysis, 2021
13.8.2.1. By Product
13.8.2.2. By End User
13.9. Italy
13.9.1. Pricing Analysis
13.9.2. Market Share Analysis, 2021
13.9.2.1. By Product
13.9.2.2. By End User
13.10. China
13.10.1. Pricing Analysis
13.10.2. Market Share Analysis, 2021
13.10.2.1. By Product
13.10.2.2. By End User
13.11. Japan
13.11.1. Pricing Analysis
13.11.2. Market Share Analysis, 2021
13.11.2.1. By Product
13.11.2.2. By End User
13.12. South Korea
13.12.1. Pricing Analysis
13.12.2. Market Share Analysis, 2021
13.12.2.1. By Product
13.12.2.2. By End User
13.13. Malaysia
13.13.1. Pricing Analysis
13.13.2. Market Share Analysis, 2021
13.13.2.1. By Product
13.13.2.2. By End User
13.14. Singapore
13.14.1. Pricing Analysis
13.14.2. Market Share Analysis, 2021
13.14.2.1. By Product
13.14.2.2. By End User
13.15. Australia
13.15.1. Pricing Analysis
13.15.2. Market Share Analysis, 2021
13.15.2.1. By Product
13.15.2.2. By End User
13.16. New Zealand
13.16.1. Pricing Analysis
13.16.2. Market Share Analysis, 2021
13.16.2.1. By Product
13.16.2.2. By End User
13.17. GCC Countries
13.17.1. Pricing Analysis
13.17.2. Market Share Analysis, 2021
13.17.2.1. By Product
13.17.2.2. By End User
13.18. South Africa
13.18.1. Pricing Analysis
13.18.2. Market Share Analysis, 2021
13.18.2.1. By Product
13.18.2.2. By End User
13.19. Israel
13.19.1. Pricing Analysis
13.19.2. Market Share Analysis, 2021
13.19.2.1. By Product
13.19.2.2. By End User
14. Market Structure Analysis
14.1. Competition Dashboard
14.2. Competition Benchmarking
14.3. Market Share Analysis of Top Players
14.3.1. By Regional
14.3.2. By Product
14.3.3. By End User
15. Competition Analysis
15.1. Competition Deep Dive
15.1.1. Roche Diagnostics
15.1.1.1. Overview
15.1.1.2. Product Portfolio
15.1.1.3. Profitability by Market Segments
15.1.1.4. Sales Footprint
15.1.1.5. Strategy Overview
15.1.1.5.1. Marketing Strategy
15.1.1.5.2. Product Strategy
15.1.1.5.3. Channel Strategy
15.1.2. PTS Diagnostics
15.1.2.1. Overview
15.1.2.2. Product Portfolio
15.1.2.3. Profitability by Market Segments
15.1.2.4. Sales Footprint
15.1.2.5. Strategy Overview
15.1.2.5.1. Marketing Strategy
15.1.2.5.2. Product Strategy
15.1.2.5.3. Channel Strategy
15.1.3. Omron Healthcare, Inc.
15.1.3.1. Overview
15.1.3.2. Product Portfolio
15.1.3.3. Profitability by Market Segments
15.1.3.4. Sales Footprint
15.1.3.5. Strategy Overview
15.1.3.5.1. Marketing Strategy
15.1.3.5.2. Product Strategy
15.1.3.5.3. Channel Strategy
15.1.4. ACON Laboratories, Inc.
15.1.4.1. Overview
15.1.4.2. Product Portfolio
15.1.4.3. Profitability by Market Segments
15.1.4.4. Sales Footprint
15.1.4.5. Strategy Overview
15.1.4.5.1. Marketing Strategy
15.1.4.5.2. Product Strategy
15.1.4.5.3. Channel Strategy
15.1.5. AccuTech LLC
15.1.5.1. Overview
15.1.5.2. Product Portfolio
15.1.5.3. Profitability by Market Segments
15.1.5.4. Sales Footprint
15.1.5.5. Strategy Overview
15.1.5.5.1. Marketing Strategy
15.1.5.5.2. Product Strategy
15.1.5.5.3. Channel Strategy
15.1.6. Alere Inc
15.1.6.1. Overview
15.1.6.2. Product Portfolio
15.1.6.3. Profitability by Market Segments
15.1.6.4. Sales Footprint
15.1.6.5. Strategy Overview
15.1.6.5.1. Marketing Strategy
15.1.6.5.2. Product Strategy
15.1.6.5.3. Channel Strategy
15.1.7. Siemens
15.1.7.1. Overview
15.1.7.2. Product Portfolio
15.1.7.3. Profitability by Market Segments
15.1.7.4. Sales Footprint
15.1.7.5. Strategy Overview
15.1.7.5.1. Marketing Strategy
15.1.7.5.2. Product Strategy
15.1.7.5.3. Channel Strategy
15.1.8. Medline Industries, Inc.
15.1.8.1. Overview
15.1.8.2. Product Portfolio
15.1.8.3. Profitability by Market Segments
15.1.8.4. Sales Footprint
15.1.8.5. Strategy Overview
15.1.8.5.1. Marketing Strategy
15.1.8.5.2. Product Strategy
15.1.8.5.3. Channel Strategy
15.1.9. Abaxis, Inc.
15.1.9.1. Overview
15.1.9.2. Product Portfolio
15.1.9.3. Profitability by Market Segments
15.1.9.4. Sales Footprint
15.1.9.5. Strategy Overview
15.1.9.5.1. Marketing Strategy
15.1.9.5.2. Product Strategy
15.1.9.5.3. Channel Strategy
15.1.10. ManthaMed
15.1.10.1. Overview
15.1.10.2. Product Portfolio
15.1.10.3. Profitability by Market Segments
15.1.10.4. Sales Footprint
15.1.10.5. Strategy Overview
15.1.10.5.1. Marketing Strategy
15.1.10.5.2. Product Strategy
15.1.10.5.3. Channel Strategy
15.1.11. Fisher Scientific
15.1.11.1. Overview
15.1.11.2. Product Portfolio
15.1.11.3. Profitability by Market Segments
15.1.11.4. Sales Footprint
15.1.11.5. Strategy Overview
15.1.11.5.1. Marketing Strategy
15.1.11.5.2. Product Strategy
15.1.11.5.3. Channel Strategy
16. Assumptions & Acronyms Used
17. Research Methodology
Let us know your requirement to get
100% FREE customization
List of Tables
Table 1: Global Cholesterol Monitors Market Value (US$ Mn) Forecast by Region, 2017-2032
Table 2: Global Cholesterol Monitors Market Volume (Units) Forecast by Region, 2017-2032
Table 3: Global Cholesterol Monitors Market Value (US$ Mn) Forecast by Product, 2017-2032
Table 4: Global Cholesterol Monitors Market Volume (Units) Forecast by Product, 2017-2032
Table 5: Global Cholesterol Monitors Market Value (US$ Mn) Forecast by End User , 2017-2032
Table 6: Global Cholesterol Monitors Market Volume (Units) Forecast by End User , 2017-2032
Table 7: North America Cholesterol Monitors Market Value (US$ Mn) Forecast by Country, 2017-2032
Table 8: North America Cholesterol Monitors Market Volume (Units) Forecast by Country, 2017-2032
Table 9: North America Cholesterol Monitors Market Value (US$ Mn) Forecast by Product, 2017-2032
Table 10: North America Cholesterol Monitors Market Volume (Units) Forecast by Product, 2017-2032
Table 11: North America Cholesterol Monitors Market Value (US$ Mn) Forecast by End User , 2017-2032
Table 12: North America Cholesterol Monitors Market Volume (Units) Forecast by End User , 2017-2032
Table 13: Latin America Cholesterol Monitors Market Value (US$ Mn) Forecast by Country, 2017-2032
Table 14: Latin America Cholesterol Monitors Market Volume (Units) Forecast by Country, 2017-2032
Table 15: Latin America Cholesterol Monitors Market Value (US$ Mn) Forecast by Product, 2017-2032
Table 16: Latin America Cholesterol Monitors Market Volume (Units) Forecast by Product, 2017-2032
Table 17: Latin America Cholesterol Monitors Market Value (US$ Mn) Forecast by End User , 2017-2032
Table 18: Latin America Cholesterol Monitors Market Volume (Units) Forecast by End User , 2017-2032
Table 19: Europe Cholesterol Monitors Market Value (US$ Mn) Forecast by Country, 2017-2032
Table 20: Europe Cholesterol Monitors Market Volume (Units) Forecast by Country, 2017-2032
Table 21: Europe Cholesterol Monitors Market Value (US$ Mn) Forecast by Product, 2017-2032
Table 22: Europe Cholesterol Monitors Market Volume (Units) Forecast by Product, 2017-2032
Table 23: Europe Cholesterol Monitors Market Value (US$ Mn) Forecast by End User , 2017-2032
Table 24: Europe Cholesterol Monitors Market Volume (Units) Forecast by End User , 2017-2032
Table 25: Asia Pacific Cholesterol Monitors Market Value (US$ Mn) Forecast by Country, 2017-2032
Table 26: Asia Pacific Cholesterol Monitors Market Volume (Units) Forecast by Country, 2017-2032
Table 27: Asia Pacific Cholesterol Monitors Market Value (US$ Mn) Forecast by Product, 2017-2032
Table 28: Asia Pacific Cholesterol Monitors Market Volume (Units) Forecast by Product, 2017-2032
Table 29: Asia Pacific Cholesterol Monitors Market Value (US$ Mn) Forecast by End User , 2017-2032
Table 30: Asia Pacific Cholesterol Monitors Market Volume (Units) Forecast by End User , 2017-2032
Table 31: MEA Cholesterol Monitors Market Value (US$ Mn) Forecast by Country, 2017-2032
Table 32: MEA Cholesterol Monitors Market Volume (Units) Forecast by Country, 2017-2032
Table 33: MEA Cholesterol Monitors Market Value (US$ Mn) Forecast by Product, 2017-2032
Table 34: MEA Cholesterol Monitors Market Volume (Units) Forecast by Product, 2017-2032
Table 35: MEA Cholesterol Monitors Market Value (US$ Mn) Forecast by End User , 2017-2032
Table 36: MEA Cholesterol Monitors Market Volume (Units) Forecast by End User , 2017-2032
Find your sweet spots for generating winning opportunities in this market.
Talk to AnalystList of Charts
Figure 1: Global Cholesterol Monitors Market Value (US$ Mn) by Product, 2022-2032
Figure 2: Global Cholesterol Monitors Market Value (US$ Mn) by End User , 2022-2032
Figure 3: Global Cholesterol Monitors Market Value (US$ Mn) by Region, 2022-2032
Figure 4: Global Cholesterol Monitors Market Value (US$ Mn) Analysis by Region, 2017-2032
Figure 5: Global Cholesterol Monitors Market Volume (Units) Analysis by Region, 2017-2032
Figure 6: Global Cholesterol Monitors Market Value Share (%) and BPS Analysis by Region, 2022-2032
Figure 7: Global Cholesterol Monitors Market Y-o-Y Growth (%) Projections by Region, 2022-2032
Figure 8: Global Cholesterol Monitors Market Value (US$ Mn) Analysis by Product, 2017-2032
Figure 9: Global Cholesterol Monitors Market Volume (Units) Analysis by Product, 2017-2032
Figure 10: Global Cholesterol Monitors Market Value Share (%) and BPS Analysis by Product, 2022-2032
Figure 11: Global Cholesterol Monitors Market Y-o-Y Growth (%) Projections by Product, 2022-2032
Figure 12: Global Cholesterol Monitors Market Value (US$ Mn) Analysis by End User , 2017-2032
Figure 13: Global Cholesterol Monitors Market Volume (Units) Analysis by End User , 2017-2032
Figure 14: Global Cholesterol Monitors Market Value Share (%) and BPS Analysis by End User , 2022-2032
Figure 15: Global Cholesterol Monitors Market Y-o-Y Growth (%) Projections by End User , 2022-2032
Figure 16: Global Cholesterol Monitors Market Attractiveness by Product, 2022-2032
Figure 17: Global Cholesterol Monitors Market Attractiveness by End User , 2022-2032
Figure 18: Global Cholesterol Monitors Market Attractiveness by Region, 2022-2032
Figure 19: North America Cholesterol Monitors Market Value (US$ Mn) by Product, 2022-2032
Figure 20: North America Cholesterol Monitors Market Value (US$ Mn) by End User , 2022-2032
Figure 21: North America Cholesterol Monitors Market Value (US$ Mn) by Country, 2022-2032
Figure 22: North America Cholesterol Monitors Market Value (US$ Mn) Analysis by Country, 2017-2032
Figure 23: North America Cholesterol Monitors Market Volume (Units) Analysis by Country, 2017-2032
Figure 24: North America Cholesterol Monitors Market Value Share (%) and BPS Analysis by Country, 2022-2032
Figure 25: North America Cholesterol Monitors Market Y-o-Y Growth (%) Projections by Country, 2022-2032
Figure 26: North America Cholesterol Monitors Market Value (US$ Mn) Analysis by Product, 2017-2032
Figure 27: North America Cholesterol Monitors Market Volume (Units) Analysis by Product, 2017-2032
Figure 28: North America Cholesterol Monitors Market Value Share (%) and BPS Analysis by Product, 2022-2032
Figure 29: North America Cholesterol Monitors Market Y-o-Y Growth (%) Projections by Product, 2022-2032
Figure 30: North America Cholesterol Monitors Market Value (US$ Mn) Analysis by End User , 2017-2032
Figure 31: North America Cholesterol Monitors Market Volume (Units) Analysis by End User , 2017-2032
Figure 32: North America Cholesterol Monitors Market Value Share (%) and BPS Analysis by End User , 2022-2032
Figure 33: North America Cholesterol Monitors Market Y-o-Y Growth (%) Projections by End User , 2022-2032
Figure 34: North America Cholesterol Monitors Market Attractiveness by Product, 2022-2032
Figure 35: North America Cholesterol Monitors Market Attractiveness by End User , 2022-2032
Figure 36: North America Cholesterol Monitors Market Attractiveness by Country, 2022-2032
Figure 37: Latin America Cholesterol Monitors Market Value (US$ Mn) by Product, 2022-2032
Figure 38: Latin America Cholesterol Monitors Market Value (US$ Mn) by End User , 2022-2032
Figure 39: Latin America Cholesterol Monitors Market Value (US$ Mn) by Country, 2022-2032
Figure 40: Latin America Cholesterol Monitors Market Value (US$ Mn) Analysis by Country, 2017-2032
Figure 41: Latin America Cholesterol Monitors Market Volume (Units) Analysis by Country, 2017-2032
Figure 42: Latin America Cholesterol Monitors Market Value Share (%) and BPS Analysis by Country, 2022-2032
Figure 43: Latin America Cholesterol Monitors Market Y-o-Y Growth (%) Projections by Country, 2022-2032
Figure 44: Latin America Cholesterol Monitors Market Value (US$ Mn) Analysis by Product, 2017-2032
Figure 45: Latin America Cholesterol Monitors Market Volume (Units) Analysis by Product, 2017-2032
Figure 46: Latin America Cholesterol Monitors Market Value Share (%) and BPS Analysis by Product, 2022-2032
Figure 47: Latin America Cholesterol Monitors Market Y-o-Y Growth (%) Projections by Product, 2022-2032
Figure 48: Latin America Cholesterol Monitors Market Value (US$ Mn) Analysis by End User , 2017-2032
Figure 49: Latin America Cholesterol Monitors Market Volume (Units) Analysis by End User , 2017-2032
Figure 50: Latin America Cholesterol Monitors Market Value Share (%) and BPS Analysis by End User , 2022-2032
Figure 51: Latin America Cholesterol Monitors Market Y-o-Y Growth (%) Projections by End User , 2022-2032
Figure 52: Latin America Cholesterol Monitors Market Attractiveness by Product, 2022-2032
Figure 53: Latin America Cholesterol Monitors Market Attractiveness by End User , 2022-2032
Figure 54: Latin America Cholesterol Monitors Market Attractiveness by Country, 2022-2032
Figure 55: Europe Cholesterol Monitors Market Value (US$ Mn) by Product, 2022-2032
Figure 56: Europe Cholesterol Monitors Market Value (US$ Mn) by End User , 2022-2032
Figure 57: Europe Cholesterol Monitors Market Value (US$ Mn) by Country, 2022-2032
Figure 58: Europe Cholesterol Monitors Market Value (US$ Mn) Analysis by Country, 2017-2032
Figure 59: Europe Cholesterol Monitors Market Volume (Units) Analysis by Country, 2017-2032
Figure 60: Europe Cholesterol Monitors Market Value Share (%) and BPS Analysis by Country, 2022-2032
Figure 61: Europe Cholesterol Monitors Market Y-o-Y Growth (%) Projections by Country, 2022-2032
Figure 62: Europe Cholesterol Monitors Market Value (US$ Mn) Analysis by Product, 2017-2032
Figure 63: Europe Cholesterol Monitors Market Volume (Units) Analysis by Product, 2017-2032
Figure 64: Europe Cholesterol Monitors Market Value Share (%) and BPS Analysis by Product, 2022-2032
Figure 65: Europe Cholesterol Monitors Market Y-o-Y Growth (%) Projections by Product, 2022-2032
Figure 66: Europe Cholesterol Monitors Market Value (US$ Mn) Analysis by End User , 2017-2032
Figure 67: Europe Cholesterol Monitors Market Volume (Units) Analysis by End User , 2017-2032
Figure 68: Europe Cholesterol Monitors Market Value Share (%) and BPS Analysis by End User , 2022-2032
Figure 69: Europe Cholesterol Monitors Market Y-o-Y Growth (%) Projections by End User , 2022-2032
Figure 70: Europe Cholesterol Monitors Market Attractiveness by Product, 2022-2032
Figure 71: Europe Cholesterol Monitors Market Attractiveness by End User , 2022-2032
Figure 72: Europe Cholesterol Monitors Market Attractiveness by Country, 2022-2032
Figure 73: Asia Pacific Cholesterol Monitors Market Value (US$ Mn) by Product, 2022-2032
Figure 74: Asia Pacific Cholesterol Monitors Market Value (US$ Mn) by End User , 2022-2032
Figure 75: Asia Pacific Cholesterol Monitors Market Value (US$ Mn) by Country, 2022-2032
Figure 76: Asia Pacific Cholesterol Monitors Market Value (US$ Mn) Analysis by Country, 2017-2032
Figure 77: Asia Pacific Cholesterol Monitors Market Volume (Units) Analysis by Country, 2017-2032
Figure 78: Asia Pacific Cholesterol Monitors Market Value Share (%) and BPS Analysis by Country, 2022-2032
Figure 79: Asia Pacific Cholesterol Monitors Market Y-o-Y Growth (%) Projections by Country, 2022-2032
Figure 80: Asia Pacific Cholesterol Monitors Market Value (US$ Mn) Analysis by Product, 2017-2032
Figure 81: Asia Pacific Cholesterol Monitors Market Volume (Units) Analysis by Product, 2017-2032
Figure 82: Asia Pacific Cholesterol Monitors Market Value Share (%) and BPS Analysis by Product, 2022-2032
Figure 83: Asia Pacific Cholesterol Monitors Market Y-o-Y Growth (%) Projections by Product, 2022-2032
Figure 84: Asia Pacific Cholesterol Monitors Market Value (US$ Mn) Analysis by End User , 2017-2032
Figure 85: Asia Pacific Cholesterol Monitors Market Volume (Units) Analysis by End User , 2017-2032
Figure 86: Asia Pacific Cholesterol Monitors Market Value Share (%) and BPS Analysis by End User , 2022-2032
Figure 87: Asia Pacific Cholesterol Monitors Market Y-o-Y Growth (%) Projections by End User , 2022-2032
Figure 88: Asia Pacific Cholesterol Monitors Market Attractiveness by Product, 2022-2032
Figure 89: Asia Pacific Cholesterol Monitors Market Attractiveness by End User , 2022-2032
Figure 90: Asia Pacific Cholesterol Monitors Market Attractiveness by Country, 2022-2032
Figure 91: MEA Cholesterol Monitors Market Value (US$ Mn) by Product, 2022-2032
Figure 92: MEA Cholesterol Monitors Market Value (US$ Mn) by End User , 2022-2032
Figure 93: MEA Cholesterol Monitors Market Value (US$ Mn) by Country, 2022-2032
Figure 94: MEA Cholesterol Monitors Market Value (US$ Mn) Analysis by Country, 2017-2032
Figure 95: MEA Cholesterol Monitors Market Volume (Units) Analysis by Country, 2017-2032
Figure 96: MEA Cholesterol Monitors Market Value Share (%) and BPS Analysis by Country, 2022-2032
Figure 97: MEA Cholesterol Monitors Market Y-o-Y Growth (%) Projections by Country, 2022-2032
Figure 98: MEA Cholesterol Monitors Market Value (US$ Mn) Analysis by Product, 2017-2032
Figure 99: MEA Cholesterol Monitors Market Volume (Units) Analysis by Product, 2017-2032
Figure 100: MEA Cholesterol Monitors Market Value Share (%) and BPS Analysis by Product, 2022-2032
Figure 101: MEA Cholesterol Monitors Market Y-o-Y Growth (%) Projections by Product, 2022-2032
Figure 102: MEA Cholesterol Monitors Market Value (US$ Mn) Analysis by End User , 2017-2032
Figure 103: MEA Cholesterol Monitors Market Volume (Units) Analysis by End User , 2017-2032
Figure 104: MEA Cholesterol Monitors Market Value Share (%) and BPS Analysis by End User , 2022-2032
Figure 105: MEA Cholesterol Monitors Market Y-o-Y Growth (%) Projections by End User , 2022-2032
Figure 106: MEA Cholesterol Monitors Market Attractiveness by Product, 2022-2032
Figure 107: MEA Cholesterol Monitors Market Attractiveness by End User , 2022-2032
Figure 108: MEA Cholesterol Monitors Market Attractiveness by Country, 2022-2032
Need specific information?
Request CustomizationExplore Healthcare Insights
View Reports