VOC Sensors and Monitors Market Size and Share Forecast Outlook 2025 to 2035

The global VOC sensors and monitors market is valued at USD 204.0 million in 2025 and is slated to reach USD 431.3 million by 2035, reflecting a CAGR of 7.6%.
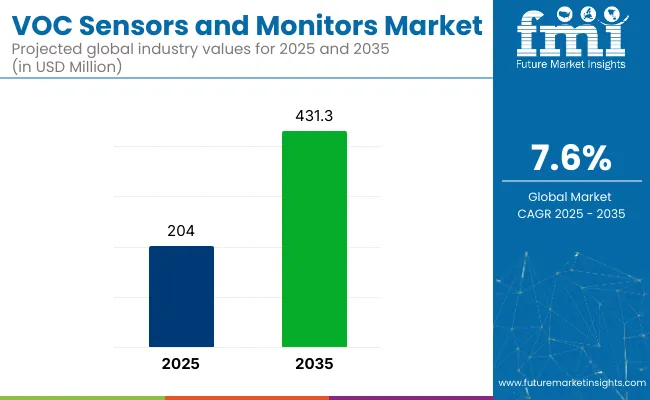
Quick Stats for VOC Sensors and Monitors Market

  • Market Value (2025): USD 204.0 million
  • Forecast Value (2035): USD 431.3 million
  • Forecast CAGR: 7.6%
  • Device Leader in 2025: Monitors (60%market share)
  • Top Application: Industrial Process Monitoring (42% Market Share)
  • Key Growth Region: North America (fastest-growing market in the USA with 7.9% CAGR)

Voc Sensors And Monitors Market

Metric Value
Estimated Size (2025) USD 204.0 million
Projected Value (2035) USD 431.3 million
CAGR (2025 to 2035) 7.6%

This growth is expected to be fueled by rising environmental awareness, regulatory pressure, and an increasing focus on air quality monitoring in industrial and residential spaces. Demand is also being reinforced by stricter emission norms and the widespread adoption of smart sensor networks across developed and emerging economies.

North America is projected to hold the largest market share by 2035 due to its advanced regulatory landscape, especially with the USA rapidly growing at a CAGR of 7.9%. Whereas Germany and France closely follow the fastest growth at CAGRs of 7.7% and 7.5% respectively.Monitors are likely to hold with over 60% share due to their widespread use in heavy industrial settings. Meanwhile, industrial process monitoring by application segment accounts for 42% of the market share.

In terms of the competitive landscape, companies such as Honeywell and Sensirion are witnessing strong profitability due to their IoT-enabled product lines and regulatory-ready solutions. Meanwhile, Japanese firms are facing slower adoption rates due to higher costs and lower penetration of smart systems. Europe is experiencing success in deploying sustainable sensor technologies aligned with its Green Deal initiatives. Government regulations such as the EU’s Industrial Emissions Directive and California’s air quality standards have been instrumental in driving the market forward.

The VOC sensors and monitors market holds varying but impactful shares across its parent markets. Within the indoor air quality monitoring market, it commands a strong 30-35% share, as VOC detection is central to IAQ compliance. In the air quality monitoring market, it contributes around 20-25%, particularly in smart building and urban monitoring applications.

It captures approximately 15% of the gas sensors market, given the diversity of gases measured. In the industrial safety equipment market, its share is about 10-12%, driven by workplace exposure limits. Overall, VOC sensors play a critical role in health, safety, and regulatory monitoring systems.

Analyzing VOC Sensors and Monitors Market by Top Investment Segments

The global VOC sensors and monitors market is segmented into device type, application, and region. Under device type, the market includes sensors and monitors. By application, it is categorized into industrial process monitoring, environmental monitoring, air purification and monitoring, and leak detection. Regional segmentation covers North America, Latin America, Europe, Asia Pacific, and MEA.

By Device Type, Monitors account for 60% of the Market Share

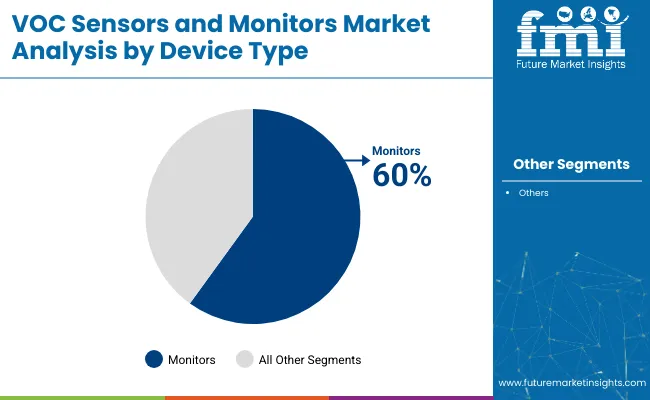
Monitors are projected to hold more than 60% of the global market share through 2035, driven by rising installations in industrial and commercial facilities where real-time VOC tracking is critical. Their integration with IoT platforms enhances their value in regulatory compliance and safety assurance. The ability to continuously detect low-level VOC concentrations has further solidified their role in high-risk and quality-sensitive environments.
  • Monitors are preferred in the petrochemical and manufacturing industries.
  • IoT-enabled monitors are gaining traction for smart city applications.
  • Sensors are growing in adoption in portable and compact devices.
  • Fixed monitors lead in long-term air quality management.

Voc Sensors And Monitors Market Analysis By Device Type

By Application, Industrial Process Monitoring Accounts for 42% of the Market Share

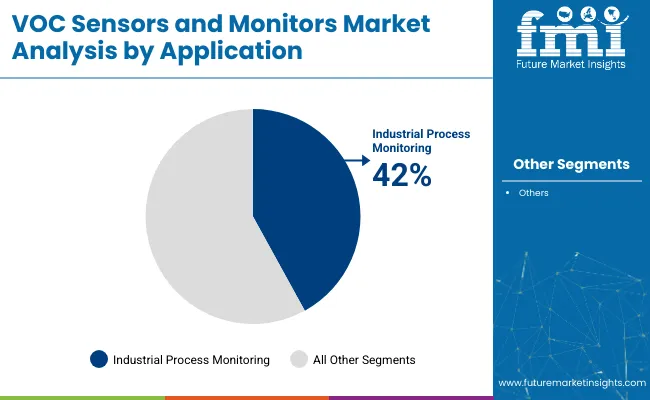
Industrial process monitoring is expected to command approximately 42% share of the total application base due to the need for strict compliance in sectors such as oil & gas, chemicals, and heavy manufacturing. Their deployment supports predictive maintenance and reduces exposure risks to hazardous compounds for workers. These systems are increasingly being standardized across production lines to meet emission norms.
  • High regulatory burden in industrial sectors boosts adoption.
  • Leak detection is a rising application area in energy plants.
  • Air purification systems increasingly feature embedded sensors.
  • Environmental monitoring is gaining relevance in smart urban projects.

Voc Sensors And Monitors Market Analysis By Application

Top VOC Sensors and Monitors Market Dynamics

Recent Trends in the VOC Sensors and Monitors Market
  • Integration of VOC sensors with IoT and cloud platforms is becoming standard in industrial environments.
  • Demand for miniaturized, battery-efficient portable monitors is accelerating in field applications.
  • Sustainable sensor designs using recyclable and low-carbon materials are gaining popularity in Europe.
  • Smart city initiatives are fueling the adoption of real-time air quality monitoring systems globally.

Key Challenges in the VOC Sensors and Monitors Market

  • High production costs for advanced VOC sensors limit adoption in cost-sensitive regions.
  • Supply chain disruptions for sensor components are affecting timely product delivery.
  • The complexity of calibrating VOC sensors for varying environmental conditions hampers accuracy.
  • Variability in regional regulatory standards complicates global product standardization.

Analyzing Top Countries Manufacturing and Supplying VOC Sensors and Monitors

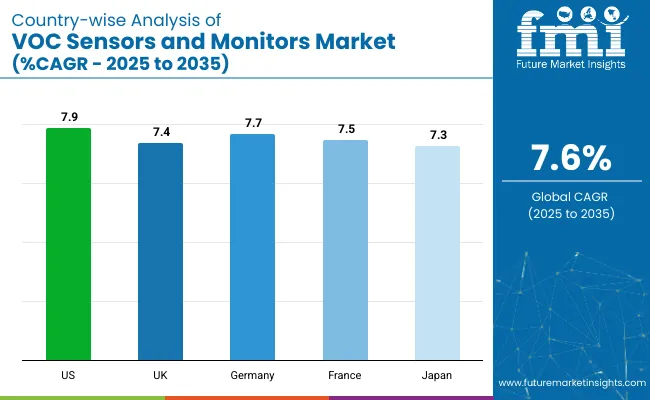
Country Wise Analysis Of Voc Sensors And Monitors Market

The USA leads the market with a projected CAGR of 7.9%, driven by strict EPA and CARB regulations and advanced IoT integration. Germany follows at 7.7%, supported by EU directives and industrial automation. France and the UK are close behind, with 7.5% and 7.4% CAGRs respectively, fueled by smart infrastructure and emissions compliance.

Japan trails slightly at 7.3%, focusing on compact, efficient sensors under regulatory mandates. Overall, developed economies are showing consistent growth, with the USA and Germany standing out due to strong industrial bases and aggressive clean air policy implementation.

The report covers in-depth analysis of 40+ countries; five top-performing OECD countries are highlighted below.

USA VOC Sensors and Monitors Market Analysis

The VOC sensors and monitors revenue in the USA is projected to expand at a CAGR of 7.9% from 2025 to 2035. Growth is driven by stringent state-level regulations, especially in California, and strong demand from industrial sectors such as petrochemicals, manufacturing, and agriculture. High adoption of IoT-enabled monitoring systems and a well-established regulatory compliance infrastructure continue to enhance market penetration. Additionally, investments in smart buildings and indoor air quality improvements are accelerating the demand for advanced VOC sensors.

  • Strong regulatory enforcement through bodies like the EPA and CARB.
  • Wide industrial base with early adoption of smart monitoring systems.
  • Increasing integration of VOC sensors in building automation systems.

VOC Sensors and Monitors Sales Analysis in the UK

The demand for VOC sensors and monitors in the UK is forecasted to grow at a CAGR of 7.4% between 2025 and 2035. Growth is supported by ongoing environmental policy reforms and the country’s commitment to its net-zero emissions target by 2050. Industrial and urban monitoring needs are being addressed through smart infrastructure upgrades and air quality initiatives. Additionally, the integration of VOC sensors in public health and transportation projects supports consistent demand across commercial and government sectors.

  • Increased deployment in smart city and clean air initiatives.
  • Policy alignment with post-Brexit environmental standards.
  • Focus on air quality control in industrial zones and schools.

VOC Sensors and Monitors Sales Analysis in Germany

The VOC sensors and monitors sales in Germany are expected to register a CAGR of 7.7% from 2025 to 2035 in the VOC sensors and monitors market. Its leadership in automation, strong manufacturing ecosystem, and alignment with the EU’s Industrial Emissions Directive contribute significantly to sensor deployment. Demand is particularly high in sectors like chemicals, automotive, and green energy. Germany’s carbon-neutral roadmap for 2045 and industrial digitalization strategies further enhance opportunities for sensor integration across automated and smart factories.

  • Strong compliance with EU environmental directives.
  • Leadership in industrial automation and green technologies.
  • High demand in the chemical, automotive, and energy sectors.

VOC Sensors and Monitors Demand Analysis in France

The VOC sensors and monitors market in France is anticipated to grow at a CAGR of 7.5% between 2025 and 2035. France’s adherence to the EU Green Deal and national industrial emission regulations is pushing industries to adopt real-time air quality monitoring systems. High adoption in the automotive and chemical sectors, alongside public infrastructure upgrades, is reinforcing sensor demand. Efforts toward sustainable manufacturing and smart factory rollouts also support long-term growth.

  • Compliance-driven adoption across manufacturing and energy.
  • Increased investment in smart buildings and public spaces.
  • Growing R&D support for environmentally sustainable sensors.

VOC Sensors and Monitors Industry Analysis in Japan

The VOC sensors and monitor revenue in Japan is expected to witness a CAGR of 7.3% through the forecast period of 2025 to 2035. The country’s regulatory policies on air pollution and its focus on reducing industrial emissions are leading factors. However, cost sensitivity and space constraints in factories push demand toward compact, efficient, and cost-effective sensors. Despite slower IoT adoption rates, Japan is investing steadily in sustainable technologies and emission monitoring systems to meet its 2050 carbon neutrality goals.

  • Demand for compact and space-efficient sensor designs.
  • Regulatory support under the Air Pollution Control Law.
  • Slow but growing integration of smart monitoring systems.

Leading VOC Sensor and Monitor Suppliers

The VOC sensors and monitors market is moderately fragmented, with a mix of established players and emerging innovators. Leading companies such as Honeywell, Aeroqual, Extech, ams AG, and Figaro Engineering are actively competing through strategies focused on technological innovation, strategic partnerships, and expansion into emerging markets. These firms are leveraging advancements in sensor technology, integration with IoT platforms, and real-time data analytics to enhance product offerings and meet the growing demand for air quality monitoring solutions.

Top players are actively competing on technological innovation, pricing, and integration capabilities. IoT connectivity, miniaturization, and multi-sensor platforms are at the core of differentiation strategies. Firms are also leveraging strategic partnerships, acquisitions, and regional collaborations to strengthen their distribution networks and product portfolios.

Honeywell and Sensirion (via acquisition) are investing in high-accuracy, cloud-enabled VOC sensors, while others like Aeroqual are expanding in the government and environmental monitoring sectors. Focus is also shifting to eco-friendly designs, AI-enabled predictive analytics, and portable monitoring formats for emerging markets.

Recent VOC Sensors and Monitors Market News

  • In June 2025, Honeywell completed the acquisition of Sundyne, expanding its capabilities in the industry and enhancing its portfolio of safety and automation solutions.
  • In May 2025, Honeywell officially announced its new Hydrogen Leak Detector (HLD) solution, engineered specifically to identify microscopic hydrogen leaks in real time, enhancing safety in hydrogen-powered systems.

VOC Sensors and Monitors Market Report Scope

Report Attributes Details
Current Total Market Size (2025) USD 204.0 million
Projected Market Size (2035) USD 431.3 million
CAGR (2025 to 2035) 7.6%
Base Year for Estimation 2024
Historical Period 2020 to 2024
Projections Period 2025 to 2035
Market Analysis Parameters Revenue in USD million/Volume in units
By Device Type Sensors, Monitors
By Application Industrial Process Monitoring, Environmental Monitoring, Air Purification and Monitoring, Leak Detection
Regions Covered North America, Latin America, Europe, Middle East & Africa, Asia Pacific
Countries Covered United States, United Kingdom, Germany, France, Japan, China, South Korea, Australia, Brazil
Key Players Honeywell, Aeroqual , Extech , ams AG, Figaro Engineering, Nissha FIS, Inc , Winsen , Membrapor , Alphasense , ION Science
Additional Attributes Dollar sales by value, market share analysis by region, and country-wise analysis

Key Segmentation

By Device Type:

The industry is bifurcated divided into sensors and monitors.

By Application:

It is segmented into industrial process monitoring, environmental monitoring, air purification and monitoring, and leak detection.

By Region:

The market is studied across North America, Europe, Asia Pacific, The Middle East and Africa, and Latin America.

Table of Content

  1. Executive Summary
    • Global Market Outlook
    • Demand-side Trends
    • Supply-side Trends
    • Technology Roadmap Analysis
    • Analysis and Recommendations
  2. Market Overview
    • Market Coverage / Taxonomy
    • Market Definition / Scope / Limitations
  3. Market Background
    • Market Dynamics
      • Drivers
      • Restraints
      • Opportunity
      • Trends
    • Scenario Forecast
      • Demand in Optimistic Scenario
      • Demand in Likely Scenario
      • Demand in Conservative Scenario
    • Opportunity Map Analysis
    • Product Life Cycle Analysis
    • Supply Chain Analysis
      • Supply Side Participants and their Roles
        • Producers
        • Mid-Level Participants (Traders/ Agents/ Brokers)
        • Wholesalers and Distributors
      • Value Added and Value Created at Node in the Supply Chain
      • List of Raw Material Suppliers
      • List of Existing and Potential Buyer’s
    • Investment Feasibility Matrix
    • Value Chain Analysis
      • Profit Margin Analysis
      • Wholesalers and Distributors
      • Retailers
    • PESTLE and Porter’s Analysis
    • Regulatory Landscape
      • By Key Regions
      • By Key Countries
    • Regional Parent Market Outlook
    • Production and Consumption Statistics
    • Import and Export Statistics
  4. Global Market Analysis 2020 to 2024 and Forecast, 2025 to 2035
    • Historical Market Size Value (USD Million) & Volume (Units) Analysis, 2020 to 2024
    • Current and Future Market Size Value (USD Million) & Volume (Units) Projections, 2025 to 2035
      • Y-o-Y Growth Trend Analysis
      • Absolute $ Opportunity Analysis
  5. Global Market Pricing Analysis 2020 to 2024 and Forecast 2025 to 2035
  6. Global Market Analysis 2020 to 2024 and Forecast 2025 to 2035, By Device Type
    • Introduction / Key Findings
    • Historical Market Size Value (USD Million) & Volume (Units) Analysis By Device Type, 2020 to 2024
    • Current and Future Market Size Value (USD Million) & Volume (Units) Analysis and Forecast By Device Type, 2025 to 2035
      • Sensors
      • Monitors
    • Y-o-Y Growth Trend Analysis By Device Type, 2020 to 2024
    • Absolute $ Opportunity Analysis By Device Type, 2025 to 2035
  7. Global Market Analysis 2020 to 2024 and Forecast 2025 to 2035, By Application
    • Introduction / Key Findings
    • Historical Market Size Value (USD Million) & Volume (Units) Analysis By Application, 2020 to 2024
    • Current and Future Market Size Value (USD Million) & Volume (Units) Analysis and Forecast By Application, 2025 to 2035
      • Industrial Process Monitoring
      • Environmental Monitoring
      • Air Purification and Monitoring
      • Leak Detection
    • Y-o-Y Growth Trend Analysis By Application, 2020 to 2024
    • Absolute $ Opportunity Analysis By Application, 2025 to 2035
  8. Global Market Analysis 2020 to 2024 and Forecast 2025 to 2035, By Region
    • Introduction
    • Historical Market Size Value (USD Million) & Volume (Units) Analysis By Region, 2020 to 2024
    • Current Market Size Value (USD Million) & Volume (Units) Analysis and Forecast By Region, 2025 to 2035
      • North America
      • Latin America
      • Western Europe
      • Eastern Europe
      • East Asia
      • South Asia & Pacific
      • Middle East and Africa
    • Market Attractiveness Analysis By Region
  9. North America Market Analysis 2020 to 2024 and Forecast 2025 to 2035, By Country
    • Historical Market Size Value (USD Million) & Volume (Units) Trend Analysis By Market Taxonomy, 2020 to 2024
    • Market Size Value (USD Million) & Volume (Units) Forecast By Market Taxonomy, 2025 to 2035
      • By Country
        • USA
        • Canada
        • Mexico
      • By Device Type
      • By Application
    • Market Attractiveness Analysis
      • By Country
      • By Device Type
      • By Application
    • Key Takeaways
  10. Latin America Market Analysis 2020 to 2024 and Forecast 2025 to 2035, By Country
    • Historical Market Size Value (USD Million) & Volume (Units) Trend Analysis By Market Taxonomy, 2020 to 2024
    • Market Size Value (USD Million) & Volume (Units) Forecast By Market Taxonomy, 2025 to 2035
      • By Country
        • Brazil
        • Argentina
        • Rest of LATAM
      • By Device Type
      • By Application
    • Market Attractiveness Analysis
      • By Country
      • By Device Type
      • By Application
    • Key Takeaways
  11. Western Europe Market Analysis 2020 to 2024 and Forecast 2025 to 2035, By Country
    • Historical Market Size Value (USD Million) & Volume (Units) Trend Analysis By Market Taxonomy, 2020 to 2024
    • Market Size Value (USD Million) & Volume (Units) Forecast By Market Taxonomy, 2025 to 2035
      • By Country
        • Germany
        • Italy
        • France
        • UK
        • Spain
        • BENELUX
        • Nordic
        • Rest of W.Europe
      • By Device Type
      • By Application
    • Market Attractiveness Analysis
      • By Country
      • By Device Type
      • By Application
    • Key Takeaways
  12. Eastern Europe Market Analysis 2020 to 2024 and Forecast 2025 to 2035, By Country
    • Historical Market Size Value (USD Million) & Volume (Units) Trend Analysis By Market Taxonomy, 2020 to 2024
    • Market Size Value (USD Million) & Volume (Units) Forecast By Market Taxonomy, 2025 to 2035
      • By Country
        • Russia
        • Hungary
        • Poland
        • Balkan & Baltics
        • Rest of E. Europe
      • By Device Type
      • By Application
    • Market Attractiveness Analysis
      • By Country
      • By Device Type
      • By Application
    • Key Takeaways
  13. East Asia Market Analysis 2020 to 2024 and Forecast 2025 to 2035, By Country
    • Historical Market Size Value (USD Million) & Volume (Units) Trend Analysis By Market Taxonomy, 2020 to 2024
    • Market Size Value (USD Million) & Volume (Units) Forecast By Market Taxonomy, 2025 to 2035
      • By Country
        • China
        • Japan
        • South Korea
      • By Device Type
      • By Application
    • Market Attractiveness Analysis
      • By Country
      • By Device Type
      • By Application
    • Key Takeaways
  14. South Asia & Pacific Market Analysis 2020 to 2024 and Forecast 2025 to 2035, By Country
    • Historical Market Size Value (USD Million) & Volume (Units) Trend Analysis By Market Taxonomy, 2020 to 2024
    • Market Size Value (USD Million) & Volume (Units) Forecast By Market Taxonomy, 2025 to 2035
      • By Country
        • India
        • Australia & New Zealand
        • ASEAN
        • Rest of SAP
      • By Device Type
      • By Application
    • Market Attractiveness Analysis
      • By Country
      • By Device Type
      • By Application
    • Key Takeaways
  15. Middle East and Africa Market Analysis 2020 to 2024 and Forecast 2025 to 2035, By Country
    • Historical Market Size Value (USD Million) & Volume (Units) Trend Analysis By Market Taxonomy, 2020 to 2024
    • Market Size Value (USD Million) & Volume (Units) Forecast By Market Taxonomy, 2025 to 2035
      • By Country
        • GCC Countries
        • Northern Africa
        • South Africa
        • Turkiye
        • Rest of MEA
      • By Device Type
      • By Application
    • Market Attractiveness Analysis
      • By Country
      • By Device Type
      • By Application
    • Key Takeaways
  16. Key Countries Market Analysis
    • USA
      • Pricing Analysis
      • Market Share Analysis, 2024
        • By Device Type
        • By Application
    • Canada
      • Pricing Analysis
      • Market Share Analysis, 2024
        • By Device Type
        • By Application
    • Brazil
      • Pricing Analysis
      • Market Share Analysis, 2024
        • By Device Type
        • By Application
    • Mexico
      • Pricing Analysis
      • Market Share Analysis, 2024
        • By Device Type
        • By Application
    • Argentina
      • Pricing Analysis
      • Market Share Analysis, 2024
        • By Device Type
        • By Application
  17. Market Structure Analysis
    • Competition Dashboard
    • Competition Benchmarking
    • Market Share Analysis of Top Players
      • By Regional
      • By Device Type
      • By Application
  18. Competition Analysis
    • Competition Deep Dive
      • Honeywell
        • Overview
        • Product Portfolio
        • Profitability by Market Segments (Product/Age /Sales Channel/Region)
        • Sales Footprint
        • Strategy Overview
          • Marketing Strategy
          • Product Strategy
          • Channel Strategy
      • Aeroqual
        • Overview
        • Product Portfolio
        • Profitability by Market Segments (Product/Age /Sales Channel/Region)
        • Sales Footprint
        • Strategy Overview
          • Marketing Strategy
          • Product Strategy
          • Channel Strategy
      • Extech
        • Overview
        • Product Portfolio
        • Profitability by Market Segments (Product/Age /Sales Channel/Region)
        • Sales Footprint
        • Strategy Overview
          • Marketing Strategy
          • Product Strategy
          • Channel Strategy
      • ams AG
        • Overview
        • Product Portfolio
        • Profitability by Market Segments (Product/Age /Sales Channel/Region)
        • Sales Footprint
        • Strategy Overview
          • Marketing Strategy
          • Product Strategy
          • Channel Strategy
      • Figaro Engineering
        • Overview
        • Product Portfolio
        • Profitability by Market Segments (Product/Age /Sales Channel/Region)
        • Sales Footprint
        • Strategy Overview
          • Marketing Strategy
          • Product Strategy
          • Channel Strategy
      • Nissha FIS, Inc
        • Overview
        • Product Portfolio
        • Profitability by Market Segments (Product/Age /Sales Channel/Region)
        • Sales Footprint
        • Strategy Overview
          • Marketing Strategy
          • Product Strategy
          • Channel Strategy
      • Winsen
        • Overview
        • Product Portfolio
        • Profitability by Market Segments (Product/Age /Sales Channel/Region)
        • Sales Footprint
        • Strategy Overview
          • Marketing Strategy
          • Product Strategy
          • Channel Strategy
      • Membrapor
        • Overview
        • Product Portfolio
        • Profitability by Market Segments (Product/Age /Sales Channel/Region)
        • Sales Footprint
        • Strategy Overview
          • Marketing Strategy
          • Product Strategy
          • Channel Strategy
      • Alphasense
        • Overview
        • Product Portfolio
        • Profitability by Market Segments (Product/Age /Sales Channel/Region)
        • Sales Footprint
        • Strategy Overview
          • Marketing Strategy
          • Product Strategy
          • Channel Strategy
      • ION Science
        • Overview
        • Product Portfolio
        • Profitability by Market Segments (Product/Age /Sales Channel/Region)
        • Sales Footprint
        • Strategy Overview
          • Marketing Strategy
          • Product Strategy
          • Channel Strategy
  19. Assumptions & Acronyms Used
  20. Research Methodology

List of Tables

  • Table 1: Global Market Value (USD Million) Forecast by Region, 2020 to 2035
  • Table 2: Global Market Volume (Units) Forecast by Region, 2020 to 2035
  • Table 3: Global Market Value (USD Million) Forecast by Device Type, 2020 to 2035
  • Table 4: Global Market Volume (Units) Forecast by Device Type, 2020 to 2035
  • Table 5: Global Market Value (USD Million) Forecast by Application, 2020 to 2035
  • Table 6: Global Market Volume (Units) Forecast by Application, 2020 to 2035
  • Table 7: North America Market Value (USD Million) Forecast by Country, 2020 to 2035
  • Table 8: North America Market Volume (Units) Forecast by Country, 2020 to 2035
  • Table 9: North America Market Value (USD Million) Forecast by Device Type, 2020 to 2035
  • Table 10: North America Market Volume (Units) Forecast by Device Type, 2020 to 2035
  • Table 11: North America Market Value (USD Million) Forecast by Application, 2020 to 2035
  • Table 12: North America Market Volume (Units) Forecast by Application, 2020 to 2035
  • Table 13: Latin America Market Value (USD Million) Forecast by Country, 2020 to 2035
  • Table 14: Latin America Market Volume (Units) Forecast by Country, 2020 to 2035
  • Table 15: Latin America Market Value (USD Million) Forecast by Device Type, 2020 to 2035
  • Table 16: Latin America Market Volume (Units) Forecast by Device Type, 2020 to 2035
  • Table 17: Latin America Market Value (USD Million) Forecast by Application, 2020 to 2035
  • Table 18: Latin America Market Volume (Units) Forecast by Application, 2020 to 2035
  • Table 19: Western Europe Market Value (USD Million) Forecast by Country, 2020 to 2035
  • Table 20: Western Europe Market Volume (Units) Forecast by Country, 2020 to 2035
  • Table 21: Western Europe Market Value (USD Million) Forecast by Device Type, 2020 to 2035
  • Table 22: Western Europe Market Volume (Units) Forecast by Device Type, 2020 to 2035
  • Table 23: Western Europe Market Value (USD Million) Forecast by Application, 2020 to 2035
  • Table 24: Western Europe Market Volume (Units) Forecast by Application, 2020 to 2035
  • Table 25: Eastern Europe Market Value (USD Million) Forecast by Country, 2020 to 2035
  • Table 26: Eastern Europe Market Volume (Units) Forecast by Country, 2020 to 2035
  • Table 27: Eastern Europe Market Value (USD Million) Forecast by Device Type, 2020 to 2035
  • Table 28: Eastern Europe Market Volume (Units) Forecast by Device Type, 2020 to 2035
  • Table 29: Eastern Europe Market Value (USD Million) Forecast by Application, 2020 to 2035
  • Table 30: Eastern Europe Market Volume (Units) Forecast by Application, 2020 to 2035
  • Table 31: East Asia Market Value (USD Million) Forecast by Country, 2020 to 2035
  • Table 32: East Asia Market Volume (Units) Forecast by Country, 2020 to 2035
  • Table 33: East Asia Market Value (USD Million) Forecast by Device Type, 2020 to 2035
  • Table 34: East Asia Market Volume (Units) Forecast by Device Type, 2020 to 2035
  • Table 35: East Asia Market Value (USD Million) Forecast by Application, 2020 to 2035
  • Table 36: East Asia Market Volume (Units) Forecast by Application, 2020 to 2035
  • Table 37: South Asia & Pacific Market Value (USD Million) Forecast by Country, 2020 to 2035
  • Table 38: South Asia & Pacific Market Volume (Units) Forecast by Country, 2020 to 2035
  • Table 39: South Asia & Pacific Market Value (USD Million) Forecast by Device Type, 2020 to 2035
  • Table 40: South Asia & Pacific Market Volume (Units) Forecast by Device Type, 2020 to 2035
  • Table 41: South Asia & Pacific Market Value (USD Million) Forecast by Application, 2020 to 2035
  • Table 42: South Asia & Pacific Market Volume (Units) Forecast by Application, 2020 to 2035
  • Table 43: Middle East and Africa Market Value (USD Million) Forecast by Country, 2020 to 2035
  • Table 44: Middle East and Africa Market Volume (Units) Forecast by Country, 2020 to 2035
  • Table 45: Middle East and Africa Market Value (USD Million) Forecast by Device Type, 2020 to 2035
  • Table 46: Middle East and Africa Market Volume (Units) Forecast by Device Type, 2020 to 2035
  • Table 47: Middle East and Africa Market Value (USD Million) Forecast by Application, 2020 to 2035
  • Table 48: Middle East and Africa Market Volume (Units) Forecast by Application, 2020 to 2035

List of Figures

  • Figure 1: Global Market Volume (Units) Forecast 2020 to 2035
  • Figure 2: Global Market Pricing Analysis
  • Figure 3: Global Market Value (USD Million) Forecast 2020 to 2035
  • Figure 4: Global Market Value Share and BPS Analysis by Device Type, 2025 and 2035
  • Figure 5: Global Market Y-o-Y Growth Comparison by Device Type, 2025 to 2035
  • Figure 6: Global Market Attractiveness Analysis by Device Type
  • Figure 7: Global Market Value Share and BPS Analysis by Application, 2025 and 2035
  • Figure 8: Global Market Y-o-Y Growth Comparison by Application, 2025 to 2035
  • Figure 9: Global Market Attractiveness Analysis by Application
  • Figure 10: Global Market Value (USD Million) Share and BPS Analysis by Region, 2025 and 2035
  • Figure 11: Global Market Y-o-Y Growth Comparison by Region, 2025 to 2035
  • Figure 12: Global Market Attractiveness Analysis by Region
  • Figure 13: North America Market Incremental $ Opportunity, 2025 to 2035
  • Figure 14: Latin America Market Incremental $ Opportunity, 2025 to 2035
  • Figure 15: Western Europe Market Incremental $ Opportunity, 2025 to 2035
  • Figure 16: Eastern Europe Market Incremental $ Opportunity, 2025 to 2035
  • Figure 17: East Asia Market Incremental $ Opportunity, 2025 to 2035
  • Figure 18: South Asia & Pacific Market Incremental $ Opportunity, 2025 to 2035
  • Figure 19: Middle East and Africa Market Incremental $ Opportunity, 2025 to 2035
  • Figure 20: North America Market Value Share and BPS Analysis by Country, 2025 and 2035
  • Figure 21: North America Market Value Share and BPS Analysis by Device Type, 2025 and 2035
  • Figure 22: North America Market Y-o-Y Growth Comparison by Device Type, 2025 to 2035
  • Figure 23: North America Market Attractiveness Analysis by Device Type
  • Figure 24: North America Market Value Share and BPS Analysis by Application, 2025 and 2035
  • Figure 25: North America Market Y-o-Y Growth Comparison by Application, 2025 to 2035
  • Figure 26: North America Market Attractiveness Analysis by Application
  • Figure 27: Latin America Market Value Share and BPS Analysis by Country, 2025 and 2035
  • Figure 28: Latin America Market Value Share and BPS Analysis by Device Type, 2025 and 2035
  • Figure 29: Latin America Market Y-o-Y Growth Comparison by Device Type, 2025 to 2035
  • Figure 30: Latin America Market Attractiveness Analysis by Device Type
  • Figure 31: Latin America Market Value Share and BPS Analysis by Application, 2025 and 2035
  • Figure 32: Latin America Market Y-o-Y Growth Comparison by Application, 2025 to 2035
  • Figure 33: Latin America Market Attractiveness Analysis by Application
  • Figure 34: Western Europe Market Value Share and BPS Analysis by Country, 2025 and 2035
  • Figure 35: Western Europe Market Value Share and BPS Analysis by Device Type, 2025 and 2035
  • Figure 36: Western Europe Market Y-o-Y Growth Comparison by Device Type, 2025 to 2035
  • Figure 37: Western Europe Market Attractiveness Analysis by Device Type
  • Figure 38: Western Europe Market Value Share and BPS Analysis by Application, 2025 and 2035
  • Figure 39: Western Europe Market Y-o-Y Growth Comparison by Application, 2025 to 2035
  • Figure 40: Western Europe Market Attractiveness Analysis by Application
  • Figure 41: Eastern Europe Market Value Share and BPS Analysis by Country, 2025 and 2035
  • Figure 42: Eastern Europe Market Value Share and BPS Analysis by Device Type, 2025 and 2035
  • Figure 43: Eastern Europe Market Y-o-Y Growth Comparison by Device Type, 2025 to 2035
  • Figure 44: Eastern Europe Market Attractiveness Analysis by Device Type
  • Figure 45: Eastern Europe Market Value Share and BPS Analysis by Application, 2025 and 2035
  • Figure 46: Eastern Europe Market Y-o-Y Growth Comparison by Application, 2025 to 2035
  • Figure 47: Eastern Europe Market Attractiveness Analysis by Application
  • Figure 48: East Asia Market Value Share and BPS Analysis by Country, 2025 and 2035
  • Figure 49: East Asia Market Value Share and BPS Analysis by Device Type, 2025 and 2035
  • Figure 50: East Asia Market Y-o-Y Growth Comparison by Device Type, 2025 to 2035
  • Figure 51: East Asia Market Attractiveness Analysis by Device Type
  • Figure 52: East Asia Market Value Share and BPS Analysis by Application, 2025 and 2035
  • Figure 53: East Asia Market Y-o-Y Growth Comparison by Application, 2025 to 2035
  • Figure 54: East Asia Market Attractiveness Analysis by Application
  • Figure 55: South Asia & Pacific Market Value Share and BPS Analysis by Country, 2025 and 2035
  • Figure 56: South Asia & Pacific Market Value Share and BPS Analysis by Device Type, 2025 and 2035
  • Figure 57: South Asia & Pacific Market Y-o-Y Growth Comparison by Device Type, 2025 to 2035
  • Figure 58: South Asia & Pacific Market Attractiveness Analysis by Device Type
  • Figure 59: South Asia & Pacific Market Value Share and BPS Analysis by Application, 2025 and 2035
  • Figure 60: South Asia & Pacific Market Y-o-Y Growth Comparison by Application, 2025 to 2035
  • Figure 61: South Asia & Pacific Market Attractiveness Analysis by Application
  • Figure 62: Middle East and Africa Market Value Share and BPS Analysis by Country, 2025 and 2035
  • Figure 63: Middle East and Africa Market Value Share and BPS Analysis by Device Type, 2025 and 2035
  • Figure 64: Middle East and Africa Market Y-o-Y Growth Comparison by Device Type, 2025 to 2035
  • Figure 65: Middle East and Africa Market Attractiveness Analysis by Device Type
  • Figure 66: Middle East and Africa Market Value Share and BPS Analysis by Application, 2025 and 2035
  • Figure 67: Middle East and Africa Market Y-o-Y Growth Comparison by Application, 2025 to 2035
  • Figure 68: Middle East and Africa Market Attractiveness Analysis by Application
  • Figure 69: Global Market - Tier Structure Analysis
  • Figure 70: Global Market - Company Share Analysis

Frequently Asked Questions

What is the projected size of the VOC sensors and monitors market in 2025?

The market is valued at USD 204.0 million in 2025.

What is the outlook on the demand for VOC sensors and monitors by 2035?

The market is forecasted to reach USD 431.3 million by 2035, reflecting a CAGR of 7.6%.

Which device type leads the VOC sensors and monitors market in 2025?

Monitors are expected to lead the market with over 60% share in 2025.

What is the projected share of industrial process monitoring in the application segment by 2025?

Industrial process monitoring is expected to account for 42% of the market in 2025.

Which country is projected to have the fastest-growing VOC sensors and monitors market?

The USA is anticipated to be the fastest-growing market with a CAGR of 7.9% from 2025 to 2035.

Explore Similar Insights

Future Market Insights

VOC Sensors and Monitors Market