Reports

- Global Locations -

Headquarters

Future Market Insights, Inc.

Christiana Corporate, 200
Continental Drive, Suite 401,
Newark, Delaware - 19713,
United States

T: +1-845-579-5705

Americas

Future Market Insights, Inc.

616 Corporate Way, Suite 2-9018,
Valley Cottage, NY 10989, United States

T: +1-347-918-3531

MEA

Future Market Insights

1602-6 Jumeirah Bay X2 Tower, Plot No: JLT-PH2-X2A,
Jumeirah Lakes Towers, Dubai,
United Arab Emirates

Europe

Future Market Insights

3rd Floor, 207 Regent Street,
W1B 3HH London
United Kingdom

T: + 44 (0) 20 8123 9659
D: +44 (0) 20 3287 4268

Asia Pacific

Future Market Insights

IndiaLand Global Tech Park, Unit UG-1, Behind Grand HighStreet, Phase 1, Hinjawadi, MH, Pune – 411057, India

Avocado Oil Market Snapshot (2023 to 2033)

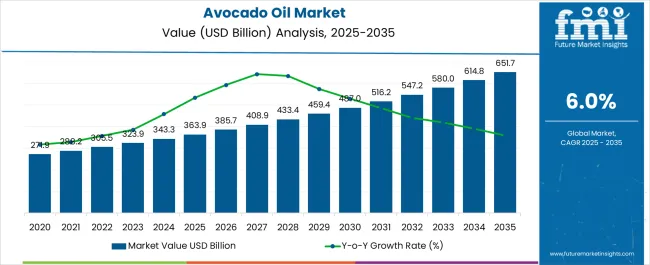
The avocado oil market held a market worth of US$ 287.2 million in 2022, and it is anticipated that it will reach a market value of US$ 975 million by 2033, growing at a CAGR of 5.9% from 2023 to 2033.

Some of the key findings in this report are:

  • Rising demand for sophisticated culinary experiences is pushing use of a variety of edible oils, including avocado oil.
  • Declining demand for fatty oils owing to potential health hazards is fostering popularity of healthy oils, thereby favoring avocado oil sales.
  • Hass variety will continue to be the top-selling variety of avocado oil
  • Among all other varieties, Hass stands out as a commonly-grown avocado type across the globe. Cold-pressed avocado oil extracted from the ‘Hass’ type is in high demand on account of its organoleptic properties.
  • Latin America continues to be the most lucrative region for avocado oil market, followed by North America
  • Avocado b-products are extremely popular across the key countries of Latin America, on account of their high levels of vitamin K and potassium. The Latin American avocado oil is likely to benefit from exponential demand from multiple industrial units, such as food & beverages and personal care.
  • Increasing preference for nutrition-rich diet and rapid transition toward healthy lifestyles complements avocado oil sales.
Report Attribute Details
Estimated Market Value (2022) US$ 287.2 million
Expected Market Value (2023) US$ 324.5 million
Projected Forecast Value (2033) US$ 975 million
Anticipated Growth Rate (2023 to 2033) 5.9%

The growth rates of the global market and its potential for future expansion are compared and evaluated by FMI every six months. Certain demographic and innovative elements of the market are dominant as a result of the subjective effects of macro- and industry-level variables.

The prevalence of lifestyle diseases including cardiovascular problems is rising globally. Study into it has advanced because of the advantages to health that come with consuming avocado oil. Avocado oil has several uses, including in cosmetics, medicine, and personal care products.

It has become extremely important in the medical sector due to several advantages, including weight loss, improved digestion, improved heart health, and being a high source of vitamin E. These elements are expected to favorably fuel the development of the global avocado oil market.

Don't pay for what you don't need

Customize your report by selecting specific countries or regions and save 30%!

Avocado Oil Market Historical Analysis (2018 to 2022) Vs. Forecast Outlook (2023 to 2033)

The global demand for avocado oil market is projected to increase at a CAGR of over 5% during the forecast period between 2023 and 2033, reaching a total of US$ 268.4 million in 2018, according to a report from Future Market Insights (FMI). From 2018 to 2022, sales witnessed significant growth in the global avocado oil market, registering a CAGR of 4.1%.

Scientists and medical professionals have been investigating various all-natural cures and treatments for these chronic illnesses, which has accelerated research on avocado oil because of the health advantages of its consumption, which in turn presents a lucrative opportunity for the market to expand in the years to come.

There has been a sizeable amount of avocado production that is either fed to cattle or wasted to rot. Avocados are largely unsuitable for export because of their short shelf life, but they do provide local farmers a sizable opportunity to turn them into high-value goods like avocado oil.

Some new developments that have taken place in these markets include:

  • With new packaging, the American company Jackson's Honest has added more snack options, including sweet potato chips. Three additional flavors-Spicy Tomatillo, Sea Salt, and Carolina BBQ-made with avocado oil have been added to the company's inventory in addition to the original Sea Salt with Coconut Oil chips.
  • The French company Laboratoires Expanscience introduced a new organic, emollient, and nourishing avocado fruit oil. It was made by cold pressing whole, previously dehydrated avocados.
  • The pasture-raised butter from Vital Farms, situated in Austin, Texas, comes with avocado oil and sea salt. The rich and creamy tub butter made from butter, sea salt, and 100% pure avocado oil is ideal for all types of cooking.

What is primarily driving the Global Market for Avocado Oil Market?

Positive Consumer Perceptions of Organic Products Favor Sales of Organic Avocado Oil

Positive consumer perceptions with respect to organic products are likely to provide an impetus to sales of organic avocado oil. Increasing consumer preference for healthy oils on account of the multiple benefits offered is one of the key reasons supporting demand for organic avocado oil.

Consumers who seek distinctive yet healthy culinary experiences are also willing to spend on organic avocado oil. This, according to FMI, is likely to a key factor driving demand for organic avocado oil worldwide.

Rising Demand for Clean Label Products to Underpin Avocado Oil Demand

The ever-increasing inclination toward clean-label products is estimated to underpin the growth of the avocado oil market during the forecast period. Consumers are becoming highly passionate than ever about clean label categories and are swiftly moving away from their traditional counterparts.

The trend of clean-label products across various fresh as well as packaged food products, including salad dressings, sweet goods, frozen pizzas, and others, is likely to offer new opportunities for key players in the avocado oil market.

Rising Fad for Plant-based Personal Care and Cosmetic Products to Drive Avocado Oil Sales

Consumer inclination towards the use of plant-based personal care products is on a significant rise. Increasing awareness about the potential side effects of harmful chemicals is one of the key sales influencers of plant-based products. Avocado oil stands out as a suitable ingredient for use in the preparation of personal care and cosmetic products, boosting the growth of the avocado oil market over the forecast period.

Avocado oil penetrates well into the skin and offers excellent healing properties, which is another key benefit fueling its demand in skin care products. Avocado oil is rich in monounsaturated fats & oleic acid, which makes it an ideal ingredient in hair care products. Such dermatological benefits are likely to sustain the demand for of avocado oil in the cosmetic & personal care space.

Nandini Roy Choudhury

Principal Consultant

Talk to Analyst

Find your sweet spots for generating winning opportunities in this market.

What Limits the Avocado Oil Market Expansion?

Alternatives are anticipated to impede market expansion

Alternatives to avocado fruit oil, like sunflower oil as well as olive oil, are widely available and less expensive, which is anticipated to limit market expansion. It is projected that the market would be badly impacted by the rising number of fake goods on supermarket shelves.

For example, the majority of the goods marketed in the United States are either of low quality, are mislabeled, or are contaminated with other oils, in accordance with data from researchers at the University of California (UC), Davis.

Category-wise Insights

Which Type Of Avocado Oil Is Most Popular across the Globe?

Extra-virgin Oil to Gain Prominence for its Benefits

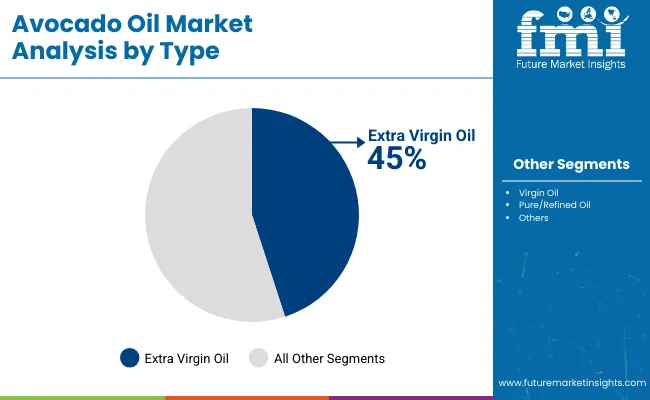
In 2023, the extra-virgin oil segment is anticipated to account for 44.5% of the worldwide avocado oil market. Extra-virgin avocado oil is a rich edible oil that is typically produced from the fruit of the avocado by cold pressing, without passing through any chemical or further processing. It has a delectable dark green hue and mild flavor.

Consumer interest in extra virgin oil is expanding significantly in the food sector due to the assurance of quality. The large amount of knowledge on the nutritional advantages of extra virgin avocado fruit oil is expected to fuel the segment's expansion.

Extra-virgin avocado oil is recognized as a high-quality oil with noticeable color, texture, and flavor, when compared to other culinary oils made from seeds. These advantages, together with its superior beauty and cosmetics quality, increase its global demand.

Which is the Leading Application Segment in the Avocado Oil Market?

The Food and Beverage Segment will hold a Prominent Share in the Market

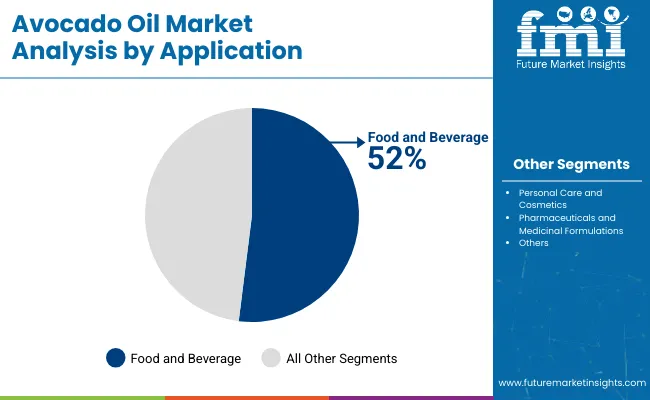
In 2022, the food and beverage acquired a 51.5% market share of the global market for avocado oil. The product's use in food and beverages is predicted to see the fastest CAGR growth over the next several years. The increasing consumer preference for specialty goods and the leading players' increased focus on using such components in processed food products are expected to sustain the segment's stable expansion.

For example, General Mills' keto-friendly brand just introduced yogurt, which contains 12 to 15 grams of protein each serving and is substantial in fat, low in carbohydrates and sugar. They add avocado fruit oil in their yogurt to raise the fat content. Usages of the avocado oil in various food products like these are anticipated to people the market growth to new heights during the forecast period.

Get the data you need at a Fraction of the cost

Personalize your report by choosing insights you need
and save 40%!

Comparative View of the Adjacent Markets

Avocado Oil Market:

Attributes Avocado Oil Market
CAGR (2023 to 2033) 5.9%
Market Value 2023 US$ 287.2 million
Growth Factor The high income growth rate in industrialized nations, along with the rapid pace of urbanization and the increase of the upper middle class, is the main driver behind the rising usage of avocado oil across multiple sectors.
Future Opportunities Manufacturers who utilize the product benefit from the reality that it is the most expensive oil used in the food and cosmetics industries since it distinguishes their goods as high-quality goods.
Market Trends Major businesses tend to use these specialized substances in their goods. It is one of the culinary ingredients that is expanding the quickest due to its nutritional value, variety, and health advantages.

Coconut Oil Market:

Attributes Coconut Oil Market
CAGR (2023 to 2033) 5.4%
Market Value 2023 US$ 3.6 billion
Growth Factor Coconut oil has developed into a true powerhouse component that is being utilized more frequently as a cooking oil as well as in commercial applications for the manufacturing of cosmetics, personal care products, and pharmaceuticals.
Future Opportunities Rising consumer expenditure on personal care items, cosmetics, and other items will continue to fuel the expansion of the coconut oil market throughout the projected period.
Market Trends The intake of coconut oil is encouraged in blogs, online videos, and articles on the grounds that this substance can offer a number of health advantages.

Olive Oil Market:

Attributes Olive Oil Market
CAGR (2023 to 2033) 2.9%
Market Value 2023 US$ 13.8 billion
Growth Factor The consistency and quality of olive oil have improved because to technological developments in manufacturing and delivery, making it more desirable to customers.
Future Opportunities India has the potential to develop into an attractive marketplace for olive oil manufacturers as the demand for the product rises and production rises.
Market Trends Olive oil is viewed as a healthier and less synthetic option to other oils by consumers who are increasingly looking for natural and organic products.

Region-wise Analysis

Which Region in North America is likely to be a Lucrative Market from 2023 to 2033?

The United States Market to Capture a Substantial Market share in 2023

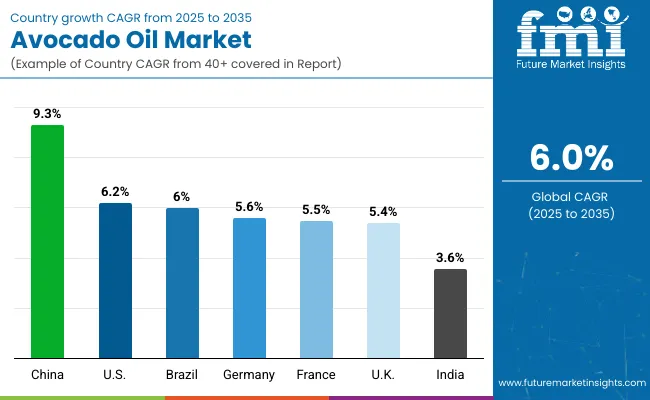
In 2022, the North American market for avocado oil acquired more than 30% of the global market share. The United States avocado oil market, on the other hand, held a 67.9% North American market share in 2022.

The dominance of the region is linked to rising customer interest in the good and its applications as a result of the product's technical and nutritional attributes. Avocado oil, which is used in food preparation, has certain demonstrated advantages due to its high oleic fatty acid concentration and vitamin E level. From this point forward, it is projected that increased interest in various dietary components, with a focus on fat, which has been linked to a number of ailments, including diabetes and overweight, would support the steady rise of the regional market.

La Tourangelle, Inc., Spectrum Organics Products, and Olivado USA are a few of the significant competitors active in the avocado oil industry in North America that are always concentrating on increasing their product offers.

Market Competition

Leading avocado oil producers are assiduously pursuing marketing strategies such new product developments, partnerships, technical advancements, R&D initiatives, investments, as well as acquisitions to increase their global exposure.

The key players in this market include:

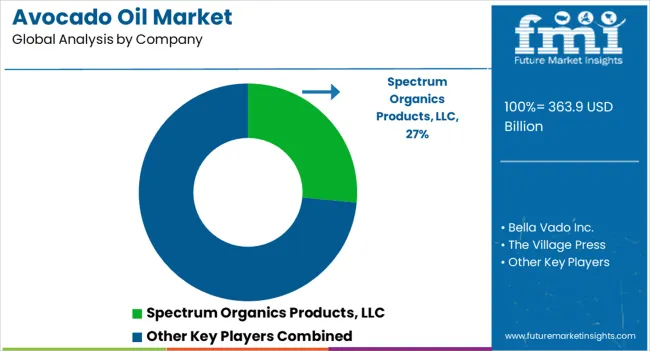
  • Spectrum Organics Products, LLC
  • Bella Vado Inc.
  • The Village Press
  • La Tourangelle, Inc.
  • Proteco Gold Pty Ltd.
  • Sesajal S.A de C.V.
  • Grupo Industrial Batellero
  • Grove Avocado Oil
  • Cibaria International
  • Olivado USA

Some of the products being launched by the key players are:

  • In 2018, Chosen Foods' processed avocado volume surpassed 300 million and a majority of them were used for avocado oil. The company recently unveiled a complete range of multi-flavored, non-GMO certified avocado oil sprays that are infused with spices and herbs. Chosen Foods has been investing heavily in promoting avocado oil cooking products as potential replacers for conventional oils used for snacks, condiments, and dressings.
  • Jackson's Honest, an American company, unveiled new packaging to their lineup of sweet potato chips in 2021. Three additional flavors-Sea Salt, Spicy Tomatillo, and Carolina BBQ-made with avocado oil have been added to the company's inventory in addition to the original Sea Salt with Coconut Oil chips.
  • The pasture-raised butter-flavored sea salt as well as avocado oil from Austin, Texas-based Vital Farms was released in 2021. The tasty and creamy tub butter made from sea salt, butter, and 100% pure avocado oil is ideal for all cooking tasks.
  • The 750 ml Marconi Avocado Fruit Oil was introduced in 2021 by the American business Catania Oils, which also offers private labeling services. The product is smaller than a prior iteration that was released.

Report Scope

Report Attribute Details
Growth Rate CAGR of 5.9% from 2022 to 2032
Market value in 2023 US$ 324.5 million
Market value in 2033 US$ 975 million
Base Year for Estimation 2022
Historical Data 2018 to 2022
Forecast Period 2023 to 2033
Quantitative Units US$ million for value
Report Coverage Revenue Forecast, Volume Forecast, Company Ranking, Competitive Landscape, Growth Factors, Trends, and Pricing Analysis
Segments Covered
  • Type
  • Application
  • Region
Regions Covered
  • North America
  • Latin America
  • Western Europe
  • Eastern Europe
  • South Asia and Pacific
  • East Asia
  • Middle East and Africa
Key Companies Profiled
  • Spectrum Organics Products, LLC
  • Bella Vado Inc.
  • The Village Press
  • La Tourangelle, Inc.
  • Proteco Gold Pty Ltd.
  • Sesajal S.A de C.V.
  • Grupo Industrial Batellero
  • Grove Avocado Oil
  • Cibaria International
  • Olivado USA
Customization & Pricing Available upon Request

Key Segments Profiled in the Avocado Oil Market

By Type:

  • Extra Virgin Oil
  • Virgin Oil
  • Pure/Refined Oil
  • Blend

By Application:

  • Food and Beverages
  • Pharmaceuticals and Medicinal Formulations
  • Personal Care and Cosmetics
  • Others

By Region:

  • North America
  • Latin America
  • Western Europe
  • Eastern Europe
  • South Asia and Pacific
  • East Asia,
  • Middle East and Africa

Frequently Asked Questions

How Big is the Avocado Oil Market in 2023?

The market is valued at US$ 324.5 million in 2023.

What Limits the Avocado Oil Market Expansion?

Alternatives are anticipated to impede market expansion.

What is the Expected Market Value for 2033?

By 2033, the market is likely to reach US$ 975 million.

What is the Growth Forecast for the Avocado Oil market?

The industry is expected to thrive at a CAGR of 5.9% through 2033.

What was the Market Share of North America?

The market share of North America was more than 30%.

Table of Content

1. Executive Summary

    1.1. Global Market Outlook

    1.2. Demand-side Trends

    1.3. Supply-side Trends

    1.4. Technology Roadmap Analysis

    1.5. Analysis and Recommendations

2. Market Overview

    2.1. Market Coverage / Taxonomy

    2.2. Market Definition / Scope / Limitations

3. Market Background

    3.1. Market Dynamics

        3.1.1. Drivers

        3.1.2. Restraints

        3.1.3. Opportunity

        3.1.4. Trends

    3.2. Scenario Forecast

        3.2.1. Demand in Optimistic Scenario

        3.2.2. Demand in Likely Scenario

        3.2.3. Demand in Conservative Scenario

    3.3. Opportunity Map Analysis

    3.4. Product Life Cycle Analysis

    3.5. Supply Chain Analysis

        3.5.1. Supply Side Participants and their Roles

            3.5.1.1. Producers

            3.5.1.2. Mid-Level Participants (Traders/ Agents/ Brokers)

            3.5.1.3. Wholesalers and Distributors

        3.5.2. Value Added and Value Created at Node in the Supply Chain

        3.5.3. List of Raw Material Suppliers

        3.5.4. List of Existing and Potential Buyer’s

    3.6. Investment Feasibility Matrix

    3.7. Value Chain Analysis

        3.7.1. Profit Margin Analysis

        3.7.2. Wholesalers and Distributors

        3.7.3. Retailers

    3.8. PESTLE and Porter’s Analysis

    3.9. Regulatory Landscape

        3.9.1. By Key Regions

        3.9.2. By Key Countries

    3.10. Regional Parent Market Outlook

    3.11. Production and Consumption Statistics

    3.12. Import and Export Statistics

4. Global Market Analysis 2018 to 2022 and Forecast, 2023 to 2033

    4.1. Historical Market Size Value (US$ Million) & Volume (MT) Analysis, 2018 to 2022

    4.2. Current and Future Market Size Value (US$ Million) & Volume (MT) Projections, 2023 to 2033

        4.2.1. Y-o-Y Growth Trend Analysis

        4.2.2. Absolute $ Opportunity Analysis

5. Global Market Analysis 2018 to 2022 and Forecast 2023 to 2033, By Type

    5.1. Introduction / Key Findings

    5.2. Historical Market Size Value (US$ Million) & Volume (MT) Analysis By Type, 2018 to 2022

    5.3. Current and Future Market Size Value (US$ Million) & Volume (MT) Analysis and Forecast By Type, 2023 to 2033

        5.3.1. Extra Virgin Oil

        5.3.2. Virgin Oil

        5.3.3. Pure/Refined Oil

        5.3.4. Blend

    5.4. Y-o-Y Growth Trend Analysis By Type, 2018 to 2022

    5.5. Absolute $ Opportunity Analysis By Type, 2023 to 2033

6. Global Market Analysis 2018 to 2022 and Forecast 2023 to 2033, By Application

    6.1. Introduction / Key Findings

    6.2. Historical Market Size Value (US$ Million) & Volume (MT) Analysis By Application, 2018 to 2022

    6.3. Current and Future Market Size Value (US$ Million) & Volume (MT) Analysis and Forecast By Application, 2023 to 2033

        6.3.1. Food and Beverages

        6.3.2. Pharmaceuticals and Medicinal Formulations

        6.3.3. Personal Care and Cosmetics

        6.3.4. Others

    6.4. Y-o-Y Growth Trend Analysis By Application, 2018 to 2022

    6.5. Absolute $ Opportunity Analysis By Application, 2023 to 2033

7. Global Market Analysis 2018 to 2022 and Forecast 2023 to 2033, By Region

    7.1. Introduction

    7.2. Historical Market Size Value (US$ Million) & Volume (MT) Analysis By Region, 2018 to 2022

    7.3. Current Market Size Value (US$ Million) & Volume (MT) Analysis and Forecast By Region, 2023 to 2033

        7.3.1. North America

        7.3.2. Latin America

        7.3.3. Western Europe

        7.3.4. Eastern Europe

        7.3.5. South Asia and Pacific

        7.3.6. East Asia

        7.3.7. Middle East and Africa

    7.4. Market Attractiveness Analysis By Region

8. North America Market Analysis 2018 to 2022 and Forecast 2023 to 2033, By Country

    8.1. Historical Market Size Value (US$ Million) & Volume (MT) Trend Analysis By Market Taxonomy, 2018 to 2022

    8.2. Market Size Value (US$ Million) & Volume (MT) Forecast By Market Taxonomy, 2023 to 2033

        8.2.1. By Country

            8.2.1.1. USA

            8.2.1.2. Canada

        8.2.2. By Type

        8.2.3. By Application

    8.3. Market Attractiveness Analysis

        8.3.1. By Country

        8.3.2. By Type

        8.3.3. By Application

    8.4. Key Takeaways

9. Latin America Market Analysis 2018 to 2022 and Forecast 2023 to 2033, By Country

    9.1. Historical Market Size Value (US$ Million) & Volume (MT) Trend Analysis By Market Taxonomy, 2018 to 2022

    9.2. Market Size Value (US$ Million) & Volume (MT) Forecast By Market Taxonomy, 2023 to 2033

        9.2.1. By Country

            9.2.1.1. Brazil

            9.2.1.2. Mexico

            9.2.1.3. Rest of Latin America

        9.2.2. By Type

        9.2.3. By Application

    9.3. Market Attractiveness Analysis

        9.3.1. By Country

        9.3.2. By Type

        9.3.3. By Application

    9.4. Key Takeaways

10. Western Europe Market Analysis 2018 to 2022 and Forecast 2023 to 2033, By Country

    10.1. Historical Market Size Value (US$ Million) & Volume (MT) Trend Analysis By Market Taxonomy, 2018 to 2022

    10.2. Market Size Value (US$ Million) & Volume (MT) Forecast By Market Taxonomy, 2023 to 2033

        10.2.1. By Country

            10.2.1.1. Germany

            10.2.1.2. UK

            10.2.1.3. France

            10.2.1.4. Spain

            10.2.1.5. Italy

            10.2.1.6. Rest of Western Europe

        10.2.2. By Type

        10.2.3. By Application

    10.3. Market Attractiveness Analysis

        10.3.1. By Country

        10.3.2. By Type

        10.3.3. By Application

    10.4. Key Takeaways

11. Eastern Europe Market Analysis 2018 to 2022 and Forecast 2023 to 2033, By Country

    11.1. Historical Market Size Value (US$ Million) & Volume (MT) Trend Analysis By Market Taxonomy, 2018 to 2022

    11.2. Market Size Value (US$ Million) & Volume (MT) Forecast By Market Taxonomy, 2023 to 2033

        11.2.1. By Country

            11.2.1.1. Poland

            11.2.1.2. Russia

            11.2.1.3. Czech Republic

            11.2.1.4. Romania

            11.2.1.5. Rest of Eastern Europe

        11.2.2. By Type

        11.2.3. By Application

    11.3. Market Attractiveness Analysis

        11.3.1. By Country

        11.3.2. By Type

        11.3.3. By Application

    11.4. Key Takeaways

12. South Asia and Pacific Market Analysis 2018 to 2022 and Forecast 2023 to 2033, By Country

    12.1. Historical Market Size Value (US$ Million) & Volume (MT) Trend Analysis By Market Taxonomy, 2018 to 2022

    12.2. Market Size Value (US$ Million) & Volume (MT) Forecast By Market Taxonomy, 2023 to 2033

        12.2.1. By Country

            12.2.1.1. India

            12.2.1.2. Bangladesh

            12.2.1.3. Australia

            12.2.1.4. New Zealand

            12.2.1.5. Rest of South Asia and Pacific

        12.2.2. By Type

        12.2.3. By Application

    12.3. Market Attractiveness Analysis

        12.3.1. By Country

        12.3.2. By Type

        12.3.3. By Application

    12.4. Key Takeaways

13. East Asia Market Analysis 2018 to 2022 and Forecast 2023 to 2033, By Country

    13.1. Historical Market Size Value (US$ Million) & Volume (MT) Trend Analysis By Market Taxonomy, 2018 to 2022

    13.2. Market Size Value (US$ Million) & Volume (MT) Forecast By Market Taxonomy, 2023 to 2033

        13.2.1. By Country

            13.2.1.1. China

            13.2.1.2. Japan

            13.2.1.3. South Korea

        13.2.2. By Type

        13.2.3. By Application

    13.3. Market Attractiveness Analysis

        13.3.1. By Country

        13.3.2. By Type

        13.3.3. By Application

    13.4. Key Takeaways

14. Middle East and Africa Market Analysis 2018 to 2022 and Forecast 2023 to 2033, By Country

    14.1. Historical Market Size Value (US$ Million) & Volume (MT) Trend Analysis By Market Taxonomy, 2018 to 2022

    14.2. Market Size Value (US$ Million) & Volume (MT) Forecast By Market Taxonomy, 2023 to 2033

        14.2.1. By Country

            14.2.1.1. GCC Countries

            14.2.1.2. South Africa

            14.2.1.3. Israel

            14.2.1.4. Rest of MEA

        14.2.2. By Type

        14.2.3. By Application

    14.3. Market Attractiveness Analysis

        14.3.1. By Country

        14.3.2. By Type

        14.3.3. By Application

    14.4. Key Takeaways

15. Key Countries Market Analysis

    15.1. USA

        15.1.1. Pricing Analysis

        15.1.2. Market Share Analysis, 2022

            15.1.2.1. By Type

            15.1.2.2. By Application

    15.2. Canada

        15.2.1. Pricing Analysis

        15.2.2. Market Share Analysis, 2022

            15.2.2.1. By Type

            15.2.2.2. By Application

    15.3. Brazil

        15.3.1. Pricing Analysis

        15.3.2. Market Share Analysis, 2022

            15.3.2.1. By Type

            15.3.2.2. By Application

    15.4. Mexico

        15.4.1. Pricing Analysis

        15.4.2. Market Share Analysis, 2022

            15.4.2.1. By Type

            15.4.2.2. By Application

    15.5. Germany

        15.5.1. Pricing Analysis

        15.5.2. Market Share Analysis, 2022

            15.5.2.1. By Type

            15.5.2.2. By Application

    15.6. UK

        15.6.1. Pricing Analysis

        15.6.2. Market Share Analysis, 2022

            15.6.2.1. By Type

            15.6.2.2. By Application

    15.7. France

        15.7.1. Pricing Analysis

        15.7.2. Market Share Analysis, 2022

            15.7.2.1. By Type

            15.7.2.2. By Application

    15.8. Spain

        15.8.1. Pricing Analysis

        15.8.2. Market Share Analysis, 2022

            15.8.2.1. By Type

            15.8.2.2. By Application

    15.9. Italy

        15.9.1. Pricing Analysis

        15.9.2. Market Share Analysis, 2022

            15.9.2.1. By Type

            15.9.2.2. By Application

    15.10. Poland

        15.10.1. Pricing Analysis

        15.10.2. Market Share Analysis, 2022

            15.10.2.1. By Type

            15.10.2.2. By Application

    15.11. Russia

        15.11.1. Pricing Analysis

        15.11.2. Market Share Analysis, 2022

            15.11.2.1. By Type

            15.11.2.2. By Application

    15.12. Czech Republic

        15.12.1. Pricing Analysis

        15.12.2. Market Share Analysis, 2022

            15.12.2.1. By Type

            15.12.2.2. By Application

    15.13. Romania

        15.13.1. Pricing Analysis

        15.13.2. Market Share Analysis, 2022

            15.13.2.1. By Type

            15.13.2.2. By Application

    15.14. India

        15.14.1. Pricing Analysis

        15.14.2. Market Share Analysis, 2022

            15.14.2.1. By Type

            15.14.2.2. By Application

    15.15. Bangladesh

        15.15.1. Pricing Analysis

        15.15.2. Market Share Analysis, 2022

            15.15.2.1. By Type

            15.15.2.2. By Application

    15.16. Australia

        15.16.1. Pricing Analysis

        15.16.2. Market Share Analysis, 2022

            15.16.2.1. By Type

            15.16.2.2. By Application

    15.17. New Zealand

        15.17.1. Pricing Analysis

        15.17.2. Market Share Analysis, 2022

            15.17.2.1. By Type

            15.17.2.2. By Application

    15.18. China

        15.18.1. Pricing Analysis

        15.18.2. Market Share Analysis, 2022

            15.18.2.1. By Type

            15.18.2.2. By Application

    15.19. Japan

        15.19.1. Pricing Analysis

        15.19.2. Market Share Analysis, 2022

            15.19.2.1. By Type

            15.19.2.2. By Application

    15.20. South Korea

        15.20.1. Pricing Analysis

        15.20.2. Market Share Analysis, 2022

            15.20.2.1. By Type

            15.20.2.2. By Application

    15.21. GCC Countries

        15.21.1. Pricing Analysis

        15.21.2. Market Share Analysis, 2022

            15.21.2.1. By Type

            15.21.2.2. By Application

    15.22. South Africa

        15.22.1. Pricing Analysis

        15.22.2. Market Share Analysis, 2022

            15.22.2.1. By Type

            15.22.2.2. By Application

    15.23. Israel

        15.23.1. Pricing Analysis

        15.23.2. Market Share Analysis, 2022

            15.23.2.1. By Type

            15.23.2.2. By Application

16. Market Structure Analysis

    16.1. Competition Dashboard

    16.2. Competition Benchmarking

    16.3. Market Share Analysis of Top Players

        16.3.1. By Regional

        16.3.2. By Type

        16.3.3. By Application

17. Competition Analysis

    17.1. Competition Deep Dive

        17.1.1. Spectrum Organics Products, LLC

            17.1.1.1. Overview

            17.1.1.2. Product Portfolio

            17.1.1.3. Profitability by Market Segments

            17.1.1.4. Sales Footprint

            17.1.1.5. Strategy Overview

                17.1.1.5.1. Marketing Strategy

                17.1.1.5.2. Product Strategy

                17.1.1.5.3. Channel Strategy

        17.1.2. Bella Vado Inc.

            17.1.2.1. Overview

            17.1.2.2. Product Portfolio

            17.1.2.3. Profitability by Market Segments

            17.1.2.4. Sales Footprint

            17.1.2.5. Strategy Overview

                17.1.2.5.1. Marketing Strategy

                17.1.2.5.2. Product Strategy

                17.1.2.5.3. Channel Strategy

        17.1.3. The Village Press

            17.1.3.1. Overview

            17.1.3.2. Product Portfolio

            17.1.3.3. Profitability by Market Segments

            17.1.3.4. Sales Footprint

            17.1.3.5. Strategy Overview

                17.1.3.5.1. Marketing Strategy

                17.1.3.5.2. Product Strategy

                17.1.3.5.3. Channel Strategy

        17.1.4. La Tourangelle, Inc.

            17.1.4.1. Overview

            17.1.4.2. Product Portfolio

            17.1.4.3. Profitability by Market Segments

            17.1.4.4. Sales Footprint

            17.1.4.5. Strategy Overview

                17.1.4.5.1. Marketing Strategy

                17.1.4.5.2. Product Strategy

                17.1.4.5.3. Channel Strategy

        17.1.5. Proteco Gold Pty Ltd.

            17.1.5.1. Overview

            17.1.5.2. Product Portfolio

            17.1.5.3. Profitability by Market Segments

            17.1.5.4. Sales Footprint

            17.1.5.5. Strategy Overview

                17.1.5.5.1. Marketing Strategy

                17.1.5.5.2. Product Strategy

                17.1.5.5.3. Channel Strategy

        17.1.6. Sesajal S.A de C.V.

            17.1.6.1. Overview

            17.1.6.2. Product Portfolio

            17.1.6.3. Profitability by Market Segments

            17.1.6.4. Sales Footprint

            17.1.6.5. Strategy Overview

                17.1.6.5.1. Marketing Strategy

                17.1.6.5.2. Product Strategy

                17.1.6.5.3. Channel Strategy

        17.1.7. Grupo Industrial Batellero

            17.1.7.1. Overview

            17.1.7.2. Product Portfolio

            17.1.7.3. Profitability by Market Segments

            17.1.7.4. Sales Footprint

            17.1.7.5. Strategy Overview

                17.1.7.5.1. Marketing Strategy

                17.1.7.5.2. Product Strategy

                17.1.7.5.3. Channel Strategy

        17.1.8. Grove

            17.1.8.1. Overview

            17.1.8.2. Product Portfolio

            17.1.8.3. Profitability by Market Segments

            17.1.8.4. Sales Footprint

            17.1.8.5. Strategy Overview

                17.1.8.5.1. Marketing Strategy

                17.1.8.5.2. Product Strategy

                17.1.8.5.3. Channel Strategy

        17.1.9. Cibaria International

            17.1.9.1. Overview

            17.1.9.2. Product Portfolio

            17.1.9.3. Profitability by Market Segments

            17.1.9.4. Sales Footprint

            17.1.9.5. Strategy Overview

                17.1.9.5.1. Marketing Strategy

                17.1.9.5.2. Product Strategy

                17.1.9.5.3. Channel Strategy

        17.1.10. Olivado USA

            17.1.10.1. Overview

            17.1.10.2. Product Portfolio

            17.1.10.3. Profitability by Market Segments

            17.1.10.4. Sales Footprint

            17.1.10.5. Strategy Overview

                17.1.10.5.1. Marketing Strategy

                17.1.10.5.2. Product Strategy

                17.1.10.5.3. Channel Strategy

18. Assumptions & Acronyms Used

19. Research Methodology

Don't pay for what you don't need

Customize your report by selecting specific countries or regions and save 30%!

List of Tables

Table 1: Global Market Value (US$ Million) Forecast by Region, 2018 to 2033

Table 2: Global Market Volume (MT) Forecast by Region, 2018 to 2033

Table 3: Global Market Value (US$ Million) Forecast by Type, 2018 to 2033

Table 4: Global Market Volume (MT) Forecast by Type, 2018 to 2033

Table 5: Global Market Value (US$ Million) Forecast by Application, 2018 to 2033

Table 6: Global Market Volume (MT) Forecast by Application, 2018 to 2033

Table 7: North America Market Value (US$ Million) Forecast by Country, 2018 to 2033

Table 8: North America Market Volume (MT) Forecast by Country, 2018 to 2033

Table 9: North America Market Value (US$ Million) Forecast by Type, 2018 to 2033

Table 10: North America Market Volume (MT) Forecast by Type, 2018 to 2033

Table 11: North America Market Value (US$ Million) Forecast by Application, 2018 to 2033

Table 12: North America Market Volume (MT) Forecast by Application, 2018 to 2033

Table 13: Latin America Market Value (US$ Million) Forecast by Country, 2018 to 2033

Table 14: Latin America Market Volume (MT) Forecast by Country, 2018 to 2033

Table 15: Latin America Market Value (US$ Million) Forecast by Type, 2018 to 2033

Table 16: Latin America Market Volume (MT) Forecast by Type, 2018 to 2033

Table 17: Latin America Market Value (US$ Million) Forecast by Application, 2018 to 2033

Table 18: Latin America Market Volume (MT) Forecast by Application, 2018 to 2033

Table 19: Western Europe Market Value (US$ Million) Forecast by Country, 2018 to 2033

Table 20: Western Europe Market Volume (MT) Forecast by Country, 2018 to 2033

Table 21: Western Europe Market Value (US$ Million) Forecast by Type, 2018 to 2033

Table 22: Western Europe Market Volume (MT) Forecast by Type, 2018 to 2033

Table 23: Western Europe Market Value (US$ Million) Forecast by Application, 2018 to 2033

Table 24: Western Europe Market Volume (MT) Forecast by Application, 2018 to 2033

Table 25: Eastern Europe Market Value (US$ Million) Forecast by Country, 2018 to 2033

Table 26: Eastern Europe Market Volume (MT) Forecast by Country, 2018 to 2033

Table 27: Eastern Europe Market Value (US$ Million) Forecast by Type, 2018 to 2033

Table 28: Eastern Europe Market Volume (MT) Forecast by Type, 2018 to 2033

Table 29: Eastern Europe Market Value (US$ Million) Forecast by Application, 2018 to 2033

Table 30: Eastern Europe Market Volume (MT) Forecast by Application, 2018 to 2033

Table 31: South Asia and Pacific Market Value (US$ Million) Forecast by Country, 2018 to 2033

Table 32: South Asia and Pacific Market Volume (MT) Forecast by Country, 2018 to 2033

Table 33: South Asia and Pacific Market Value (US$ Million) Forecast by Type, 2018 to 2033

Table 34: South Asia and Pacific Market Volume (MT) Forecast by Type, 2018 to 2033

Table 35: South Asia and Pacific Market Value (US$ Million) Forecast by Application, 2018 to 2033

Table 36: South Asia and Pacific Market Volume (MT) Forecast by Application, 2018 to 2033

Table 37: East Asia Market Value (US$ Million) Forecast by Country, 2018 to 2033

Table 38: East Asia Market Volume (MT) Forecast by Country, 2018 to 2033

Table 39: East Asia Market Value (US$ Million) Forecast by Type, 2018 to 2033

Table 40: East Asia Market Volume (MT) Forecast by Type, 2018 to 2033

Table 41: East Asia Market Value (US$ Million) Forecast by Application, 2018 to 2033

Table 42: East Asia Market Volume (MT) Forecast by Application, 2018 to 2033

Table 43: Middle East and Africa Market Value (US$ Million) Forecast by Country, 2018 to 2033

Table 44: Middle East and Africa Market Volume (MT) Forecast by Country, 2018 to 2033

Table 45: Middle East and Africa Market Value (US$ Million) Forecast by Type, 2018 to 2033

Table 46: Middle East and Africa Market Volume (MT) Forecast by Type, 2018 to 2033

Table 47: Middle East and Africa Market Value (US$ Million) Forecast by Application, 2018 to 2033

Table 48: Middle East and Africa Market Volume (MT) Forecast by Application, 2018 to 2033
Nandini Roy Choudhury

Principal Consultant

Talk to Analyst

Find your sweet spots for generating winning opportunities in this market.

List of Charts

Figure 1: Global Market Value (US$ Million) by Type, 2023 to 2033

Figure 2: Global Market Value (US$ Million) by Application, 2023 to 2033

Figure 3: Global Market Value (US$ Million) by Region, 2023 to 2033

Figure 4: Global Market Value (US$ Million) Analysis by Region, 2018 to 2033

Figure 5: Global Market Volume (MT) Analysis by Region, 2018 to 2033

Figure 6: Global Market Value Share (%) and BPS Analysis by Region, 2023 to 2033

Figure 7: Global Market Y-o-Y Growth (%) Projections by Region, 2023 to 2033

Figure 8: Global Market Value (US$ Million) Analysis by Type, 2018 to 2033

Figure 9: Global Market Volume (MT) Analysis by Type, 2018 to 2033

Figure 10: Global Market Value Share (%) and BPS Analysis by Type, 2023 to 2033

Figure 11: Global Market Y-o-Y Growth (%) Projections by Type, 2023 to 2033

Figure 12: Global Market Value (US$ Million) Analysis by Application, 2018 to 2033

Figure 13: Global Market Volume (MT) Analysis by Application, 2018 to 2033

Figure 14: Global Market Value Share (%) and BPS Analysis by Application, 2023 to 2033

Figure 15: Global Market Y-o-Y Growth (%) Projections by Application, 2023 to 2033

Figure 16: Global Market Attractiveness by Type, 2023 to 2033

Figure 17: Global Market Attractiveness by Application, 2023 to 2033

Figure 18: Global Market Attractiveness by Region, 2023 to 2033

Figure 19: North America Market Value (US$ Million) by Type, 2023 to 2033

Figure 20: North America Market Value (US$ Million) by Application, 2023 to 2033

Figure 21: North America Market Value (US$ Million) by Country, 2023 to 2033

Figure 22: North America Market Value (US$ Million) Analysis by Country, 2018 to 2033

Figure 23: North America Market Volume (MT) Analysis by Country, 2018 to 2033

Figure 24: North America Market Value Share (%) and BPS Analysis by Country, 2023 to 2033

Figure 25: North America Market Y-o-Y Growth (%) Projections by Country, 2023 to 2033

Figure 26: North America Market Value (US$ Million) Analysis by Type, 2018 to 2033

Figure 27: North America Market Volume (MT) Analysis by Type, 2018 to 2033

Figure 28: North America Market Value Share (%) and BPS Analysis by Type, 2023 to 2033

Figure 29: North America Market Y-o-Y Growth (%) Projections by Type, 2023 to 2033

Figure 30: North America Market Value (US$ Million) Analysis by Application, 2018 to 2033

Figure 31: North America Market Volume (MT) Analysis by Application, 2018 to 2033

Figure 32: North America Market Value Share (%) and BPS Analysis by Application, 2023 to 2033

Figure 33: North America Market Y-o-Y Growth (%) Projections by Application, 2023 to 2033

Figure 34: North America Market Attractiveness by Type, 2023 to 2033

Figure 35: North America Market Attractiveness by Application, 2023 to 2033

Figure 36: North America Market Attractiveness by Country, 2023 to 2033

Figure 37: Latin America Market Value (US$ Million) by Type, 2023 to 2033

Figure 38: Latin America Market Value (US$ Million) by Application, 2023 to 2033

Figure 39: Latin America Market Value (US$ Million) by Country, 2023 to 2033

Figure 40: Latin America Market Value (US$ Million) Analysis by Country, 2018 to 2033

Figure 41: Latin America Market Volume (MT) Analysis by Country, 2018 to 2033

Figure 42: Latin America Market Value Share (%) and BPS Analysis by Country, 2023 to 2033

Figure 43: Latin America Market Y-o-Y Growth (%) Projections by Country, 2023 to 2033

Figure 44: Latin America Market Value (US$ Million) Analysis by Type, 2018 to 2033

Figure 45: Latin America Market Volume (MT) Analysis by Type, 2018 to 2033

Figure 46: Latin America Market Value Share (%) and BPS Analysis by Type, 2023 to 2033

Figure 47: Latin America Market Y-o-Y Growth (%) Projections by Type, 2023 to 2033

Figure 48: Latin America Market Value (US$ Million) Analysis by Application, 2018 to 2033

Figure 49: Latin America Market Volume (MT) Analysis by Application, 2018 to 2033

Figure 50: Latin America Market Value Share (%) and BPS Analysis by Application, 2023 to 2033

Figure 51: Latin America Market Y-o-Y Growth (%) Projections by Application, 2023 to 2033

Figure 52: Latin America Market Attractiveness by Type, 2023 to 2033

Figure 53: Latin America Market Attractiveness by Application, 2023 to 2033

Figure 54: Latin America Market Attractiveness by Country, 2023 to 2033

Figure 55: Western Europe Market Value (US$ Million) by Type, 2023 to 2033

Figure 56: Western Europe Market Value (US$ Million) by Application, 2023 to 2033

Figure 57: Western Europe Market Value (US$ Million) by Country, 2023 to 2033

Figure 58: Western Europe Market Value (US$ Million) Analysis by Country, 2018 to 2033

Figure 59: Western Europe Market Volume (MT) Analysis by Country, 2018 to 2033

Figure 60: Western Europe Market Value Share (%) and BPS Analysis by Country, 2023 to 2033

Figure 61: Western Europe Market Y-o-Y Growth (%) Projections by Country, 2023 to 2033

Figure 62: Western Europe Market Value (US$ Million) Analysis by Type, 2018 to 2033

Figure 63: Western Europe Market Volume (MT) Analysis by Type, 2018 to 2033

Figure 64: Western Europe Market Value Share (%) and BPS Analysis by Type, 2023 to 2033

Figure 65: Western Europe Market Y-o-Y Growth (%) Projections by Type, 2023 to 2033

Figure 66: Western Europe Market Value (US$ Million) Analysis by Application, 2018 to 2033

Figure 67: Western Europe Market Volume (MT) Analysis by Application, 2018 to 2033

Figure 68: Western Europe Market Value Share (%) and BPS Analysis by Application, 2023 to 2033

Figure 69: Western Europe Market Y-o-Y Growth (%) Projections by Application, 2023 to 2033

Figure 70: Western Europe Market Attractiveness by Type, 2023 to 2033

Figure 71: Western Europe Market Attractiveness by Application, 2023 to 2033

Figure 72: Western Europe Market Attractiveness by Country, 2023 to 2033

Figure 73: Eastern Europe Market Value (US$ Million) by Type, 2023 to 2033

Figure 74: Eastern Europe Market Value (US$ Million) by Application, 2023 to 2033

Figure 75: Eastern Europe Market Value (US$ Million) by Country, 2023 to 2033

Figure 76: Eastern Europe Market Value (US$ Million) Analysis by Country, 2018 to 2033

Figure 77: Eastern Europe Market Volume (MT) Analysis by Country, 2018 to 2033

Figure 78: Eastern Europe Market Value Share (%) and BPS Analysis by Country, 2023 to 2033

Figure 79: Eastern Europe Market Y-o-Y Growth (%) Projections by Country, 2023 to 2033

Figure 80: Eastern Europe Market Value (US$ Million) Analysis by Type, 2018 to 2033

Figure 81: Eastern Europe Market Volume (MT) Analysis by Type, 2018 to 2033

Figure 82: Eastern Europe Market Value Share (%) and BPS Analysis by Type, 2023 to 2033

Figure 83: Eastern Europe Market Y-o-Y Growth (%) Projections by Type, 2023 to 2033

Figure 84: Eastern Europe Market Value (US$ Million) Analysis by Application, 2018 to 2033

Figure 85: Eastern Europe Market Volume (MT) Analysis by Application, 2018 to 2033

Figure 86: Eastern Europe Market Value Share (%) and BPS Analysis by Application, 2023 to 2033

Figure 87: Eastern Europe Market Y-o-Y Growth (%) Projections by Application, 2023 to 2033

Figure 88: Eastern Europe Market Attractiveness by Type, 2023 to 2033

Figure 89: Eastern Europe Market Attractiveness by Application, 2023 to 2033

Figure 90: Eastern Europe Market Attractiveness by Country, 2023 to 2033

Figure 91: South Asia and Pacific Market Value (US$ Million) by Type, 2023 to 2033

Figure 92: South Asia and Pacific Market Value (US$ Million) by Application, 2023 to 2033

Figure 93: South Asia and Pacific Market Value (US$ Million) by Country, 2023 to 2033

Figure 94: South Asia and Pacific Market Value (US$ Million) Analysis by Country, 2018 to 2033

Figure 95: South Asia and Pacific Market Volume (MT) Analysis by Country, 2018 to 2033

Figure 96: South Asia and Pacific Market Value Share (%) and BPS Analysis by Country, 2023 to 2033

Figure 97: South Asia and Pacific Market Y-o-Y Growth (%) Projections by Country, 2023 to 2033

Figure 98: South Asia and Pacific Market Value (US$ Million) Analysis by Type, 2018 to 2033

Figure 99: South Asia and Pacific Market Volume (MT) Analysis by Type, 2018 to 2033

Figure 100: South Asia and Pacific Market Value Share (%) and BPS Analysis by Type, 2023 to 2033

Figure 101: South Asia and Pacific Market Y-o-Y Growth (%) Projections by Type, 2023 to 2033

Figure 102: South Asia and Pacific Market Value (US$ Million) Analysis by Application, 2018 to 2033

Figure 103: South Asia and Pacific Market Volume (MT) Analysis by Application, 2018 to 2033

Figure 104: South Asia and Pacific Market Value Share (%) and BPS Analysis by Application, 2023 to 2033

Figure 105: South Asia and Pacific Market Y-o-Y Growth (%) Projections by Application, 2023 to 2033

Figure 106: South Asia and Pacific Market Attractiveness by Type, 2023 to 2033

Figure 107: South Asia and Pacific Market Attractiveness by Application, 2023 to 2033

Figure 108: South Asia and Pacific Market Attractiveness by Country, 2023 to 2033

Figure 109: East Asia Market Value (US$ Million) by Type, 2023 to 2033

Figure 110: East Asia Market Value (US$ Million) by Application, 2023 to 2033

Figure 111: East Asia Market Value (US$ Million) by Country, 2023 to 2033

Figure 112: East Asia Market Value (US$ Million) Analysis by Country, 2018 to 2033

Figure 113: East Asia Market Volume (MT) Analysis by Country, 2018 to 2033

Figure 114: East Asia Market Value Share (%) and BPS Analysis by Country, 2023 to 2033

Figure 115: East Asia Market Y-o-Y Growth (%) Projections by Country, 2023 to 2033

Figure 116: East Asia Market Value (US$ Million) Analysis by Type, 2018 to 2033

Figure 117: East Asia Market Volume (MT) Analysis by Type, 2018 to 2033

Figure 118: East Asia Market Value Share (%) and BPS Analysis by Type, 2023 to 2033

Figure 119: East Asia Market Y-o-Y Growth (%) Projections by Type, 2023 to 2033

Figure 120: East Asia Market Value (US$ Million) Analysis by Application, 2018 to 2033

Figure 121: East Asia Market Volume (MT) Analysis by Application, 2018 to 2033

Figure 122: East Asia Market Value Share (%) and BPS Analysis by Application, 2023 to 2033

Figure 123: East Asia Market Y-o-Y Growth (%) Projections by Application, 2023 to 2033

Figure 124: East Asia Market Attractiveness by Type, 2023 to 2033

Figure 125: East Asia Market Attractiveness by Application, 2023 to 2033

Figure 126: East Asia Market Attractiveness by Country, 2023 to 2033

Figure 127: Middle East and Africa Market Value (US$ Million) by Type, 2023 to 2033

Figure 128: Middle East and Africa Market Value (US$ Million) by Application, 2023 to 2033

Figure 129: Middle East and Africa Market Value (US$ Million) by Country, 2023 to 2033

Figure 130: Middle East and Africa Market Value (US$ Million) Analysis by Country, 2018 to 2033

Figure 131: Middle East and Africa Market Volume (MT) Analysis by Country, 2018 to 2033

Figure 132: Middle East and Africa Market Value Share (%) and BPS Analysis by Country, 2023 to 2033

Figure 133: Middle East and Africa Market Y-o-Y Growth (%) Projections by Country, 2023 to 2033

Figure 134: Middle East and Africa Market Value (US$ Million) Analysis by Type, 2018 to 2033

Figure 135: Middle East and Africa Market Volume (MT) Analysis by Type, 2018 to 2033

Figure 136: Middle East and Africa Market Value Share (%) and BPS Analysis by Type, 2023 to 2033

Figure 137: Middle East and Africa Market Y-o-Y Growth (%) Projections by Type, 2023 to 2033

Figure 138: Middle East and Africa Market Value (US$ Million) Analysis by Application, 2018 to 2033

Figure 139: Middle East and Africa Market Volume (MT) Analysis by Application, 2018 to 2033

Figure 140: Middle East and Africa Market Value Share (%) and BPS Analysis by Application, 2023 to 2033

Figure 141: Middle East and Africa Market Y-o-Y Growth (%) Projections by Application, 2023 to 2033

Figure 142: Middle East and Africa Market Attractiveness by Type, 2023 to 2033

Figure 143: Middle East and Africa Market Attractiveness by Application, 2023 to 2033

Figure 144: Middle East and Africa Market Attractiveness by Country, 2023 to 2033

Recommendations

Food and Beverage

Coconut Flour Market

Published : October 2023

Food and Beverage

Coconut Milk Market

Published : October 2023

Food and Beverage

Coconut Oil Market

Published : September 2023

Food and Beverage

Olive Oil Market

Published : February 2023

Explore Food and Beverage Insights

View Reports