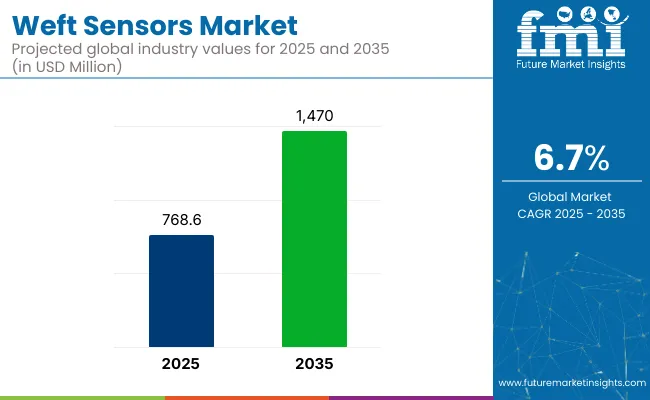
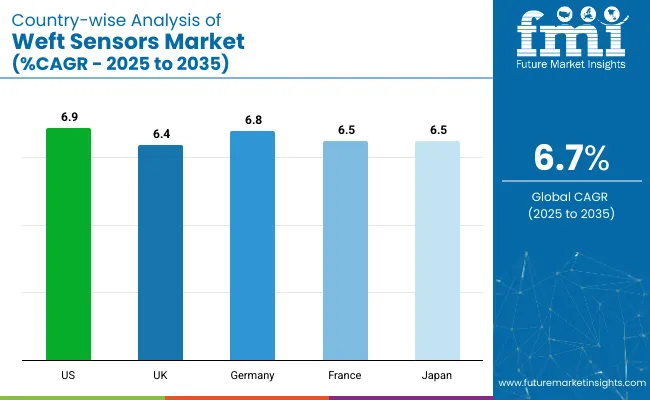
The global weft sensors market is expected to grow steadily at a 6.7% CAGR from 2025 to 2035. The industry is set to reach USD 768.6 million in 2025, continuing on its growth trend. By 2035, the industry will expand to about USD 1.47 billion, fueled by increasing demand for automation in textile production and advancements in smart weaving technologies. This expansion will be driven by the growing uptake of Industry solutions, which combine IoT-enabled sensors to improve fabric production efficiency.
In 2024, the Weft Sensor landscape experienced significant advancements due to the increasing implementation of smart textile production solutions. Some major textile machinery makers added AI-driven weft sensors in automated looms, further boosting real-time monitoring of fabric and reducing weaving flaws. Demand for IoT-connected weft sensors surged in India, China, and Bangladesh as textile manufacturers sought greater efficiency and precise weaving.
The need for accurate weft weaving and real-time monitoring in textile mills will drive the adoption of weft sensors, especially in Asia-Pacific and Europe with robust textile industries. With manufacturers looking for more operational efficiency, smart sensors with analytics based on artificial intelligence are likely to become the norm. With automation and sustainability driving industry advancements, the weft sensor market will play a pivotal role in the next era of textile manufacturing.
The Weft Sensor sector is on a strong growth path as textile manufacturing grows more automated, with the usage of AI-enabled weaving technologies gaining popularity and a greater emphasis being placed on enhanced efficiency and fewer defects.
Textile manufacturers in Asia-Pacific and Europe will benefit from higher productivity and cost efficiencies, while conventional makers based on less advanced weaving practices risk becoming non-competitive. As IoT-enabled and AI-powered weft sensors become the norm, businesses that invest in intelligent textile solutions will dominate the industry, defining the future of precision weaving.
Invest in Smart Weaving Technologies
Executives must focus on AI-driven weft sensors and IoT-based monitoring systems to improve textile manufacturing efficiency, minimize defects, and optimize real-time fabric quality control.
Align with Industry 4.0 & Sustainability Trends
Firms need to adopt predictive maintenance, cloud analytics, and energy-saving sensors to remain competitive, comply with regulations, and respond to the increasing need for sustainable textile manufacturing.
Increase Strategic Partnerships & Industry Reach
Partnering with industry-leading textile machinery providers, R&D centers, and local distributors will spur adoption, enhance worldwide industry penetration, and provide access to the latest sensor advancements.
Risk | Probability & Impact |
---|---|
Smart weft sensors require significant upfront investment, deterring small and mid-sized manufacturers. | Medium Probability / High Impact |
Supply Chain Disruptions - Dependence on semiconductor components and specialized sensors may lead to production delays. | High Probability / Medium Impact |
Slow Adoption in Traditional sectors - Cost-sensitive textile manufacturers may resist transitioning from conventional weaving methods. | Medium Probability / Medium Impact |
Priority | Immediate Action |
---|---|
AI-Driven Weft Sensor Integration | Conduct feasibility studies on automating textile weaving with AI-powered sensors. |
Supply Chain Resilience | Establish alternative sensor component suppliers to mitigate risks of shortages. |
Industry Expansion & Partnerships | Initiate OEM collaborations and distributor incentive programs to accelerate adoption. |
To remain in the lead within the changing Weft Sensor sector, the business will need to ramp up investment in AI and IoT-based weaving technologies with proper integration with Industry 4.0 developments. A well-designed R&D and partnership strategy with major textile machine manufacturers will be key to influencing innovation and penetration.
Securing alternative supply chains will prevent disruptions and sustain growth. This strategic shift will drive the adoption of intelligent textile automation, product differentiation with sustainability, and international growth. Firms acting fast will assume segment leadership, increase operational excellence, and ensure long-term competitiveness in textile manufacturing.
Key Priorities of Stakeholders
Adoption of Advanced Technologies
Material & Durability Preferences
Price Sensitivity & Segment Constraints
Pain Points in the Value Chain
Manufacturers:
Distributors:
End-Users (Textile Manufacturers):
Future Investment Priorities
Regulatory Impact & Compliance
Conclusion: Key Takeaways from the Survey
Country/Region | Regulatory Impact & Mandatory Certifications |
---|---|
United States |
|
European Union |
|
China |
|
India |
|
Japan |
|
South Korea |
|
Turkey |
|
The USA Weft Sensors sector is expected to grow at a 6.9% CAGR from 2025 to 2035. Global Industry Advances in Sustainable Weft Sensors amid Smart Textile Automation & IoT Trends. The Biden Administration’s focus on reshoring manufacturing should substantially increase domestic sensor production, aided by incentives from the CHIPS Act and Inflation Reduction Act.
In addition, the growing implementation of AI-based quality control systems in textile mills is driving the growth of demand for high-precision weft sensors. Sustainability is also emerging, as major brands advocate for low-energy, recyclable sensor materials under the USA Department of Energy’s Sustainable Manufacturing Initiative.
The UK Weft Sensors landscape is anticipated to grow at a rate of 6.4% between 2025 and 2035, staggered growth due to post-Brexit trading system and the significant dependence on renewed investments from the textile industry, which worldwide remains somewhat inconsistent. The country’s textile industry is increasingly adopting automated and eco-friendly production methods, driving the use of AI-powered defect detection sensors.
A key impetus has been the UK’s Net Zero Strategy, which demands carbon-neutral textile production. Even textile manufacturers have started using energy-efficient sensors to reduce fabric waste and enhance production efficiency due to the initiative. UK compliance with CE certification and ISO 14001 sustainability standards is driving manufacturers to deliver compliant weft sensors.
In France, the Weft Sensors sector is projected to grow at a progressive CAGR of 6.5% for the period from 2025 to 2035, owing to the country’s rich textile history and government support for industrial automation. France continues to be a center for technical textiles as well as high-end fashion, enabling precision-driven weaving solutions, for the demand for advanced weft sensors.
The EU's Digital Product Passport (DPP) regulation puts much focus on France's textile sector and is encouraging textile makers to add smart tracking and defect detection sensors. The France industrial strategy's subsidies for IoT, AI, and textile factories using robotic weaving technology boost demand for advanced weft sensors.
With its healthy industrial base and also leadership position on automation, Germany is anticipated to register a CAGR of 6.8% in the weft sensor landscape, making it one of the fastest-growing weft sensor segments. Excelling in technical textiles, automotive fabrics, and industrial weaving applications, the German textile industry is one of the most advanced in the world and demands high-precision weft sensors.
German textile mills have implemented AI-powered woven sensors aided by government support for Industry 4.0 adoption. The EU Ecodesign Directive and CE Marking Requirements are forcing textile producers to adopt energy-efficient and recyclable sensor solutions. Furthermore, Germany’s Fraunhofer Institutes are actively engaged in R&D on smart sensors for defect detection, fostering domestic innovation.
Italy
Supported by the growth of luxury fashion houses, upholstery producers, and high-end textile exporters, the weft sensor landscape in Italy is expected to grow at a CAGR of 6.6% during the forecast period. In Italy, a focus on precision weaving technologies in Prato, Milan, and Biella is ensuring textile manufacturers remain globally competitive.
The Italian government launched Transizione 4.0, a program offering tax incentives to textile companies investing in smart weaving solutions, thereby accelerating sensor adoption. Furthermore, strict adherence to CE certification and ISO 14001 environmental standards in Italy is also influencing the demand for eco-friendly sensor materials.
South Korea’s Weft Sensors landscape is anticipated to flourish at a noteworthy CAGR of 7.2% over the projected years, contributing significantly to the regional market expansion. Part of the South Korean government’s Manufacturing Innovation 3.0 strategy, this Smart Factory Initiative has been pivotal in enabling textile businesses to redesign their production lines with AI-based weaving solutions, robotic automation, and IoT-integrated sensors.
It provides tax incentives and funding grants to firms that invest in advanced manufacturing technologies, which rekindle the adoption of high-precision weft sensors. One of the main regulations to keep in mind is the KC (Korea Certification) Mark, which is necessary for all electronic textile machinery and their components, including weft sensors.
Japan’s weft sensor market is expected to grow at a CAGR of 6.5%, slightly below the global average, due to the country's focus on niche, high-tech textiles rather than mass production.
Japanese textile companies pride themselves on precision and craftsmanship, causing them to lag behind other countries like China and South Korea in full-fledged automation. For example, JIS (Japanese Industrial Standards) certification is an important option in the segment because it ensures the weft sensors meet the high-level requirements of quality, accuracy, and durability.
In line with the tradition, Japanese textile producers tend to opt for bespoke or semi-automated weaving systems, implementing select automation but not a total overhaul of production systems. Textile manufacturers are increasingly looking to low-cost weaving sensors that require minimal space along the loom’s length.
China is expected to experience significant growth in the weft sensor market, with a CAGR of 8.0%, driven by the Made in China 2025 initiative and increasing automation. Despite significant investment in textile automation, certain areas still lack strong domestic manufacturing motivation, which may slow expansion. Limited government support and a lack of domestic manufacturing motivation will also be responsible for sluggish growth in this region.
Under the Made in China 2025 program, the Chinese authorities are investing heavily in textile automation, AI-powered production, and smart sensors, making the country the world’s largest consumer and producer of weft sensors.
China Compulsory Certification (CCC) is the most essential regulatory authority that all the textile sensors should have before selling in the sector. This way, weft sensors domestically produced adhere to the safety and performance standards set by the government, thus favoring domestic manufacturers over foreign manufacturers.
The Australia & New Zealand Weft Sensors landscape is predicted to grow at a CAGR of 6.4%, based mainly on the demand for textile automation in wool processing, niche technical textiles, and sustainability-oriented manufacturing. The wool production industry dominates Australia’s textile sector, and smart weaving technologies are emerging in automating the processing of fine Merino wool and high-performance material.
New Zealand has a smaller textile industry than other countries, but there is strong focus on sustainable, eco-friendly textile innovations, which attract demand for low-energy, biodegradable sensor materials. Industry adoption is being fueled through supportive government initiatives offering AI-powered textile innovation, energy-efficient production methods, and digital weaving systems.
India's weft sensor landscape will grow at a robust CAGR of 7.8% on the back of government-led growth initiatives, increased adoption of Industry 4.0, and expansion of the textile automation sector.
One such key driver of growth is the Production Linked Incentive (PLI) scheme for textiles, which would provide companies with financial incentives to invest in automation, AI-driven weaving technologies, and advanced textile machinery. One major regulatory requirement is Bureau of Indian Standards (BIS) certification, which ensures that weft sensors comply with domestic quality and safety standards.
Compliance with industrial safety regulations and energy efficiency standards is also assuming larger significance for large textile centers like Surat, Coimbatore, and Ludhiana. As India’s textile industry moves toward IoT-enabled looms, AI-based quality control sensors, and automated defect detection systems, the transformation journey promises to be significant.
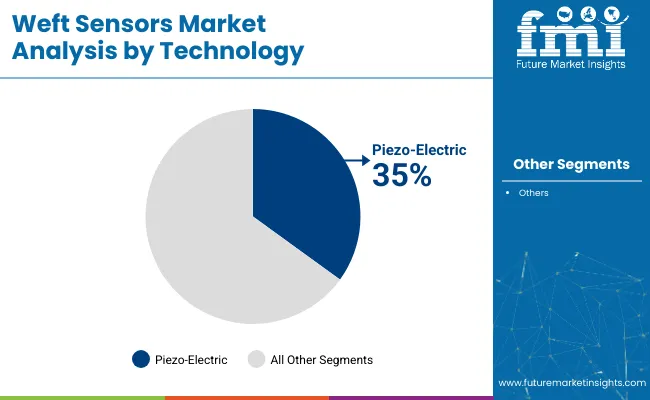
Weft sensors are advancing in various technological classes, such as piezoelectric, optical, and capacitive sensors. Piezoelectric sensors are particularly accurate in picking up very slight vibrations and tension in the weft yarn and are thus extremely well-suited for high-speed industrial looms.
Optical sensors through infrared or laser technology offer non-contact detection and are used in high-end and technical textiles where even slight defects can affect fabric quality. Capacitive sensors, by contrast, operate on electrical capacitance changes and find special application in sensing synthetic and fine fibers. The increasing uptake of smart textile production and Industry 4.0 is spurring development in these sensor technologies, enhancing efficiency and minimizing manual intervention in weaving operations.
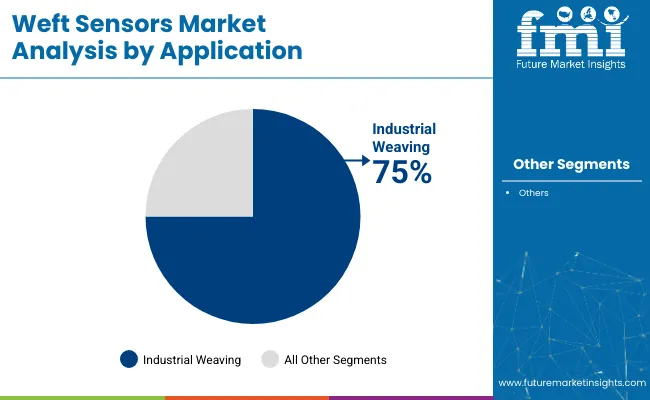
Industrial and handloom weaving heavily influences the demand for weft sensors. Industrial weaving continues to be the leading segment because of its giant requirement for fabric production at scale, rising automation, and strict quality checks in industries like apparel, home fabrics, and auto textiles.
The growing adoption of AI-powered looms and intelligent monitoring systems also drives the adoption of sensors. Handloom weaving, although a smaller sector, plays a significant role in traditional and heritage fabric production in regions like South Asia and Africa. Low-cost sensor solutions are being used more and more in this sector to update traditional weaving through partial automation and state-initiated sustainability drives.
Leading companies in the weft sensor landscape are competing through a combination of pricing strategies, technological innovation, strategic partnerships, and geographic expansion. Price competitiveness is a key factor, with some manufacturers focusing on cost-effective solutions for emerging sectors, while others are investing in high-end, precision-based sensors for premium textile applications.
Growth strategies among top players vary based on segment positioning. Established players are focusing on geographic expansion, particularly in high-growth regions like China, India, and Southeast Asia, where textile manufacturing is rapidly modernizing. Companies are also investing in R&D to develop energy-efficient and durable sensors that align with sustainability goals in regions like Western Europe.
Hanesbrands Inc. Strengthens Partnership with Wipro:
In June 2024, Hanesbrands Inc., a global leader in apparel brands, expanded its collaboration with Wipro Limited to accelerate digital transformation. Wipro will provide services including AI, cloud, data analytics, application management, cybersecurity, and consulting to enhance Hanesbrands' operations and profitability.
Teledyne Technologies Acquires Aerospace and Defense Electronics Businesses from Excelitas Technologies
In 2024, Teledyne Technologies completed the acquisition of select aerospace and defense electronics businesses from Excelitas Technologies for USD 710 million in cash. This deal includes Excelitas' Optical Systems (OS) business, known for its Qioptiq® brand, and the USA-based Advanced Electronic Systems (AES) business, strengthening Teledyne's portfolio in advanced optics and defense electronics.
Mann+Hummel Acquires Majority Stake in Suzhou U-Air Environmental Technology
In July 2023, Mann+Hummel expanded its air filtration business by acquiring a majority stake in Suzhou U-Air Environmental Technology, a Chinese filtration manufacturer. This acquisition strengthens Mann+Hummel's presence in China and Southeast Asia, enhancing its ability to serve customers globally.
TWE Group Forms Joint Venture with Obeetee Textiles
In June 2023, TWE Group and Obeetee Textiles (OTL) established a strategic joint venture named TWE OBT Private Limited. This partnership involves investment in a new facility in India dedicated to nonwoven products for the health and hygiene segment, expanding TWE Group's footprint in the region.
LexisNexis Risk Solutions to Acquire IDVerse
In 2024, LexisNexis Risk Solutions agreed to acquire IDVerse, an AI-powered automated document authentication and fraud detection solutions provider. This acquisition aims to integrate IDVerse's advanced technology into LexisNexis' offerings, enhancing their ability to combat fraud and deepfakes.
Piezo-Electric, Optical, and Capacitive
Industrial Weaving and Handloom Weaving
North America, Latin America, Western Europe, Eastern Europe, East Asia, South Asia & Pacific, and The Middle East & Africa
Table 1: Global Market Value (US$ Million) Forecast by Region, 2018 & 2033
Table 2: Global Market Volume (Tons) Forecast by Region, 2018 & 2033
Table 3: Global Market Value (US$ Million) Forecast by Technology, 2018 & 2033
Table 4: Global Market Volume (Tons) Forecast by Technology, 2018 & 2033
Table 5: Global Market Value (US$ Million) Forecast by Mounting Location, 2018 & 2033
Table 6: Global Market Volume (Tons) Forecast by Mounting Location, 2018 & 2033
Table 7: Global Market Value (US$ Million) Forecast by Application, 2018 & 2033
Table 8: Global Market Volume (Tons) Forecast by Application, 2018 & 2033
Table 9: North America Market Value (US$ Million) Forecast by Country, 2018 & 2033
Table 10: North America Market Volume (Tons) Forecast by Country, 2018 & 2033
Table 11: North America Market Value (US$ Million) Forecast by Technology, 2018 & 2033
Table 12: North America Market Volume (Tons) Forecast by Technology, 2018 & 2033
Table 13: North America Market Value (US$ Million) Forecast by Mounting Location, 2018 & 2033
Table 14: North America Market Volume (Tons) Forecast by Mounting Location, 2018 & 2033
Table 15: North America Market Value (US$ Million) Forecast by Application, 2018 & 2033
Table 16: North America Market Volume (Tons) Forecast by Application, 2018 & 2033
Table 17: Latin America Market Value (US$ Million) Forecast by Country, 2018 & 2033
Table 18: Latin America Market Volume (Tons) Forecast by Country, 2018 & 2033
Table 19: Latin America Market Value (US$ Million) Forecast by Technology, 2018 & 2033
Table 20: Latin America Market Volume (Tons) Forecast by Technology, 2018 & 2033
Table 21: Latin America Market Value (US$ Million) Forecast by Mounting Location, 2018 & 2033
Table 22: Latin America Market Volume (Tons) Forecast by Mounting Location, 2018 & 2033
Table 23: Latin America Market Value (US$ Million) Forecast by Application, 2018 & 2033
Table 24: Latin America Market Volume (Tons) Forecast by Application, 2018 & 2033
Table 25: Western Europe Market Value (US$ Million) Forecast by Country, 2018 & 2033
Table 26: Western Europe Market Volume (Tons) Forecast by Country, 2018 & 2033
Table 27: Western Europe Market Value (US$ Million) Forecast by Technology, 2018 & 2033
Table 28: Western Europe Market Volume (Tons) Forecast by Technology, 2018 & 2033
Table 29: Western Europe Market Value (US$ Million) Forecast by Mounting Location, 2018 & 2033
Table 30: Western Europe Market Volume (Tons) Forecast by Mounting Location, 2018 & 2033
Table 31: Western Europe Market Value (US$ Million) Forecast by Application, 2018 & 2033
Table 32: Western Europe Market Volume (Tons) Forecast by Application, 2018 & 2033
Table 33: Eastern Europe Market Value (US$ Million) Forecast by Country, 2018 & 2033
Table 34: Eastern Europe Market Volume (Tons) Forecast by Country, 2018 & 2033
Table 35: Eastern Europe Market Value (US$ Million) Forecast by Technology, 2018 & 2033
Table 36: Eastern Europe Market Volume (Tons) Forecast by Technology, 2018 & 2033
Table 37: Eastern Europe Market Value (US$ Million) Forecast by Mounting Location, 2018 & 2033
Table 38: Eastern Europe Market Volume (Tons) Forecast by Mounting Location, 2018 & 2033
Table 39: Eastern Europe Market Value (US$ Million) Forecast by Application, 2018 & 2033
Table 40: Eastern Europe Market Volume (Tons) Forecast by Application, 2018 & 2033
Table 41: East Asia Market Value (US$ Million) Forecast by Country, 2018 & 2033
Table 42: East Asia Market Volume (Tons) Forecast by Country, 2018 & 2033
Table 43: East Asia Market Value (US$ Million) Forecast by Technology, 2018 & 2033
Table 44: East Asia Market Volume (Tons) Forecast by Technology, 2018 & 2033
Table 45: East Asia Market Value (US$ Million) Forecast by Mounting Location, 2018 & 2033
Table 46: East Asia Market Volume (Tons) Forecast by Mounting Location, 2018 & 2033
Table 47: East Asia Market Value (US$ Million) Forecast by Application, 2018 & 2033
Table 48: East Asia Market Volume (Tons) Forecast by Application, 2018 & 2033
Table 49: South Asia Market Value (US$ Million) Forecast by Country, 2018 & 2033
Table 50: South Asia Market Volume (Tons) Forecast by Country, 2018 & 2033
Table 51: South Asia Market Value (US$ Million) Forecast by Technology, 2018 & 2033
Table 52: South Asia Market Volume (Tons) Forecast by Technology, 2018 & 2033
Table 53: South Asia Market Value (US$ Million) Forecast by Mounting Location, 2018 & 2033
Table 54: South Asia Market Volume (Tons) Forecast by Mounting Location, 2018 & 2033
Table 55: South Asia Market Value (US$ Million) Forecast by Application, 2018 & 2033
Table 56: South Asia Market Volume (Tons) Forecast by Application, 2018 & 2033
Table 57: MEA Market Value (US$ Million) Forecast by Country, 2018 & 2033
Table 58: MEA Market Volume (Tons) Forecast by Country, 2018 & 2033
Table 59: MEA Market Value (US$ Million) Forecast by Technology, 2018 & 2033
Table 60: MEA Market Volume (Tons) Forecast by Technology, 2018 & 2033
Table 61: MEA Market Value (US$ Million) Forecast by Mounting Location, 2018 & 2033
Table 62: MEA Market Volume (Tons) Forecast by Mounting Location, 2018 & 2033
Table 63: MEA Market Value (US$ Million) Forecast by Application, 2018 & 2033
Table 64: MEA Market Volume (Tons) Forecast by Application, 2018 & 2033
Figure 1: Global Market Value (US$ Million) by Technology, 2022 & 2032
Figure 2: Global Market Value (US$ Million) by Mounting Location, 2022 & 2032
Figure 3: Global Market Value (US$ Million) by Application, 2022 & 2032
Figure 4: Global Market Value (US$ Million) by Region, 2022 & 2032
Figure 5: Global Market Value (US$ Million) Analysis by Region, 2018 & 2033
Figure 6: Global Market Volume (Tons) Analysis by Region, 2018 & 2033
Figure 7: Global Market Value Share (%) and BPS Analysis by Region, 2022 & 2032
Figure 8: Global Market Y-o-Y Growth (%) Projections by Region, 2022 to 2032
Figure 9: Global Market Value (US$ Million) Analysis by Technology, 2018 & 2033
Figure 10: Global Market Volume (Tons) Analysis by Technology, 2018 & 2033
Figure 11: Global Market Value Share (%) and BPS Analysis by Technology, 2022 & 2032
Figure 12: Global Market Y-o-Y Growth (%) Projections by Technology, 2022 to 2032
Figure 13: Global Market Value (US$ Million) Analysis by Mounting Location, 2018 & 2033
Figure 14: Global Market Volume (Tons) Analysis by Mounting Location, 2018 & 2033
Figure 15: Global Market Value Share (%) and BPS Analysis by Mounting Location, 2022 & 2032
Figure 16: Global Market Y-o-Y Growth (%) Projections by Mounting Location, 2022 to 2032
Figure 17: Global Market Value (US$ Million) Analysis by Application, 2018 & 2033
Figure 18: Global Market Volume (Tons) Analysis by Application, 2018 & 2033
Figure 19: Global Market Value Share (%) and BPS Analysis by Application, 2022 & 2032
Figure 20: Global Market Y-o-Y Growth (%) Projections by Application, 2022 to 2032
Figure 21: Global Market Attractiveness by Technology, 2022 to 2032
Figure 22: Global Market Attractiveness by Mounting Location, 2022 to 2032
Figure 23: Global Market Attractiveness by Application, 2022 to 2032
Figure 24: Global Market Attractiveness by Region, 2022 to 2032
Figure 25: North America Market Value (US$ Million) by Technology, 2022 & 2032
Figure 26: North America Market Value (US$ Million) by Mounting Location, 2022 & 2032
Figure 27: North America Market Value (US$ Million) by Application, 2022 & 2032
Figure 28: North America Market Value (US$ Million) by Country, 2022 & 2032
Figure 29: North America Market Value (US$ Million) Analysis by Country, 2018 & 2033
Figure 30: North America Market Volume (Tons) Analysis by Country, 2018 & 2033
Figure 31: North America Market Value Share (%) and BPS Analysis by Country, 2022 & 2032
Figure 32: North America Market Y-o-Y Growth (%) Projections by Country, 2022 to 2032
Figure 33: North America Market Value (US$ Million) Analysis by Technology, 2018 & 2033
Figure 34: North America Market Volume (Tons) Analysis by Technology, 2018 & 2033
Figure 35: North America Market Value Share (%) and BPS Analysis by Technology, 2022 & 2032
Figure 36: North America Market Y-o-Y Growth (%) Projections by Technology, 2022 to 2032
Figure 37: North America Market Value (US$ Million) Analysis by Mounting Location, 2018 & 2033
Figure 38: North America Market Volume (Tons) Analysis by Mounting Location, 2018 & 2033
Figure 39: North America Market Value Share (%) and BPS Analysis by Mounting Location, 2022 & 2032
Figure 40: North America Market Y-o-Y Growth (%) Projections by Mounting Location, 2022 to 2032
Figure 41: North America Market Value (US$ Million) Analysis by Application, 2018 & 2033
Figure 42: North America Market Volume (Tons) Analysis by Application, 2018 & 2033
Figure 43: North America Market Value Share (%) and BPS Analysis by Application, 2022 & 2032
Figure 44: North America Market Y-o-Y Growth (%) Projections by Application, 2022 to 2032
Figure 45: North America Market Attractiveness by Technology, 2022 to 2032
Figure 46: North America Market Attractiveness by Mounting Location, 2022 to 2032
Figure 47: North America Market Attractiveness by Application, 2022 to 2032
Figure 48: North America Market Attractiveness by Country, 2022 to 2032
Figure 49: Latin America Market Value (US$ Million) by Technology, 2022 & 2032
Figure 50: Latin America Market Value (US$ Million) by Mounting Location, 2022 & 2032
Figure 51: Latin America Market Value (US$ Million) by Application, 2022 & 2032
Figure 52: Latin America Market Value (US$ Million) by Country, 2022 & 2032
Figure 53: Latin America Market Value (US$ Million) Analysis by Country, 2018 & 2033
Figure 54: Latin America Market Volume (Tons) Analysis by Country, 2018 & 2033
Figure 55: Latin America Market Value Share (%) and BPS Analysis by Country, 2022 & 2032
Figure 56: Latin America Market Y-o-Y Growth (%) Projections by Country, 2022 to 2032
Figure 57: Latin America Market Value (US$ Million) Analysis by Technology, 2018 & 2033
Figure 58: Latin America Market Volume (Tons) Analysis by Technology, 2018 & 2033
Figure 59: Latin America Market Value Share (%) and BPS Analysis by Technology, 2022 & 2032
Figure 60: Latin America Market Y-o-Y Growth (%) Projections by Technology, 2022 to 2032
Figure 61: Latin America Market Value (US$ Million) Analysis by Mounting Location, 2018 & 2033
Figure 62: Latin America Market Volume (Tons) Analysis by Mounting Location, 2018 & 2033
Figure 63: Latin America Market Value Share (%) and BPS Analysis by Mounting Location, 2022 & 2032
Figure 64: Latin America Market Y-o-Y Growth (%) Projections by Mounting Location, 2022 to 2032
Figure 65: Latin America Market Value (US$ Million) Analysis by Application, 2018 & 2033
Figure 66: Latin America Market Volume (Tons) Analysis by Application, 2018 & 2033
Figure 67: Latin America Market Value Share (%) and BPS Analysis by Application, 2022 & 2032
Figure 68: Latin America Market Y-o-Y Growth (%) Projections by Application, 2022 to 2032
Figure 69: Latin America Market Attractiveness by Technology, 2022 to 2032
Figure 70: Latin America Market Attractiveness by Mounting Location, 2022 to 2032
Figure 71: Latin America Market Attractiveness by Application, 2022 to 2032
Figure 72: Latin America Market Attractiveness by Country, 2022 to 2032
Figure 73: Western Europe Market Value (US$ Million) by Technology, 2022 & 2032
Figure 74: Western Europe Market Value (US$ Million) by Mounting Location, 2022 & 2032
Figure 75: Western Europe Market Value (US$ Million) by Application, 2022 & 2032
Figure 76: Western Europe Market Value (US$ Million) by Country, 2022 & 2032
Figure 77: Western Europe Market Value (US$ Million) Analysis by Country, 2018 & 2033
Figure 78: Western Europe Market Volume (Tons) Analysis by Country, 2018 & 2033
Figure 79: Western Europe Market Value Share (%) and BPS Analysis by Country, 2022 & 2032
Figure 80: Western Europe Market Y-o-Y Growth (%) Projections by Country, 2022 to 2032
Figure 81: Western Europe Market Value (US$ Million) Analysis by Technology, 2018 & 2033
Figure 82: Western Europe Market Volume (Tons) Analysis by Technology, 2018 & 2033
Figure 83: Western Europe Market Value Share (%) and BPS Analysis by Technology, 2022 & 2032
Figure 84: Western Europe Market Y-o-Y Growth (%) Projections by Technology, 2022 to 2032
Figure 85: Western Europe Market Value (US$ Million) Analysis by Mounting Location, 2018 & 2033
Figure 86: Western Europe Market Volume (Tons) Analysis by Mounting Location, 2018 & 2033
Figure 87: Western Europe Market Value Share (%) and BPS Analysis by Mounting Location, 2022 & 2032
Figure 88: Western Europe Market Y-o-Y Growth (%) Projections by Mounting Location, 2022 to 2032
Figure 89: Western Europe Market Value (US$ Million) Analysis by Application, 2018 & 2033
Figure 90: Western Europe Market Volume (Tons) Analysis by Application, 2018 & 2033
Figure 91: Western Europe Market Value Share (%) and BPS Analysis by Application, 2022 & 2032
Figure 92: Western Europe Market Y-o-Y Growth (%) Projections by Application, 2022 to 2032
Figure 93: Western Europe Market Attractiveness by Technology, 2022 to 2032
Figure 94: Western Europe Market Attractiveness by Mounting Location, 2022 to 2032
Figure 95: Western Europe Market Attractiveness by Application, 2022 to 2032
Figure 96: Western Europe Market Attractiveness by Country, 2022 to 2032
Figure 97: Eastern Europe Market Value (US$ Million) by Technology, 2022 & 2032
Figure 98: Eastern Europe Market Value (US$ Million) by Mounting Location, 2022 & 2032
Figure 99: Eastern Europe Market Value (US$ Million) by Application, 2022 & 2032
Figure 100: Eastern Europe Market Value (US$ Million) by Country, 2022 & 2032
Figure 101: Eastern Europe Market Value (US$ Million) Analysis by Country, 2018 & 2033
Figure 102: Eastern Europe Market Volume (Tons) Analysis by Country, 2018 & 2033
Figure 103: Eastern Europe Market Value Share (%) and BPS Analysis by Country, 2022 & 2032
Figure 104: Eastern Europe Market Y-o-Y Growth (%) Projections by Country, 2022 to 2032
Figure 105: Eastern Europe Market Value (US$ Million) Analysis by Technology, 2018 & 2033
Figure 106: Eastern Europe Market Volume (Tons) Analysis by Technology, 2018 & 2033
Figure 107: Eastern Europe Market Value Share (%) and BPS Analysis by Technology, 2022 & 2032
Figure 108: Eastern Europe Market Y-o-Y Growth (%) Projections by Technology, 2022 to 2032
Figure 109: Eastern Europe Market Value (US$ Million) Analysis by Mounting Location, 2018 & 2033
Figure 110: Eastern Europe Market Volume (Tons) Analysis by Mounting Location, 2018 & 2033
Figure 111: Eastern Europe Market Value Share (%) and BPS Analysis by Mounting Location, 2022 & 2032
Figure 112: Eastern Europe Market Y-o-Y Growth (%) Projections by Mounting Location, 2022 to 2032
Figure 113: Eastern Europe Market Value (US$ Million) Analysis by Application, 2018 & 2033
Figure 114: Eastern Europe Market Volume (Tons) Analysis by Application, 2018 & 2033
Figure 115: Eastern Europe Market Value Share (%) and BPS Analysis by Application, 2022 & 2032
Figure 116: Eastern Europe Market Y-o-Y Growth (%) Projections by Application, 2022 to 2032
Figure 117: Eastern Europe Market Attractiveness by Technology, 2022 to 2032
Figure 118: Eastern Europe Market Attractiveness by Mounting Location, 2022 to 2032
Figure 119: Eastern Europe Market Attractiveness by Application, 2022 to 2032
Figure 120: Eastern Europe Market Attractiveness by Country, 2022 to 2032
Figure 121: East Asia Market Value (US$ Million) by Technology, 2022 & 2032
Figure 122: East Asia Market Value (US$ Million) by Mounting Location, 2022 & 2032
Figure 123: East Asia Market Value (US$ Million) by Application, 2022 & 2032
Figure 124: East Asia Market Value (US$ Million) by Country, 2022 & 2032
Figure 125: East Asia Market Value (US$ Million) Analysis by Country, 2018 & 2033
Figure 126: East Asia Market Volume (Tons) Analysis by Country, 2018 & 2033
Figure 127: East Asia Market Value Share (%) and BPS Analysis by Country, 2022 & 2032
Figure 128: East Asia Market Y-o-Y Growth (%) Projections by Country, 2022 to 2032
Figure 129: East Asia Market Value (US$ Million) Analysis by Technology, 2018 & 2033
Figure 130: East Asia Market Volume (Tons) Analysis by Technology, 2018 & 2033
Figure 131: East Asia Market Value Share (%) and BPS Analysis by Technology, 2022 & 2032
Figure 132: East Asia Market Y-o-Y Growth (%) Projections by Technology, 2022 to 2032
Figure 133: East Asia Market Value (US$ Million) Analysis by Mounting Location, 2018 & 2033
Figure 134: East Asia Market Volume (Tons) Analysis by Mounting Location, 2018 & 2033
Figure 135: East Asia Market Value Share (%) and BPS Analysis by Mounting Location, 2022 & 2032
Figure 136: East Asia Market Y-o-Y Growth (%) Projections by Mounting Location, 2022 to 2032
Figure 137: East Asia Market Value (US$ Million) Analysis by Application, 2018 & 2033
Figure 138: East Asia Market Volume (Tons) Analysis by Application, 2018 & 2033
Figure 139: East Asia Market Value Share (%) and BPS Analysis by Application, 2022 & 2032
Figure 140: East Asia Market Y-o-Y Growth (%) Projections by Application, 2022 to 2032
Figure 141: East Asia Market Attractiveness by Technology, 2022 to 2032
Figure 142: East Asia Market Attractiveness by Mounting Location, 2022 to 2032
Figure 143: East Asia Market Attractiveness by Application, 2022 to 2032
Figure 144: East Asia Market Attractiveness by Country, 2022 to 2032
Figure 145: South Asia Market Value (US$ Million) by Technology, 2022 & 2032
Figure 146: South Asia Market Value (US$ Million) by Mounting Location, 2022 & 2032
Figure 147: South Asia Market Value (US$ Million) by Application, 2022 & 2032
Figure 148: South Asia Market Value (US$ Million) by Country, 2022 & 2032
Figure 149: South Asia Market Value (US$ Million) Analysis by Country, 2018 & 2033
Figure 150: South Asia Market Volume (Tons) Analysis by Country, 2018 & 2033
Figure 151: South Asia Market Value Share (%) and BPS Analysis by Country, 2022 & 2032
Figure 152: South Asia Market Y-o-Y Growth (%) Projections by Country, 2022 to 2032
Figure 153: South Asia Market Value (US$ Million) Analysis by Technology, 2018 & 2033
Figure 154: South Asia Market Volume (Tons) Analysis by Technology, 2018 & 2033
Figure 155: South Asia Market Value Share (%) and BPS Analysis by Technology, 2022 & 2032
Figure 156: South Asia Market Y-o-Y Growth (%) Projections by Technology, 2022 to 2032
Figure 157: South Asia Market Value (US$ Million) Analysis by Mounting Location, 2018 & 2033
Figure 158: South Asia Market Volume (Tons) Analysis by Mounting Location, 2018 & 2033
Figure 159: South Asia Market Value Share (%) and BPS Analysis by Mounting Location, 2022 & 2032
Figure 160: South Asia Market Y-o-Y Growth (%) Projections by Mounting Location, 2022 to 2032
Figure 161: South Asia Market Value (US$ Million) Analysis by Application, 2018 & 2033
Figure 162: South Asia Market Volume (Tons) Analysis by Application, 2018 & 2033
Figure 163: South Asia Market Value Share (%) and BPS Analysis by Application, 2022 & 2032
Figure 164: South Asia Market Y-o-Y Growth (%) Projections by Application, 2022 to 2032
Figure 165: South Asia Market Attractiveness by Technology, 2022 to 2032
Figure 166: South Asia Market Attractiveness by Mounting Location, 2022 to 2032
Figure 167: South Asia Market Attractiveness by Application, 2022 to 2032
Figure 168: South Asia Market Attractiveness by Country, 2022 to 2032
Figure 169: MEA Market Value (US$ Million) by Technology, 2022 & 2032
Figure 170: MEA Market Value (US$ Million) by Mounting Location, 2022 & 2032
Figure 171: MEA Market Value (US$ Million) by Application, 2022 & 2032
Figure 172: MEA Market Value (US$ Million) by Country, 2022 & 2032
Figure 173: MEA Market Value (US$ Million) Analysis by Country, 2018 & 2033
Figure 174: MEA Market Volume (Tons) Analysis by Country, 2018 & 2033
Figure 175: MEA Market Value Share (%) and BPS Analysis by Country, 2022 & 2032
Figure 176: MEA Market Y-o-Y Growth (%) Projections by Country, 2022 to 2032
Figure 177: MEA Market Value (US$ Million) Analysis by Technology, 2018 & 2033
Figure 178: MEA Market Volume (Tons) Analysis by Technology, 2018 & 2033
Figure 179: MEA Market Value Share (%) and BPS Analysis by Technology, 2022 & 2032
Figure 180: MEA Market Y-o-Y Growth (%) Projections by Technology, 2022 to 2032
Figure 181: MEA Market Value (US$ Million) Analysis by Mounting Location, 2018 & 2033
Figure 182: MEA Market Volume (Tons) Analysis by Mounting Location, 2018 & 2033
Figure 183: MEA Market Value Share (%) and BPS Analysis by Mounting Location, 2022 & 2032
Figure 184: MEA Market Y-o-Y Growth (%) Projections by Mounting Location, 2022 to 2032
Figure 185: MEA Market Value (US$ Million) Analysis by Application, 2018 & 2033
Figure 186: MEA Market Volume (Tons) Analysis by Application, 2018 & 2033
Figure 187: MEA Market Value Share (%) and BPS Analysis by Application, 2022 & 2032
Figure 188: MEA Market Y-o-Y Growth (%) Projections by Application, 2022 to 2032
Figure 189: MEA Market Attractiveness by Technology, 2022 to 2032
Figure 190: MEA Market Attractiveness by Mounting Location, 2022 to 2032
Figure 191: MEA Market Attractiveness by Application, 2022 to 2032
Growing automation in textile production, the need for precision weaving, and technological advancements in sensors are among the key drivers.
Textile and fashion industries, especially in automated weaving and intelligent fabric production are the sectors gain the most from the use of WEFT sensors.
Some recent developments include AI-based sensors, IoT-based monitoring, and power-efficient optical sensing systems.
China, India, and Europe are leading the way, motivated by industrial growth, government incentives and policies, and technology development.
Standards such as CE (Europe), BIS (India), and CCC (China) guarantee quality and safety standards, thereby shaping design and manufacturing practices.
Explore Similar Insights
Thank you!
You will receive an email from our Business Development Manager. Please be sure to check your SPAM/JUNK folder too.