Cholesterol API Market
Discover How Urgent Need for Novel Drug Delivery Systems is Driving Sales of Cholesterol APIs
Cholesterol API Market by Source, Manufacturing Process, End User & Region - Forecast 2022 – 2032
Cholesterol API Market Outlook (2022-2032)
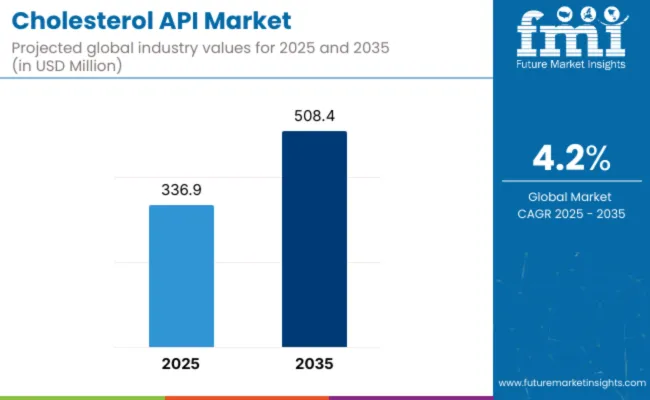
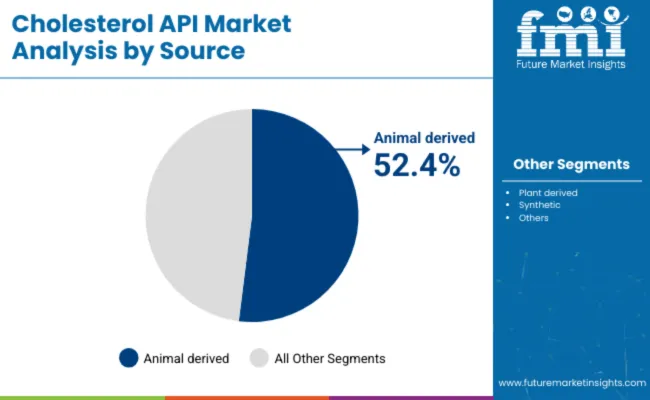
[345 Pages Report] The global cholesterol active pharmaceutical ingredient (API) market size is expected to reach a valuation of US$ 269.0 Mn by the end of 2022, and further expand at a CAGR of 4.7% during the forecast period from 2022 to 2032. The global cholesterol API market is anticipated to be valued at ~US$ 426.9 Mn by 2032. Animal-derived sources are leading the market and held a share of about 52.7% in 2021.
Attributes |
Key Statistics |
Global Cholesterol API Market Estimated Size (2022E) |
US$ 269.0 Mn |
Projected Market Valuation (2032F) |
US$ 426.9 Mn |
Value-based CAGR (2022-2032) |
4.7% |
Collective Value Share: Top 5 Countries |
57.7% |
Lipid shells employed in the manufacturing of RNA vaccines contain cholesterol API, which gives the vaccine high stability by preventing the action of enzyme degradation. They can be chemically synthesized in laboratories and are generally sourced from plants and animals.
To assure their effectiveness as a targeted drug carrier, they are often combined with liposomes, which contain cholesterol, in monoclonal antibodies. The cholesterol in this context helps to stabilize the delivery system for therapeutic targets. Antimalarial, anticancer, antiviral, and gene therapy are some of the other applications of drug delivery systems that utilize cholesterol APIs.
The global cholesterol API market held approximately 5.9% of the global pharmaceutical lipids market share in 2021. The global pharmaceutical lipids market was worth ~US$ 4.4 Bn.
Let us know your requirement to get
100% FREE customization
2017-2021 Global Cholesterol API Demand Outlook Compared to 2022-2032 Forecast
The market for cholesterol APIs expanded at a CAGR of 3.6% during the historic period from 2017 to 2021 owing to their growing adoption in the field of drug delivery.
In the production of vaccines and medicines, cholesterol acts as a stabilizing agent. Lipid nanoparticles have become popular in the pharmaceutical sector as potential drug delivery vehicles. They are essential for efficiently encapsulating and delivering mRNA to cells.
Cholesterol API is often utilized in targeted drug delivery systems as it is considered to be an efficient drug carrier for monoclonal antibodies. Growing need for vaccines and drug delivery systems, as well as various beneficial properties of cholesterol, will drive growth in the market during the upcoming decade.
However, there is a general lack of formalized government guidelines regarding good manufacturing and distribution practices in the cholesterol API and other formulation-based excipients industries.
But, as more companies are starting to adhere to guidelines on manufacturing and distribution mandated by the International Pharmaceutical Excipient Council (IPEC), the supply of better quality ingredients for drug manufacturing will pick up pace.
As a result of the aforementioned factors, it is anticipated that the global cholesterol API market is set to expand at a CAGR of 4.7% from 2022 to 2032.
Top Trend Pushing Demand for Cholesterol APIs
- Outsourcing of Manufacturing Capabilities
The pharmaceutical industry has witnessed rapid growth in terms of outsourcing of pharmaceutical services. Due to technological and regular operational hurdles, a large number of companies are outsourcing their lipid manufacturing operations to specialists.
Contracting a supplier for medical-grade lipids, for instance, allows companies to take advantage of new technologies used by the service provider, gain access to higher capacities, and improve their operational flexibility.
Leading manufacturers are striving to make their R&D effortless and are focusing on increasing the speed of drug manufacturing processes. It would enable them to reduce their overall drug development and manufacturing costs. It would further help contract development and manufacturing organizations (CDMOs) to have a strong run in the next decade owing to the cost-effectiveness achieved through outsourcing their manufacturing capabilities.
The need for niche competencies for manufacturing complex APIs has encouraged pharma companies to outsource production activities rather than manufacturing them in their own facilities. During the foreseeable years, this factor is expected to provide lucrative growth opportunities to key players in the global cholesterol API market.
Find your sweet spots for generating winning opportunities in this market.
Talk to AnalystWhat Factors Are Restraining the Demand for Cholesterol APIs?
Implementation of various stringent regulations by government agencies with ongoing expansion of the pharmaceutical industry worldwide may hamper growth. Regulatory bodies play a vital role in defining the requirements and legal procedures related to the drug development process in a country.
Regulations for manufacturing lipid-based excipients are not currently defined by any established guidelines. Even though the majority of manufacturers abide by IPEC rules, several industrial facilities still do not follow the same.
This often results in physical audits by regulatory agencies governed by several acts such as the 2012 U.S. Food and Drug Administration Safety and Innovation Act (FDASIA) and the EU Falsified Medicines Directive (FMD or Directive 2011/62/EU) to ensure a secure supply chain.
The majority of manufacturers noted that regulatory compliance is extremely difficult to achieve when multiple suppliers provide excipients. For instance, Pfizer reported having 4,000 excipient suppliers after its merger with Pharmacia in 2003.
If all of these 4,000 were to be audited, it would call for over 10 audits per day, which could lead the company to incur substantial regulatory costs. These factors may negatively affect the cholesterol API market.
Country-wise Insights
What Makes the U.S. a Highly Lucrative Market for Cholesterol APIs?
“Presence of Many API Manufacturing Companies to Drive the U.S. Market”
The U.S. held approximately 26.0% of share in the global market in 2021. It is projected to exhibit growth at a lucrative CAGR of 4.6% during the forecast period, finds FMI.
Presence of various renowned pharmaceutical companies in the U.S., and implementation of stringent government norms revolving around drug production are anticipated to push growth in the country.
What is the China Cholesterol API Market Outlook?
“API Manufacturing Companies in China to Invest in Supply Chain Expansions”
China generated a share of over 13.1% in 2021 in the global market and is expected to continue to grow favorably throughout the forecast period, says FMI. Growth is attributed to the presence of numerous local and international API manufacturers in China and their consistent investments in the expansion of supply chains around the globe.
How is the India Cholesterol API Market Progressing?
“India to Witness the Entry of International API Pharma Businesses by 2032”
India is set to exhibit a CAGR of nearly 5.9% in the South Asia cholesterol API market during the forecast period. As per FMI, the country is projected to generate a share of nearly 7.5% by the end of 2032.
Presence of numerous generic API manufacturers in India, as well as expansion of the country’s pharmaceutical industry would drive the market. Besides, entry of a large number of international players in India owing to the availability of relatively low-cost raw materials and labor is projected to aid growth. Rapid expansion of the country’s bioprocess industry is also set to push the demand for cholesterol APIs.

An unified Market Research Subscription Platform, built for today’s disparate research needs.
Category-wise Insights
Which is the Highly Preferred Cholesterol API Source?
“Generic API Manufacturers to Look for Animal Derived Sources”
Animal derived sources are expected to showcase a CAGR of 3.9% during the forecast period. As per FMI, the segment is projected to hold the largest cholesterol API market share of about 48.2% in 2032.
Animal derived sources of cholesterol API are readily available and have been extensively used in the past few years for the manufacturing of biopharmaceuticals. Widespread use of materials sourced from animals is attributed to its high market share.
However, synthetic sources are more advantageous than those derived from animals and the segment is predicted to expand at a profitable CAGR of 6.0% over the next decade.
Which Manufacturing Process is Mainly Used to Produce Cholesterol APIs?
“Active Pharmaceutical Ingredient Production Companies to Opt for GMP”
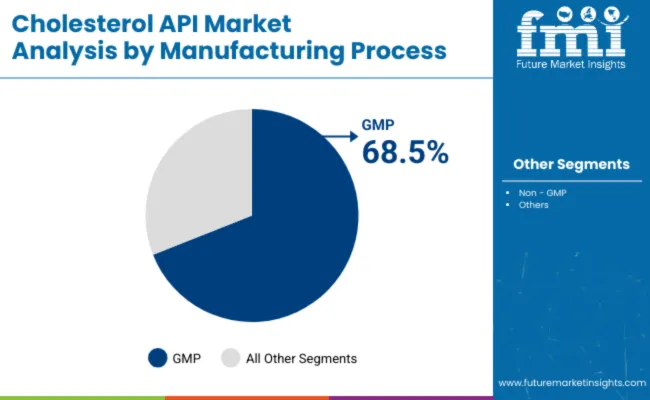
The GMP segment held a revenue share of around 68.9% in 2021 and is expected to exhibit moderate growth over the forecast period. It is set to generate a market share of around 65.9% in 2032, says FMI. High demand for pharmaceutical-grade cholesterol for RNA vaccines and monoclonal antibodies, as well as other drug delivery systems is likely to drive the segment.
Which is the Leading End User Segment in the Cholesterol API Market?
“API Manufacturing Companies to Engage in the Production of Monoclonal Antibodies”
The monoclonal antibodies segment held the highest market share of about 58.1% in 2021. Cholesterol APIs are extensively used in monoclonal antibodies, especially for highly specific targeted therapy in cancer drugs.
Competitive Landscape
The global cholesterol API market is highly fragmented with the presence of a large number of companies. To meet high consumer demand and expand their customer base, these companies are implementing various strategies such as mergers & acquisitions, partnerships, collaborations, and new product launches.
Some of the recent developments in the global cholesterol API market are
- In December 2021, CordenPharma and Wacker announced signing of a R&D collaboration agreement to expand their position in the field of lipid nanoparticles (LNP) formulations.
- In June 2021, Centrient Pharmaceuticals, a leading provider of next-generation statins and sustainable antibiotics, started the production of its novel statins manufacturing unit. The company is aiming to double its statins production capacity to help meet the high demand for Rosuvastatin and Atorvastatin APIs.
Scope of the Report
Attribute |
Details |
Estimated Market Size (2022) |
US$ 269.0 Mn |
Projected Market Valuation (2032) |
US$ 426.9 Mn |
Value-based CAGR (2022-2032) |
4.7% |
Forecast Period |
2022-2032 |
Historical Data Available for |
2017-2021 |
Market Analysis |
Value (US$ Mn) |
Key Regions Covered |
North America, Latin America, Europe, South Asia, East Asia, Oceania, and the Middle East & Africa |
Key Countries Covered |
U.S., Canada, Brazil, Mexico, Argentina, U.K., Germany, Italy, Russia, Spain, France, BENELUX, Nordic Countries, Russia, India, Thailand, Indonesia, Malaysia, Vietnam, Philippines Japan, China, South Korea, Australia, New Zealand, Turkey, GCC, North Africa, Israel, North Africa, and South Africa |
Key Market Segments Covered |
Source, Manufacturing Process, End User, and Region |
Key Companies Profiled |
|
Report Coverage |
Revenue Forecast, Volume Forecast, Company Ranking, Competitive Landscape, Growth Factors, Trends and Pricing Analysis |
Cholesterol API Market Outlook by Category
By Source:
- Animal Derived
- Plant Derived
- Synthetic
By Manufacturing Process:
- GMP
- Non – GMP
By End User:
- RNA Vaccines
- Monoclonal Antibodies
- Others
By Region:
- North America
- Latin America
- Europe
- South Asia
- East Asia
- Oceania
- The Middle East and Africa (MEA)
Frequently Asked Questions
The global cholesterol API market was worth US$ 258.4 Mn in 2021 and is set to expand 1.6x over the next ten years.
The cholesterol API market is expected to reach US$ 426.9 Mn by 2032 and is expected to register 4.7% CAGR from 2022 to 2032.
Increasing adoption of continuous processing of liposomal excipients and surging demand for quality by design (QbD) over conventional processes are some of the key trends in this market.
The U.S., China, India, Japan, and Germany are the top 5 countries driving demand for cholesterol API.
In North America, the U.S. accounted for about 94.5% of the cholesterol API market share in 2021.
The cholesterol API market in South Asia is expected to register a CAGR of 5.3% over the next ten years.
Demand for cholesterol API in Europe is expected to register a CAGR of 4.2% over the next ten years.
The U.S., China, and India are the key producers of cholesterol API.
Merck KGaA, Cayman Chemical Company (Matreya), CordenPharma, Croda International Plc (Avanti), NOF (Nippon Oil & Fats) Corporation, and Nippon Fine Chemical Co. Ltd. are some of the key players in the cholesterol API market.
The market for cholesterol API expanded at a CAGR of 3.6% during the historical period from 2017 to 2021.
Table of Content
1. Executive Summary
1.1. Global Market Outlook
1.2. Demand Side Trends
1.3. Supply Side Trends
1.4. Analysis and Recommendations
2. Market Overview
2.1. Market Coverage / Taxonomy
2.2. Market Definition / Scope / Limitations
2.3. Inclusions and Exclusions
3. Key Market Trends
3.1. Key Trends Impacting the Market
3.2. Product Innovation / Development Trends
4. Value Added Insights
4.1. Cholesterol API Price Per Kilogram, by Region
4.1.1. GMP
4.1.2. Non-GMP
4.2. Triglycerides Market Insights
4.2.1. End User Market Insights
4.3. Product Adoption Analysis by Region
4.4. Product Features/USPs Analysis
4.5. Regulatory Landscape
4.6. Key Marketing & Promotional Strategies Adopted by Companies
4.7. PESTLE Analysis
4.8. Porter’s Analysis
5. Market Background
5.1. Macro-Economic Factors
5.1.1. Global GDP Growth Outlook
5.1.2. Global Healthcare Spending Outlook
5.2. Forecast Factors - Relevance & Impact
5.2.1. R&D Spending
5.2.2. Pharmaceutical Industry Growth
5.2.3. GDP Growth
5.2.4. Raw Material Prices
5.2.5. Increase in Outsourced Manufacturing Activity
5.2.6. Increase in Demand for GMP products
5.2.7. Research in Liposomal Formulations
5.2.8. Number of Patents for Novel Drug Delivery Platforms
5.3. Market Dynamics
5.3.1. Drivers
5.3.2. Restraints
5.3.3. Opportunity Analysis
6. COVID-19 Crisis Analysis
6.1. COVID-19 and Impact Analysis
6.1.1. Revenue By Source
6.1.2. Revenue By Manufacturing Process
6.1.3. Revenue By End User
6.2. 2021 Market Scenario
7. Global Cholesterol API Market Volume (Kgs) Analysis 2017-2021 and Forecast, 2022-2032
7.1. Historical Market Volume (Kgs) Analysis, 2017-2021
7.2. Current and Market Volume ( Kgs) Projections, 2022-2032
7.2.1. Y-o-Y Growth Trend Analysis
8. Global Cholesterol API Market Demand (in Value or Size in US$ Mn) Analysis 2017–2021 and Forecast, 2022–2032
8.1. Historical Market Value (US$ Mn) Analysis, 2017–2021
8.2. Current and Future Market Value (US$ Mn) Projections, 2022–2032
8.2.1. Y-o-Y Growth Trend Analysis
8.2.2. Absolute $ Opportunity Analysis
9. Global Cholesterol API Market Analysis 2017–2021 and Forecast 2022–2032, By Source
9.1. Introduction / Key Findings
9.2. Historical Market Size (US$ Mn), By Source, 2017–2021
9.3. Current and Future Market Size (US$ Mn) and Forecast By Source, 2022–2032
9.3.1. Animal Derived
9.3.2. Plant Derived
9.3.3. Synthetic
9.4. Market Attractiveness Analysis By Source
10. Global Cholesterol API Market Analysis 2017–2021 and Forecast 2022–2032, By Manufacturing Process
10.1. Introduction / Key Findings
10.2. Historical Market Size (US$ Mn), By Manufacturing Process, 2017–2021
10.3. Current and Future Market Size (US$ Mn) and Forecast By Manufacturing Process, 2022–2032
10.3.1. GMP
10.3.2. Non-GMP
10.4. Market Attractiveness Analysis By Manufacturing Process
11. Global Cholesterol API Market Analysis 2017–2021 and Forecast 2022–2032, by End User
11.1. Introduction / Key Findings
11.2. Historical Market Size (US$ Mn), By End User, 2017–2021
11.3. Current and Future Market Size (US$ Mn) and Forecast By End User, 2022–2032
11.3.1. RNA Vaccines
11.3.2. Monoclonal Antibodies
11.3.3. Others
11.4. Market Attractiveness Analysis By End User
12. Global Cholesterol API Market Analysis 2017–2021 and Forecast 2022–2032, by Region
12.1. Introduction
12.2. Historical Market Size (US$ Mn) Trend Analysis By Region, 2017–2021
12.3. Current and Future Market Size (US$ Mn) and Volume Analysis Forecast By Region, 2022–2032
12.3.1. North America
12.3.2. Latin America
12.3.3. Europe
12.3.4. East Asia
12.3.5. South Asia
12.3.6. Oceania
12.3.7. Middle East and Africa (MEA)
12.4. Market Attractiveness Analysis By Region
13. North America Cholesterol API Market Analysis 2017–2021 and Forecast 2022–2032
13.1. Introduction
13.2. Historical Market Size (US$ Mn) Trend Analysis By Market Taxonomy, 2017–2021
13.3. Current and Future Market Size (US$ Mn) and Volume Forecast By Market Taxonomy, 2022–2032
13.3.1. By Country
13.3.1.1. U.S.
13.3.1.2. Canada
13.3.2. By Source
13.3.3. By Manufacturing Process
13.3.4. By End User
13.4. Market Attractiveness Analysis
13.4.1. By Country
13.4.2. By Source
13.4.3. By Manufacturing Process
13.4.4. By End User
13.5. Key Market Participants - Intensity Mapping
13.6. Drivers and Restraints - Impact Analysis
13.7. Country Level Analysis & Forecast
13.7.1. U.S. Cholesterol API Market Analysis
13.7.1.1. Introduction
13.7.1.2. Market Analysis and Forecast by Market Taxonomy
13.7.1.2.1. By Source
13.7.1.2.2. By Manufacturing Process
13.7.1.2.3. By End User
13.7.2. Canada Cholesterol API Market Analysis
13.7.2.1. Introduction
13.7.2.2. Market Analysis and Forecast by Market Taxonomy
13.7.2.2.1. By Source
13.7.2.2.2. By Manufacturing Process
13.7.2.2.3. By End User
14. Latin America Cholesterol API Market Analysis 2017–2021 and Forecast 2022–2032
14.1. Introduction
14.2. Historical Market Size (US$ Mn) Trend Analysis By Market Taxonomy, 2017–2021
14.3. Current and Future Market Size (US$ Mn) and Volume Forecast By Market Taxonomy, 2022–2032
14.3.1. By Country
14.3.1.1. Mexico
14.3.1.2. Brazil
14.3.1.3. Argentina
14.3.1.4. Rest of Latin America
14.3.2. By Source
14.3.3. By Manufacturing Process
14.3.4. By End User
14.4. Market Attractiveness Analysis
14.4.1. By Country
14.4.2. By Source
14.4.3. By Manufacturing Process
14.4.4. By End User
14.5. Key Market Participants - Intensity Mapping
14.6. Drivers and Restraints - Impact Analysis
14.7. Country Level Analysis & Forecast
14.7.1. Mexico Cholesterol API Market Analysis
14.7.1.1. Introduction
14.7.1.2. Market Analysis and Forecast by Market Taxonomy
14.7.1.2.1. By Source
14.7.1.2.2. By Manufacturing Process
14.7.1.2.3. By End User
14.7.2. Brazil Cholesterol API Market Analysis
14.7.2.1. Introduction
14.7.2.2. Market Analysis and Forecast by Market Taxonomy
14.7.2.2.1. By Source
14.7.2.2.2. By Manufacturing Process
14.7.2.2.3. By End User
14.7.3. Argentina Cholesterol API Market Analysis
14.7.3.1. Introduction
14.7.3.2. Market Analysis and Forecast by Market Taxonomy
14.7.3.2.1. By Source
14.7.3.2.2. By Manufacturing Process
14.7.3.2.3. By End User
15. Europe Cholesterol API Market Analysis 2017–2021 and Forecast 2022–2032
15.1. Introduction
15.2. Historical Market Size (US$ Mn) Analysis By Market Taxonomy, 2017–2021
15.3. Current and Future Market Size (US$ Mn) and Forecast By Market Taxonomy, 2022–2032
15.3.1. By Country
15.3.1.1. Germany
15.3.1.2. Italy
15.3.1.3. France
15.3.1.4. U.K.
15.3.1.5. Spain
15.3.1.6. BENELUX
15.3.1.7. Nordic Countries
15.3.1.8. Russia
15.3.1.9. Rest of Europe
15.3.2. By Source
15.3.3. By Manufacturing Process
15.3.4. By End User
15.4. Market Attractiveness Analysis
15.4.1. By Country
15.4.2. By Source
15.4.3. By Manufacturing Process
15.4.4. By End User
15.5. Key Market Participants - Intensity Mapping
15.6. Drivers and Restraints - Impact Analysis
15.7. Country Level Analysis & Forecast
15.7.1. Germany Cholesterol API Market Analysis
15.7.1.1. Introduction
15.7.1.2. Market Analysis and Forecast by Market Taxonomy
15.7.1.2.1. By Source
15.7.1.2.2. By Manufacturing Process
15.7.1.2.3. By End User
15.7.2. Italy Cholesterol API Market Analysis
15.7.2.1. Introduction
15.7.2.2. Market Analysis and Forecast by Market Taxonomy
15.7.2.2.1. By Source
15.7.2.2.2. By Manufacturing Process
15.7.2.2.3. By End User
15.7.3. France Cholesterol API Market Analysis
15.7.3.1. Introduction
15.7.3.2. Market Analysis and Forecast by Market Taxonomy
15.7.3.2.1. By Source
15.7.3.2.2. By Manufacturing Process
15.7.3.2.3. By End User
15.7.4. U.K. Cholesterol API Market Analysis
15.7.4.1. Introduction
15.7.4.2. Market Analysis and Forecast by Market Taxonomy
15.7.4.2.1. By Source
15.7.4.2.2. By Manufacturing Process
15.7.4.2.3. By End User
15.7.5. Spain Cholesterol API Market Analysis
15.7.5.1. Introduction
15.7.5.2. Market Analysis and Forecast by Market Taxonomy
15.7.5.2.1. By Source
15.7.5.2.2. By Manufacturing Process
15.7.5.2.3. By End User
15.7.6. BENELUX Cholesterol API Market Analysis
15.7.6.1. Introduction
15.7.6.2. Market Analysis and Forecast by Market Taxonomy
15.7.6.2.1. By Source
15.7.6.2.2. By Manufacturing Process
15.7.6.2.3. By End User
15.7.7. Nordic Countries Cholesterol API Market Analysis
15.7.7.1. Introduction
15.7.7.2. Market Analysis and Forecast by Market Taxonomy
15.7.7.2.1. By Source
15.7.7.2.2. By Manufacturing Process
15.7.7.2.3. By End User
15.7.8. Russia Cholesterol API Market Analysis
15.7.8.1. Introduction
15.7.8.2. Market Analysis and Forecast by Market Taxonomy
15.7.8.2.1. By Source
15.7.8.2.2. By Manufacturing Process
15.7.8.2.3. By End User
16. East Asia Cholesterol API Market Analysis 2017–2021 and Forecast 2022–2032
16.1. Introduction
16.2. Historical Market Size (US$ Mn) Trend Analysis By Market Taxonomy, 2017–2021
16.3. Current and Future Market Size (US$ Mn) and Volume Forecast By Market Taxonomy, 2022–2032
16.3.1. By Country
16.3.1.1. China
16.3.1.2. Japan
16.3.1.3. South Korea
16.3.2. By Source
16.3.3. By Manufacturing Process
16.3.4. By End User
16.4. Market Attractiveness Analysis
16.4.1. By Country
16.4.2. By Source
16.4.3. By Manufacturing Process
16.4.4. By End User
16.5. Key Market Participants - Intensity Mapping
16.6. Drivers and Restraints - Impact Analysis
16.7. Country Level Analysis & Forecast
16.7.1. China Cholesterol API Market Analysis
16.7.1.1. Introduction
16.7.1.2. Market Analysis and Forecast by Market Taxonomy
16.7.1.2.1. By Source
16.7.1.2.2. By Manufacturing Process
16.7.1.2.3. By End User
16.7.2. Japan Cholesterol API Market Analysis
16.7.2.1. Introduction
16.7.2.2. Market Analysis and Forecast by Market Taxonomy
16.7.2.2.1. By Source
16.7.2.2.2. By Manufacturing Process
16.7.2.2.3. By End User
16.7.3. South Korea Cholesterol API Market Analysis
16.7.3.1. Introduction
16.7.3.2. Market Analysis and Forecast by Market Taxonomy
16.7.3.2.1. By Source
16.7.3.2.2. By Manufacturing Process
16.7.3.2.3. By End User
17. South Asia Cholesterol API Market Analysis 2017–2021 and Forecast 2022–2032
17.1. Introduction
17.2. Historical Market Size (US$ Mn) Trend Analysis By Market Taxonomy, 2017–2021
17.3. Current and Future Market Size (US$ Mn) and Volume Forecast By Market Taxonomy, 2022–2032
17.3.1. By Country
17.3.1.1. India
17.3.1.2. Indonesia
17.3.1.3. Malaysia
17.3.1.4. Philippines
17.3.1.5. Thailand
17.3.1.6. Vietnam
17.3.1.7. Rest of South Asia
17.3.2. By Source
17.3.3. By Manufacturing Process
17.3.4. By End User
17.4. Market Attractiveness Analysis
17.4.1. By Country
17.4.2. By Source
17.4.3. By Manufacturing Process
17.4.4. By End User
17.5. Key Market Participants - Intensity Mapping
17.6. Drivers and Restraints - Impact Analysis
17.7. Country Level Analysis & Forecast
17.7.1. India Cholesterol API Market Analysis
17.7.1.1. Introduction
17.7.1.2. Market Analysis and Forecast by Market Taxonomy
17.7.1.2.1. By Source
17.7.1.2.2. By Manufacturing Process
17.7.1.2.3. By End User
17.7.2. Indonesia Cholesterol API Market Analysis
17.7.2.1. Introduction
17.7.2.2. Market Analysis and Forecast by Market Taxonomy
17.7.2.2.1. By Source
17.7.2.2.2. By Manufacturing Process
17.7.2.2.3. By End User
17.7.3. Malaysia Cholesterol API Market Analysis
17.7.3.1. Introduction
17.7.3.2. Market Analysis and Forecast by Market Taxonomy
17.7.3.2.1. By Source
17.7.3.2.2. By Manufacturing Process
17.7.3.2.3. By End User
17.7.4. Philippines Cholesterol API Market Analysis
17.7.4.1. Introduction
17.7.4.2. Market Analysis and Forecast by Market Taxonomy
17.7.4.2.1. By Source
17.7.4.2.2. By Manufacturing Process
17.7.4.2.3. By End User
17.7.5. Thailand Cholesterol API Market Analysis
17.7.5.1. Introduction
17.7.5.2. Market Analysis and Forecast by Market Taxonomy
17.7.5.2.1. By Source
17.7.5.2.2. By Manufacturing Process
17.7.5.2.3. By End User
17.7.6. Vietnam Cholesterol API Market Analysis
17.7.6.1. Introduction
17.7.6.2. Market Analysis and Forecast by Market Taxonomy
17.7.6.2.1. By Source
17.7.6.2.2. By Manufacturing Process
17.7.6.2.3. By End User
18. Oceania Cholesterol API Market 2017-2021 and Forecast 2022-2032
18.1. Introduction
18.2. Historical Market Size (US$ Mn) Trend Analysis By Market Taxonomy, 2017–2021
18.3. Current and Future Market Size (US$ Mn) and Volume Forecast By Market Taxonomy, 2022–2032
18.3.1. By Country
18.3.1.1. Australia
18.3.1.2. New Zealand
18.3.2. By Source
18.3.3. By Manufacturing Process
18.3.4. By End User
18.4. Market Attractiveness Analysis
18.4.1. By Country
18.4.2. By Source
18.4.3. By Manufacturing Process
18.4.4. By End User
18.5. Key Market Participants - Intensity Mapping
18.6. Drivers and Restraints - Impact Analysis
18.7. Country Level Analysis & Forecast
18.7.1. Australia Cholesterol API Market Analysis
18.7.1.1. Introduction
18.7.1.2. Market Analysis and Forecast by Market Taxonomy
18.7.1.2.1. By Source
18.7.1.2.2. By Manufacturing Process
18.7.1.2.3. By End User
18.7.2. New Zealand Cholesterol API Market Analysis
18.7.2.1. Introduction
18.7.2.2. Market Analysis and Forecast by Market Taxonomy
18.7.2.2.1. By Source
18.7.2.2.2. By Manufacturing Process
18.7.2.2.3. By End User
19. Middle East and Africa (MEA) Cholesterol API Market Analysis 2017–2021 and Forecast 2022–2032
19.1. Introduction
19.2. Historical Market Size (US$ Mn) Trend Analysis By Market Taxonomy, 2017–2021
19.3. Current and Future Market Size (US$ Mn) and Volume Forecast By Market Taxonomy, 2022–2032
19.3.1. By Country
19.3.1.1. GCC Countries
19.3.1.2. Israel
19.3.1.3. Turkey
19.3.1.4. South Africa
19.3.1.5. North Africa
19.3.1.6. Rest of Middle East and Africa
19.3.2. By Source
19.3.3. By Manufacturing Process
19.3.4. By End User
19.4. Market Attractiveness Analysis
19.4.1. By Country
19.4.2. By Source
19.4.3. By Manufacturing Process
19.4.4. By End User
19.5. Key Market Participants - Intensity Mapping
19.6. Drivers and Restraints - Impact Analysis
19.7. Country Level Analysis & Forecast
19.7.1. GCC Countries Cholesterol API Market Analysis
19.7.1.1. Introduction
19.7.1.2. Market Analysis and Forecast by Market Taxonomy
19.7.1.2.1. By Source
19.7.1.2.2. By Manufacturing Process
19.7.1.2.3. By End User
19.7.2. Israel Cholesterol API Market Analysis
19.7.2.1. Introduction
19.7.2.2. Market Analysis and Forecast by Market Taxonomy
19.7.2.2.1. By Source
19.7.2.2.2. By Manufacturing Process
19.7.2.2.3. By End User
19.7.3. Turkey Cholesterol API Market Analysis
19.7.3.1. Introduction
19.7.3.2. Market Analysis and Forecast by Market Taxonomy
19.7.3.2.1. By Source
19.7.3.2.2. By Manufacturing Process
19.7.3.2.3. By End User
19.7.4. South Africa Cholesterol API Market Analysis
19.7.4.1. Introduction
19.7.4.2. Market Analysis and Forecast by Market Taxonomy
19.7.4.2.1. By Source
19.7.4.2.2. By Manufacturing Process
19.7.4.2.3. By End User
19.7.5. North Africa Cholesterol API Market Analysis
19.7.5.1. Introduction
19.7.5.2. Market Analysis and Forecast by Market Taxonomy
19.7.5.2.1. By Source
19.7.5.2.2. By Manufacturing Process
19.7.5.2.3. By End User
20. Market Structure Analysis
20.1. Market Analysis by Tier of Companies
20.2. Market Share Analysis of Top Players
21. Competition Analysis
21.1. Competition Dashboard
21.2. Competition Benchmarking
21.3. Competition Deep Dive
21.3.1. Merck KGaA
21.3.1.2. Overview
21.3.1.3. Product Portfolio
21.3.1.4. Sales Footprint
21.3.1.5. Key Financial
21.3.1.6. Key Developments
21.3.1.7. SWOT Analysis
21.3.1.8. Strategy Overview
21.3.1.8.1. Product Stratgies
21.3.1.8.2. Marketing Strategies
21.3.1.8.3. Channel Strategies
21.3.2. Cayman Chemical Company (Matreya)
21.3.2.1. Overview
21.3.2.2. Product Portfolio
21.3.2.3. Sales Footprint
21.3.2.4. Key Financial
21.3.2.5. Key Developments
21.3.2.6. SWOT Analysis
21.3.2.7. Strategy Overview
21.3.2.7.1. Product Stratgies
21.3.2.7.2. Marketing Strategies
21.3.2.7.3. Channel Strategies
21.3.3. CordenPharma
21.3.3.1. Overview
21.3.3.2. Product Portfolio
21.3.3.3. Sales Footprint
21.3.3.4. Key Financial
21.3.3.5. Key Developments
21.3.3.6. SWOT Analysis
21.3.3.7. Strategy Overview
21.3.3.7.1. Product Stratgies
21.3.3.7.2. Marketing Strategies
21.3.3.7.3. Channel Strategies
21.3.4. Croda International Plc (Avanti)
21.3.4.1. Overview
21.3.4.2. Product Portfolio
21.3.4.3. Sales Footprint
21.3.4.4. Key Financial
21.3.4.5. Key Developments
21.3.4.6. SWOT Analysis
21.3.4.7. Strategy Overview
21.3.4.7.1. Product Stratgies
21.3.4.7.2. Marketing Strategies
21.3.4.7.3. Channel Strategies
21.3.5. NOF (Nippon Oil & Fats) Corporation
21.3.5.1. Overview
21.3.5.2. Product Portfolio
21.3.5.3. Sales Footprint
21.3.5.4. Key Financial
21.3.5.5. Key Developments
21.3.5.6. SWOT Analysis
21.3.5.7. Strategy Overview
21.3.5.7.1. Product Stratgies
21.3.5.7.2. Marketing Strategies
21.3.5.7.3. Channel Strategies
21.3.6. Nippon Fine Chemical Co. Ltd.
21.3.6.1. Overview
21.3.6.2. Product Portfolio
21.3.6.3. Sales Footprint
21.3.6.4. Key Financial
21.3.6.5. Key Developments
21.3.6.6. SWOT Analysis
21.3.6.7. Strategy Overview
21.3.6.7.1. Product Stratgies
21.3.6.7.2. Marketing Strategies
21.3.6.7.3. Channel Strategies
21.3.7. Akums Drugs & Pharmaceuticals Ltd
21.3.7.1. Overview
21.3.7.2. Product Portfolio
21.3.7.3. Sales Footprint
21.3.7.4. Key Financial
21.3.7.5. Key Developments
21.3.7.6. SWOT Analysis
21.3.7.7. Strategy Overview
21.3.7.7.1. Product Stratgies
21.3.7.7.2. Marketing Strategies
21.3.7.7.3. Channel Strategies
21.3.8. Tokyo Chemical Industry Co., Ltd.
21.3.8.1. Overview
21.3.8.2. Product Portfolio
21.3.8.3. Sales Footprint
21.3.8.4. Key Financial
21.3.8.5. Key Developments
21.3.8.6. SWOT Analysis
21.3.8.7. Strategy Overview
21.3.8.7.1. Product Stratgies
21.3.8.7.2. Marketing Strategies
21.3.8.7.3. Channel Strategies
21.3.9. Evonik Industries AG
21.3.9.1. Overview
21.3.9.2. Product Portfolio
21.3.9.3. Sales Footprint
21.3.9.4. Key Financial
21.3.9.5. Key Developments
21.3.9.6. SWOT Analysis
21.3.9.7. Strategy Overview
21.3.9.7.1. Product Stratgies
21.3.9.7.2. Marketing Strategies
21.3.9.7.3. Channel Strategies
21.3.10. Dishman Group
21.3.10.1. Overview
21.3.10.2. Product Portfolio
21.3.10.3. Sales Footprint
21.3.10.4. Key Financial
21.3.10.5. Key Developments
21.3.10.6. SWOT Analysis
21.3.10.7. Strategy Overview
21.3.10.7.1. Product Stratgies
21.3.10.7.2. Marketing Strategies
21.3.10.7.3. Channel Strategies
21.3.11. Hänseler AG
21.3.11.1. Overview
21.3.11.2. Product Portfolio
21.3.11.3. Sales Footprint
21.3.11.4. Key Financial
21.3.11.5. Key Developments
21.3.11.6. SWOT Analysis
21.3.11.7. Strategy Overview
21.3.11.7.1. Product Stratgies
21.3.11.7.2. Marketing Strategies
21.3.11.7.3. Channel Strategies
21.3.12. Caesar & Loretz GmbH
21.3.12.1. Overview
21.3.12.2. Product Portfolio
21.3.12.3. Sales Footprint
21.3.12.4. Key Financial
21.3.12.5. Key Developments
21.3.12.6. SWOT Analysis
21.3.12.7. Strategy Overview
21.3.12.7.1. Product Stratgies
21.3.12.7.2. Marketing Strategies
21.3.12.7.3. Channel Strategies
21.3.13. Fisher Scientific Co, LLC (Thermo Fisher)
21.3.13.1. Overview
21.3.13.2. Product Portfolio
21.3.13.3. Sales Footprint
21.3.13.4. Key Financial
21.3.13.5. Key Developments
21.3.13.6. SWOT Analysis
21.3.13.7. Strategy Overview
21.3.13.7.1. Product Stratgies
21.3.13.7.2. Marketing Strategies
21.3.13.7.3. Channel Strategies
22. Assumptions and Acronyms Used
23. Research Methodology
Let us know your requirement to get
100% FREE customization
List of Tables
Table 01: Global Cholesterol API Market Size (US$ Mn)Analysis 2017–2021 and Forecast, 2022–2032, By Source
Table 02: Global Cholesterol API Market Size (US$ Mn)Analysis 2017–2021 and Forecast, 2022–2032, By Manufacturing Process
Table 03: Global Cholesterol API Market Size (US$ Mn)Analysis 2017–2021 and Forecast, 2022–2032, By Manufacturing Process
Table 04: Global Cholesterol API Market Size (US$ Mn)Analysis 2017–2021 and Forecast, 2022–2032, By End User
Table 05: Global Cholesterol API Market Volume (Kgs) Analysis 2017–2021 and Forecast, 2022–2032, By Region
Table 06: Global Cholesterol API Market Size (US$ Mn)Analysis 2017–2021 and Forecast, 2022–2032, By Region
Table 07: North America Cholesterol API Market Size (US$ Mn)Analysis 2017–2021 and Forecast 2022–2032, by Country
Table 08: North America Cholesterol API Market Size (US$ Mn) Analysis 2017–2021 and Forecast, 2022–2032, By Source
Table 09: North America Cholesterol API Market Size Volume (Kgs) Analysis 2017–2021 and Forecast, 2022–2032, By Manufacturing process
Table 10: North America Cholesterol API Market Size (US$ Mn)Analysis 2017–2021 and Forecast, 2022–2032, By Manufacturing process
Table 11: North America Cholesterol API Market Value (US$ Mn)Analysis 2017–2021 and Forecast, 2022–2032, By End User
Table 12: Latin America Cholesterol API Market Size (US$ Mn)Analysis 2017–2021 and Forecast 2022–2032, by Country
Table 13: Latin America Cholesterol API Market Size (US$ Mn) Analysis 2017–2021 and Forecast, 2022–2032, By Source
Table 14: Latin America Cholesterol API Market Volume (Kgs) Analysis 2017–2021 and Forecast, 2022–2032, By Manufacturing process
Table 15: Latin America Cholesterol API Market Size (US$ Mn)Analysis 2017–2021 and Forecast, 2022–2032, By Manufacturing process
Table 16: Latin America Cholesterol API Market Value (US$ Mn)Analysis 2017–2021 and Forecast, 2022–2032, By End User
Table 17: Europe Cholesterol API Market Size (US$ Mn)Analysis 2017–2021 and Forecast 2022–2032, by Country
Table 18: Europe Cholesterol API Market Size (US$ Mn) Analysis 2017–2021 and Forecast, 2022–2032, By Source
Table 19: Europe Cholesterol API Market Volume (Kgs) Analysis 2017–2021 and Forecast, 2022–2032, By Manufacturing process
Table 20: Europe Cholesterol API Market Size (US$ Mn)Analysis 2017–2021 and Forecast, 2022–2032, By Manufacturing process
Table 21: Europe Cholesterol API Market Value (US$ Mn)Analysis 2017–2021 and Forecast, 2022–2032, By End User
Table 22: East Asia Cholesterol API Market Size (US$ Mn)Analysis 2017–2021 and Forecast 2022–2032, by Country
Table 23: East Asia Cholesterol API Market Size (US$ Mn) Analysis 2017–2021 and Forecast, 2022–2032, By Source
Table 24: East Asia Cholesterol API Market Volume (Kgs) Analysis 2017–2021 and Forecast, 2022–2032, By Manufacturing process
Table 25: East Asia Cholesterol API Market Size (US$ Mn)Analysis 2017–2021 and Forecast, 2022–2032, By Manufacturing process
Table 26: East Asia Cholesterol API Market Value (US$ Mn)Analysis 2017–2021 and Forecast, 2022–2032, By End User
Table 27: South Asia Cholesterol API Market Size (US$ Mn)Analysis 2017–2021 and Forecast 2022–2032, by Country
Table 28: South Asia Cholesterol API Market Size (US$ Mn) Analysis 2017–2021 and Forecast, 2022–2032, By Source
Table 29: South Asia Cholesterol API Market Volume (Kgs) Analysis 2017–2021 and Forecast, 2022–2032, By Manufacturing process
Table 30: South Asia Cholesterol API Market Size (US$ Mn)Analysis 2017–2021 and Forecast, 2022–2032, By Manufacturing process
Table 31: South Asia Cholesterol API Market Value (US$ Mn)Analysis 2017–2021 and Forecast, 2022–2032, By End User
Table 32: Oceania Cholesterol API Market Size (US$ Mn)Analysis 2017–2021 and Forecast 2022–2032, by Country
Table 33: Oceania Cholesterol API Market Size (US$ Mn) Analysis 2017–2021 and Forecast, 2022–2032, By Source
Table 34: Oceania Cholesterol API Market Volume (Kgs) Analysis 2017–2021 and Forecast, 2022–2032, By Manufacturing Process
Table 35: Oceania Cholesterol API Market Size (US$ Mn)Analysis 2017–2021 and Forecast, 2022–2032, By Manufacturing process
Table 36: Oceania Cholesterol API Market Value (US$ Mn)Analysis 2017–2021 and Forecast, 2022–2032, By End User
Table 37: Middle East & Africa (MEA) Cholesterol API Market Size (US$ Mn)Analysis 2017–2021 and Forecast 2022–2032, by Country
Table 38: Middle East & Africa (MEA) Cholesterol API Market Size (US$ Mn) Analysis 2017–2021 and Forecast, 2022–2032, By Source
Table 39: Middle East & Africa (MEA) Cholesterol API Market Volume (Kgs) Analysis 2017–2021 and Forecast, 2022–2032, By Manufacturing Process
Table 40: Middle East & Africa (MEA) Cholesterol API Market Size (US$ Mn)Analysis 2017–2021 and Forecast, 2022–2032, By Manufacturing process
Table 41: Middle East & Africa (MEA) Cholesterol API Market Value (US$ Mn)Analysis 2017–2021 and Forecast, 2022–2032, By End User
Find your sweet spots for generating winning opportunities in this market.
Talk to AnalystList of Charts
Figure 01: Global Cholesterol API Market Volume (Kgs) Analysis, 2017–2021
Figure 02: Global Cholesterol API Market Volume (Kgs) & Y-o-Y Growth (%) Forecast, 2022–2032
Figure 03: Global Cholesterol API Market Size (US$ Mn) Analysis, 2017–2021
Figure 04: Global Cholesterol API Market Size (US$ Mn)) & Y-o-Y Growth (%) Forecast, 2022–2032
Figure 05: Global Cholesterol API Market Absolute $ Opportunity Analysis, 2022–2032
Figure 06: Global Cholesterol API Market Analysis By Source–2022 & 2032
Figure 07: Global Cholesterol API Market Y-o-Y Growth Projections By Source, 2022 – 2032
Figure 08: Global Cholesterol API Market Attractiveness Analysis, By Source, 2022-2032
Figure 09: Global Cholesterol API Market Analysis By Manufacturing Process –2022 & 2032
Figure 10: Global Cholesterol API Market Y-o-Y Growth Projections By Manufacturing Process, 2022 – 2032
Figure 11: Global Cholesterol API Market Attractiveness Analysis, By Manufacturing Process, 2022-2032
Figure 12: Global Cholesterol API Market Analysis By End User–2022 & 2032
Figure 13: Global Cholesterol API Market Y-o-Y Growth Projections By End User, 2022 – 2032
Figure 14: Global Cholesterol API Market Attractiveness Analysis, By End user, 2022-2032
Figure 15: Global Cholesterol API Market Analysis By Region–2022 & 2032
Figure 16: Global Cholesterol API Market Y-o-Y Growth Projections By Region, 2022 – 2032
Figure 17: Global Cholesterol API Market Attractiveness Analysis, By Region, 2022-2032
Figure 18: North America Cholesterol API Market Value Share, By Country (2022 E)
Figure 19: North America Cholesterol API Market Value Share, by Source (2022 E)
Figure 20: North America Cholesterol API Market Value Share, By Manufacturing Process (2022 E)
Figure 21: North America Cholesterol API Market Value Share, by End User (2022 E)
Figure 22: North America Cholesterol API Market Size (US$ Mn) Analysis, 2017–2021
Figure 23: North America Cholesterol API Market Size (US$ Mn)) & Y-o-Y Growth (%) Forecast, 2022–2032
Figure 24: North America Cholesterol API Market Attractiveness Analysis 2022-2032, By Country
Figure 25: North America Cholesterol API Market Attractiveness Analysis 2022-2032, By Source
Figure 26: North America Cholesterol API Market Attractiveness Analysis 2022-2032, By Manufacturing Process
Figure 27: North America Cholesterol API Market Attractiveness Analysis 2022-2032, By End User
Figure 28: U.S. Market Value Proportion Analysis (2021)
Figure 29: Global Vs U.S. Growth Comparison
Figure 30: U.S. Cholesterol API Market Share Analysis(%) By Source, 2022 & 2032
Figure 31: U.S. Cholesterol API Market Share Analysis(%) By Manufacturing Process, 2022 & 2032
Figure 32: U.S. Cholesterol API Market Share Analysis(%) By End User, 2022 & 2032
Figure 33: Canada Market Value Proportion Analysis (2021)
Figure 34: Global Vs Canada Growth Comparison
Figure 35: Canada Cholesterol API Market Share Analysis(%) By Source, 2022 & 2032
Figure 36: Canada Cholesterol API Market Share Analysis(%) By Manufacturing Process, 2022 & 2032
Figure 37: Canada Cholesterol API Market Share Analysis(%) By End User, 2022 & 2032
Figure 39: Latin America Cholesterol API Market Value Share, By Country (2022 E)
Figure 40: Latin America Cholesterol API Market Value Share, by Source (2022 E)
Figure 41: Latin America Cholesterol API Market Value Share, By Manufacturing Process (2022 E)
Figure 42: Latin America Cholesterol API Market Value Share, by End User (2022 E)
Figure 43: Latin America Cholesterol API Market Size (US$ Mn) Analysis, 2017–2021
Figure 44: Latin America Cholesterol API Market Size (US$ Mn)) & Y-o-Y Growth (%) Forecast, 2022–2032
Figure 45: Latin America Cholesterol API Market Attractiveness Analysis 2022-2032, By Country
Figure 46: Latin America Cholesterol API Market Attractiveness Analysis 2022-2032, By Source
Figure 47: Latin America Cholesterol API Market Attractiveness Analysis 2022-2032, By Manufacturing Process
Figure 48: Latin America Cholesterol API Market Attractiveness Analysis 2022-2032, By End User
Figure 49: Mexico Market Value Proportion Analysis (2021)
Figure 50: Global Vs Mexico Growth Comparison
Figure 51: Mexico Cholesterol API Market Share Analysis(%) By Source, 2022 & 2032
Figure 52: Mexico Cholesterol API Market Share Analysis(%) By Manufacturing Process, 2022 & 2032
Figure 53: Mexico Cholesterol API Market Share Analysis(%) By End User, 2022 & 2032
Figure 54: Brazil Market Value Proportion Analysis (2021)
Figure 55: Global Vs Brazil Growth Comparison
Figure 56: Brazil Cholesterol API Market Share Analysis(%) By Source, 2022 & 2032
Figure 57: Brazil Cholesterol API Market Share Analysis(%) By Manufacturing Process, 2022 & 2032
Figure 58: Brazil Cholesterol API Market Share Analysis(%) By End User, 2022 & 2032
Figure 59: Argentina Market Value Proportion Analysis (2021)
Figure 60: Global Vs Argentina Growth Comparison
Figure 61: Argentina Cholesterol API Market Share Analysis(%) By Source, 2022 & 2032
Figure 62: Argentina Cholesterol API Market Share Analysis(%) By Manufacturing Process, 2022 & 2032
Figure 63: Argentina Cholesterol API Market Share Analysis(%) By End User, 2022 & 2032
Figure 64: Europe Cholesterol API Market Value Share, By Country (2022 E)
Figure 65: Europe Cholesterol API Market Value Share, by Source (2022 E)
Figure 66: Europe Cholesterol API Market Value Share, By Manufacturing Process (2022 E)
Figure 67: Europe Cholesterol API Market Value Share, by End User (2022 E)
Figure 68: Europe Cholesterol API Market Size (US$ Mn) Analysis, 2017–2021
Figure 69: Europe Cholesterol API Market Size (US$ Mn)) & Y-o-Y Growth (%) Forecast, 2022–2032
Figure 70: Europe Cholesterol API Market Attractiveness Analysis 2022-2032, By Country
Figure 71: Europe Cholesterol API Market Attractiveness Analysis 2022-2032, By Source
Figure 72: Europe Cholesterol API Market Attractiveness Analysis 2022-2032, By Manufacturing Process
Figure 73: Europe Cholesterol API Market Attractiveness Analysis 2022-2032, By End User
Figure 74: Germany Market Value Proportion Analysis (2021)
Figure 75: Global Vs Germany Growth Comparison
Figure 76: Germany Cholesterol API Market Share Analysis(%) By Source, 2022 & 2032
Figure 77: Germany Cholesterol API Market Share Analysis(%) By Manufacturing Process, 2022 & 2032
Figure 78: Germany Cholesterol API Market Share Analysis(%) By End User, 2022 & 2032
Figure 79: Italy Market Value Proportion Analysis (2021)
Figure 80: Global Vs Italy Growth Comparison
Figure 81: Italy Cholesterol API Market Share Analysis(%) By Source, 2022 & 2032
Figure 82: Italy Cholesterol API Market Share Analysis(%) By Manufacturing Process, 2022 & 2032
Figure 83: Italy Cholesterol API Market Share Analysis(%) By End User, 2022 & 2032
Figure 84: France Market Value Proportion Analysis (2021)
Figure 85: Global Vs France Growth Comparison
Figure 86: France Cholesterol API Market Share Analysis(%) By Source, 2022 & 2032
Figure 87: France Cholesterol API Market Share Analysis(%) By Manufacturing Process, 2022 & 2032
Figure 88: France Cholesterol API Market Share Analysis(%) By End User, 2022 & 2032
Figure 89: UK Market Value Proportion Analysis (2021)
Figure 90: Global Vs UK Growth Comparison
Figure 91: UK Cholesterol API Market Share Analysis(%) By Source, 2022 & 2032
Figure 92: UK Cholesterol API Market Share Analysis(%) By Manufacturing Process, 2022 & 2032
Figure 93: UK Cholesterol API Market Share Analysis(%) By End User, 2022 & 2032
Figure 94: Spain Market Value Proportion Analysis (2021)
Figure 95: Global Vs Spain Growth Comparison
Figure 96: Spain Cholesterol API Market Share Analysis(%) By Source, 2022 & 2032
Figure 97: Spain Cholesterol API Market Share Analysis(%) By Manufacturing Process, 2022 & 2032
Figure 98: Spain Cholesterol API Market Share Analysis(%) By End User, 2022 & 2032
Figure 99: BENELUX Market Value Proportion Analysis (2021)
Figure 100: Global Vs BENELUX Growth Comparison
Figure 101: BENELUX Cholesterol API Market Share Analysis(%) By Source, 2022 & 2032
Figure 102: BENELUX Cholesterol API Market Share Analysis(%) By Manufacturing Process, 2022 & 2032
Figure 103: BENELUX Cholesterol API Market Share Analysis(%) By End User, 2022 & 2032
Figure 104: Nordic Countries Market Value Proportion Analysis (2021)
Figure 105: Global Vs Nordic Countries Growth Comparison
Figure 106: Nordic Countries Cholesterol API Market Share Analysis(%) By Source, 2022 & 2032
Figure 107: Nordic Countries Cholesterol API Market Share Analysis(%) By Manufacturing Process, 2022 & 2032
Figure 108: Nordic Countries Cholesterol API Market Share Analysis(%) By End User, 2022 & 2032
Figure 109: Russia Market Value Proportion Analysis (2021)
Figure 110: Global Vs Russia Growth Comparison
Figure 110: 216 Cholesterol API Market Share Analysis(%) By Source, 2022 & 2032
Figure 111: Russia Cholesterol API Market Share Analysis(%) By Source, 2022 & 2032
Figure 111: 222 Cholesterol API Market Share Analysis(%) By Manufacturing Process, 2022 & 2032
Figure 112: Russia Cholesterol API Market Share Analysis(%) By Manufacturing Process, 2022 & 2032
Figure 113: Russia Cholesterol API Market Share Analysis(%) By End User, 2022 & 2032
Figure 114: East Asia Cholesterol API Market Value Share, By Country (2022 E)
Figure 115: East Asia Cholesterol API Market Value Share, by Source (2022 E)
Figure 116: East Asia Cholesterol API Market Value Share, By Manufacturing Process (2022 E)
Figure 117: East Asia Cholesterol API Market Value Share, by End User (2022 E)
Figure 118: East Asia Cholesterol API Market Size (US$ Mn) Analysis, 2017–2021
Figure 119: East Asia Cholesterol API Market Size (US$ Mn)) & Y-o-Y Growth (%) Forecast, 2022–2032
Figure 120: East Asia Cholesterol API Market Attractiveness Analysis 2022-2032, By Country
Figure 121: East Asia Cholesterol API Market Attractiveness Analysis 2022-2032, By Source
Figure 122: East Asia Cholesterol API Market Attractiveness Analysis 2022-2032, By Manufacturing Process
Figure 123: East Asia Cholesterol API Market Attractiveness Analysis 2022-2032, By End User
Figure 124: China Market Value Proportion Analysis (2021)
Figure 125: Global Vs China Growth Comparison
Figure 126: China Cholesterol API Market Share Analysis(%) By Source, 2022 & 2032
Figure 127: China Cholesterol API Market Share Analysis(%) By Manufacturing Process, 2022 & 2032
Figure 128: China Cholesterol API Market Share Analysis(%) By End User, 2022 & 2032
Figure 129: Japan Market Value Proportion Analysis (2021)
Figure 130: Global Vs Japan Growth Comparison
Figure 131: Japan Cholesterol API Market Share Analysis(%) By Source, 2022 & 2032
Figure 132: Japan Cholesterol API Market Share Analysis(%) By Manufacturing Process, 2022 & 2032
Figure 133: Japan Cholesterol API Market Share Analysis(%) By End User, 2022 & 2032
Figure 134: South Korea Market Value Proportion Analysis (2021)
Figure 135: Global Vs South Korea Growth Comparison
Figure 136: South Korea Cholesterol API Market Share Analysis(%) By Source, 2022 & 2032
Figure 137: South Korea Cholesterol API Market Share Analysis(%) By Manufacturing Process, 2022 & 2032
Figure 138: South Korea Cholesterol API Market Share Analysis(%) By End User, 2022 & 2032
Figure 139: South Asia Cholesterol API Market Value Share, By Country (2022 E)
Figure 140: South Asia Cholesterol API Market Value Share, by Source (2022 E)
Figure 141: South Asia Cholesterol API Market Value Share, By Manufacturing Process (2022 E)
Figure 142: South Asia Cholesterol API Market Value Share, by End User (2022 E)
Figure 143: South Asia Cholesterol API Market Size (US$ Mn) Analysis, 2017–2021
Figure 144: South Asia Cholesterol API Market Size (US$ Mn)) & Y-o-Y Growth (%) Forecast, 2022–2032
Figure 145: South Asia Cholesterol API Market Attractiveness Analysis 2022-2032, By Country
Figure 146: South Asia Cholesterol API Market Attractiveness Analysis 2022-2032, By Source
Figure 147: South Asia Cholesterol API Market Attractiveness Analysis 2022-2032, By Manufacturing Process
Figure 148: South Asia Cholesterol API Market Attractiveness Analysis 2022-2032, By End User
Figure 149: India Market Value Proportion Analysis (2021)
Figure 150: Global Vs India Growth Comparison
Figure 151: India Cholesterol API Market Share Analysis(%) By Source, 2022 & 2032
Figure 152: India Cholesterol API Market Share Analysis(%) By Manufacturing Process, 2022 & 2032
Figure 153: India Cholesterol API Market Share Analysis(%) By End User, 2022 & 2032
Figure 154: Indonesia Market Value Proportion Analysis (2021)
Figure 155: Global Vs Indonesia Growth Comparison
Figure 156: Indonesia Cholesterol API Market Share Analysis(%) By Source, 2022 & 2032
Figure 157: Indonesia Cholesterol API Market Share Analysis(%) By Manufacturing Process, 2022 & 2032
Figure 158: Indonesia Cholesterol API Market Share Analysis(%) By End User, 2022 & 2032
Figure 159: Malaysia Market Value Proportion Analysis (2021)
Figure 160: Global Vs Malaysia Growth Comparison
Figure 161: Malaysia Cholesterol API Market Share Analysis(%) By Source, 2022 & 2032
Figure 162: Malaysia Cholesterol API Market Share Analysis(%) By Manufacturing Process, 2022 & 2032
Figure 163: Malaysia Cholesterol API Market Share Analysis(%) By End User, 2022 & 2032
Figure 164: Philippines Market Value Proportion Analysis (2021)
Figure 165: Global Vs Philippines Growth Comparison
Figure 166: Philippines Cholesterol API Market Share Analysis(%) By Source, 2022 & 2032
Figure 167: Philippines Cholesterol API Market Share Analysis(%) By Manufacturing Process, 2022 & 2032
Figure 168: Philippines Cholesterol API Market Share Analysis(%) By End User, 2022 & 2032
Figure 169: Thailand Market Value Proportion Analysis (2021)
Figure 170: Global Vs Thailand Growth Comparison
Figure 171: Thailand Cholesterol API Market Share Analysis(%) By Source, 2022 & 2032
Figure 172: Thailand Cholesterol API Market Share Analysis(%) By Manufacturing Process, 2022 & 2032
Figure 173: Thailand Cholesterol API Market Share Analysis(%) By End User, 2022 & 2032
Figure 174: Vietnam Market Value Proportion Analysis (2021)
Figure 175: Global Vs Vietnam Growth Comparison
Figure 176: Vietnam Cholesterol API Market Share Analysis(%) By Source, 2022 & 2032
Figure 177: Vietnam Cholesterol API Market Share Analysis(%) By Manufacturing Process, 2022 & 2032
Figure 178: Vietnam Cholesterol API Market Share Analysis(%) By End User, 2022 & 2032
Figure 179: Oceania Cholesterol API Market Value Share, By Country (2022 E)
Figure 180: Oceania Cholesterol API Market Value Share, by Source (2022 E)
Figure 181: Oceania Cholesterol API Market Value Share, By Manufacturing Process (2022 E)
Figure 182: Oceania Cholesterol API Market Value Share, by End User (2022 E)
Figure 183: Oceania Cholesterol API Market Size (US$ Mn) Analysis, 2017–2021
Figure 184: Oceania Cholesterol API Market Size (US$ Mn)) & Y-o-Y Growth (%) Forecast, 2022–2032
Figure 185: Oceania Cholesterol API Market Attractiveness Analysis 2022-2032, By Country
Figure 186: Oceania Cholesterol API Market Attractiveness Analysis 2022-2032, By Source
Figure 187: Oceania Cholesterol API Market Attractiveness Analysis 2022-2032, By Manufacturing Process
Figure 188: Oceania Cholesterol API Market Attractiveness Analysis 2022-2032, By End User
Figure 189: Australia Market Value Proportion Analysis (2021)
Figure 190: Global Vs Australia Growth Comparison
Figure 191: Australia Cholesterol API Market Share Analysis(%) By Source, 2022 & 2032
Figure 192: Australia Cholesterol API Market Share Analysis(%) By Manufacturing Process, 2022 & 2032
Figure 193: Australia Cholesterol API Market Share Analysis(%) By End User, 2022 & 2032
Figure 194: New Zealand Market Value Proportion Analysis (2021)
Figure 195: Global Vs New Zealand Growth Comparison
Figure 196: New Zealand Cholesterol API Market Share Analysis(%) By Source, 2022 & 2032
Figure 197: New Zealand Cholesterol API Market Share Analysis(%) By Manufacturing Process, 2022 & 2032
Figure 198: New Zealand Cholesterol API Market Share Analysis(%) By End User, 2022 & 2032
Figure 199: Middle East & Africa (MEA) Cholesterol API Market Value Share, By Country (2022 E)
Figure 200: Middle East & Africa (MEA) Cholesterol API Market Value Share, by Source (2022 E)
Figure 201: Middle East & Africa (MEA) Cholesterol API Market Value Share, By Manufacturing Process (2022 E)
Figure 202: Middle East & Africa (MEA) Cholesterol API Market Value Share, by End User (2022 E)
Figure 203: Middle East & Africa (MEA) Cholesterol API Market Size (US$ Mn) Analysis, 2017–2021
Figure 204: Middle East & Africa (MEA) Cholesterol API Market Size (US$ Mn)) & Y-o-Y Growth (%) Forecast, 2022–2032
Figure 205: Middle East & Africa (MEA) Cholesterol API Market Attractiveness Analysis 2022-2032, By Country
Figure 206: Middle East & Africa (MEA) Cholesterol API Market Attractiveness Analysis 2022-2032, By Source
Figure 207: Middle East & Africa (MEA) Cholesterol API Market Attractiveness Analysis 2022-2032, By Manufacturing Process
Figure 208: Middle East & Africa (MEA) Cholesterol API Market Attractiveness Analysis 2022-2032, By End User
Figure 209: GCC Countries Market Value Proportion Analysis (2021)
Figure 210: Global Vs GCC Countries Growth Comparison
Figure 211: GCC Countries Cholesterol API Market Share Analysis(%) By Source, 2022 & 2032
Figure 212: GCC Countries Cholesterol API Market Share Analysis(%) By Manufacturing Process, 2022 & 2032
Figure 213: GCC Countries Cholesterol API Market Share Analysis(%) By End User, 2022 & 2032
Figure 214: Israel Market Value Proportion Analysis (2021)
Figure 215: Global Vs Israel Growth Comparison
Figure 217: Israel Cholesterol API Market Share Analysis(%) By Manufacturing Process, 2022 & 2032
Figure 218: Israel Cholesterol API Market Share Analysis(%) By End User, 2022 & 2032
Figure 219: Turkey Market Value Proportion Analysis (2021)
Figure 220: Global Vs Turkey Growth Comparison
Figure 221: Turkey Cholesterol API Market Share Analysis(%) By Source, 2022 & 2032
Figure 223: Turkey Cholesterol API Market Share Analysis(%) By End User, 2022 & 2032
Figure 224: South Africa Market Value Proportion Analysis (2021)
Figure 225: Global Vs South Africa Growth Comparison
Figure 226: South Africa Cholesterol API Market Share Analysis(%) By Source, 2022 & 2032
Figure 227: South Africa Cholesterol API Market Share Analysis(%) By Manufacturing Process, 2022 & 2032
Figure 228: South Africa Cholesterol API Market Share Analysis(%) By End User, 2022 & 2032
Figure 229: North Africa Market Value Proportion Analysis (2021)
Figure 230: Global Vs North Africa Growth Comparison
Figure 231: North Africa Cholesterol API Market Share Analysis(%) By Source, 2022 & 2032
Figure 232: North Africa Cholesterol API Market Share Analysis(%) By Manufacturing Process, 2022 & 2032
Figure 233: North Africa Cholesterol API Market Share Analysis(%) By End User, 2022 & 2032
Need specific information?
Request CustomizationExplore Healthcare Insights
View Reports