Reports

- Global Locations -

Headquarters

Future Market Insights, Inc.

Christiana Corporate, 200
Continental Drive, Suite 401,
Newark, Delaware - 19713,
United States

T: +1-347-918-3531

Americas

Future Market Insights, Inc.

616 Corporate Way, Suite 2-9018,
Valley Cottage, NY 10989, United States

MEA

Future Market Insights

1602-6 Jumeirah Bay X2 Tower, Plot No: JLT-PH2-X2A,
Jumeirah Lakes Towers, Dubai,
United Arab Emirates

Europe

Future Market Insights

3rd Floor, 207 Regent Street,
W1B 3HH London
United Kingdom

T: + 44 (0) 20 8123 9659

Asia Pacific

Future Market Insights

IndiaLand Global Tech Park, Unit UG-1, Behind Grand HighStreet, Phase 1, Hinjawadi, MH, Pune – 411057, India

Rapid Microbiology Testing Market Outlook from 2024 to 2034

The rapid microbiology testing market is projected to progress at a CAGR of 9.4% from 2024 to 2034, resulting in a significant expansion from US$ 5.0 billion in 2024 to US$ 12.2 billion by 2034.

Microbiology testing adoption is intensifying due to

  • technological advancements
  • regulatory compliance
  • food safety concerns
  • globalization
  • cost-effectiveness
  • outbreak management needs in industries like food, pharmaceuticals, healthcare, and environmental monitoring
Attributes Details
Market Size, 2024 US$ 5.0 billion
Market Size, 2034 US$ 12.2 billion
Value CAGR (2024 to 2034) 9.4%

Don't pay for what you don't need

Customize your report by selecting specific countries or regions and save 30%!

Rapid Microbiology Testing Market Overview

  • Growing consumer awareness leads to stricter food safety regulations, necessitating rapid microbiology testing to ensure food product safety and quality assurance.
  • The increasing prevalence of infectious diseases necessitates rapid diagnostics for prompt treatment and outbreak control, presenting significant public health challenges.
  • Regulatory bodies are imposing stringent standards on pharmaceuticals, medical devices, and food products, which drives the adoption of rapid microbiology testing methods.
  • Technological advancements such as automation, miniaturization, PCR, and next-generation sequencing enhance the speed, accuracy, and efficiency of microbiology testing.
  • Rapid microbiology testing methods prove to be cost-effective, facilitate global food supply chain management, and play a crucial role in outbreak control.
  • Government initiatives and pharmaceutical manufacturing benefit from rapid testing, enabling faster product release, reduced cycle times, and enhanced process efficiency.
  • Rising awareness among consumers, industry stakeholders, and healthcare professionals fuels the adoption of microbiology testing for quality assurance and risk management strategies.

Key Opportunities for Rapid Microbiology Testing Market

  • Rapid microbiology testing companies have the potential to expand into emerging markets where awareness of the importance of testing is growing and healthcare infrastructure is improving.
  • Investing in research and development to create innovative technologies can open up new market opportunities and differentiate companies from their competitors.
  • Customizing solutions for different industries, such as food and beverage, pharmaceuticals, healthcare, and environmental monitoring, can help capture niche markets and foster long-term partnerships.
  • Integrating with digital health platforms can streamline data management and reporting processes, thereby enhancing healthcare providers' value proposition and improving patient outcomes.
  • Strategic partnerships with other companies, research institutions, and regulatory agencies can facilitate knowledge sharing and accelerate product development cycles.
  • Point-of-care testing solutions can be developed for various healthcare settings, while regulatory compliance solutions can assist companies in navigating complex requirements.
  • Rapid microbiology testing can address public health challenges by developing diagnostic tests and surveillance systems.
  • Expanding applications in food safety testing can aid in the detection of foodborne pathogens, spoilage organisms, and allergens.
Sabyasachi Ghosh
Sabyasachi Ghosh

Principal Consultant

Talk to Analyst

Find your sweet spots for generating winning opportunities in this market.

Challenges for Rapid Microbiology Testing Market

  • Rapid microbiology testing methods are complex and require specialized equipment, trained personnel, and intricate data analysis procedures.
  • Validation and standardization processes can be challenging, especially when dealing with complex sample matrices and diverse microbial populations.
  • Meeting regulatory requirements can be time-consuming and expensive, particularly in highly regulated industries.
  • Cost considerations may be higher than those of traditional culture-based methods, which can pose barriers to adoption.
  • Sample preparation is critical, and optimizing protocols can be challenging. Inhibitors may interfere with certain methods, leading to false-positive or false-negative results.
  • Sensitivity and specificity may be limited compared to traditional culture-based methods.
  • Data analysis and interpretation can be challenging, and training personnel to effectively use these methods may require significant time and resources.
  • Resistance to change and skepticism about the reliability of rapid microbiology testing methods may hinder their widespread adoption.

Comparative View of Adjacent Markets

A comprehensive study has been conducted on the rapid microbiology testing market along with two other markets that have the potential to compete rigorously with it: the industrial microbiology market and the microbial identification market. The growth rates and current market valuation are mentioned in the table below, along with the respective markets' growth factors and critical challenges.

Rapid Microbiology Testing Market:

Attributes Rapid Microbiology Testing Market
Value-based CAGR (2024 to 2034) 9.4%
Market Trend Shift toward point-of-care testing and miniaturization of testing devices
Growth Opportunity Adoption of automated and technologically advanced microbiology testing solutions

Industrial Microbiology Market:

Attributes Industrial Microbiology Market
Value-based CAGR (2024 to 2034) 7.6%
Market Trend Adoption of advanced microbial technologies for biofuel production, waste management, and bioremediation
Growth Opportunity Technological advancements such as high-throughput screening, metagenomics, and synthetic biology

Microbial Identification Market:

Attributes Microbial Identification Market
Value-based CAGR (2024 to 2034) 11.3%
Market Trend Adoption of accurate microbial identification techniques such as mass spectrometry and polymerase chain reaction
Growth Opportunity Technological advancements such as miniaturization, automation, and integration of artificial intelligence

Get the data you need at a Fraction of the cost

Personalize your report by choosing insights you need
and save 40%!

Category-wise Insights

Instrumentation Emerges as Market Frontrunner, Spearheading Product Categories

Attributes Details
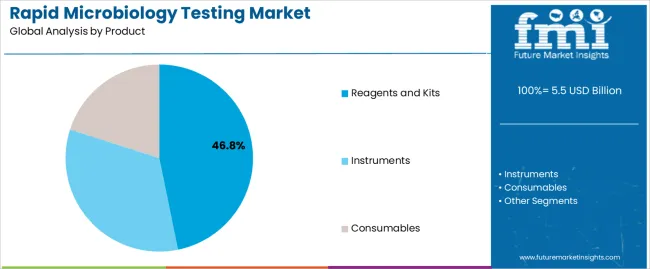
Product Instruments
CAGR of ( 2024 to 2034) 9.1%
  • Instruments are essential for scientific and industrial applications due to their precision and accuracy in measurements.
  • Instruments are utilized across various sectors such as healthcare, manufacturing, research, and environmental monitoring.
  • Continuous advancements in instruments enhance their capabilities, thereby improving efficiency and reliability.
  • Instruments are crucial for quality control as they provide precise data and measurements.
  • Many industries require instruments that adhere to safety and quality assurance regulatory standards.
  • Instruments play a crucial role in process optimization, enhancing productivity and cost-efficiency.

Strategic Dissection Elevates Clinical Disease Diagnosis to Premier Application Status

Attributes Details
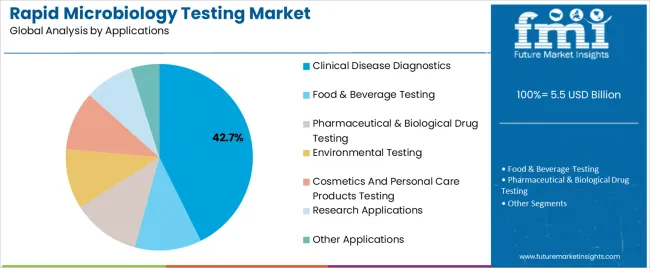
Top Application Clinical Disease Diagnosis
CAGR of ( 2024 to 2034) 8.8%
  • This segment focuses on diagnosing patients' diseases through various diagnostic tests and procedures. Accurate diagnosis is vital for successfully implementing treatment and patient care.
  • Early diagnosis is crucial for prompt intervention and preventive measures, leading to improved patient outcomes.
  • Clinical disease diagnosis frequently involves the use of laboratory tests such as blood tests, imaging studies, and genetic testing.
  • The segment is witnessing a surge in rapid testing methods for swift and precise diagnosis, particularly in urgent care facilities.
  • The integration of technology enhances diagnostic capabilities, enabling more sophisticated and efficient disease diagnosis.
  • Point-of-care testing devices enable rapid diagnosis at the bedside or in the clinic, facilitating prompt decision-making.
  • The clinical disease diagnosis segment is experiencing substantial growth due to the rise in healthcare demands and advancements in diagnostic technologies.

Country-wise insights

Countries Forecasted CAGR from 2024 to 2034
United States 9.7%
United Kingdom 10.8%
China 8.6%
Japan 10.6%
South Korea 11.7 %

Commitment to Innovation and Regulatory Adaptations Define the United States Rapid Microbiology Testing Market

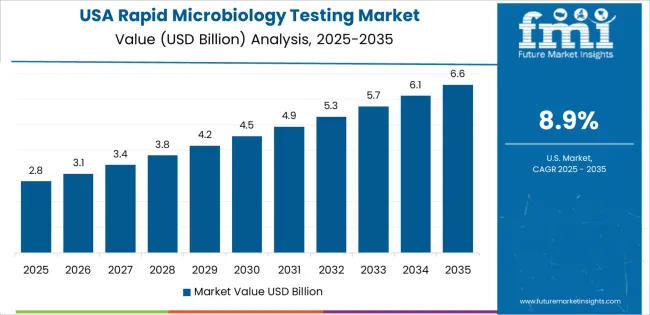
The rapid microbiology testing market in the United States is experiencing steady growth, with a CAGR of 9.7% from 2024 to 2034.

  • The market is driven by innovative technologies, regulatory adaptations, and diverse industry applications.
  • The United States market is a trailblazer in providing rapid microbiology testing solutions, influencing international standards and best practices.
  • The market is characterized by a commitment to innovation, regulatory adaptations, and a diverse range of industries, including healthcare, pharmaceuticals, and food and beverage.

Resilient Regulatory Environment Spurs Competitiveness in United Kingdom's Rapid Microbiology Testing Market

The United Kingdom is experiencing a 10.8% CAGR in the rapid microbiology testing market, showcasing its agility in adopting advanced testing solutions.
  • The regulatory landscape has created a resilient environment for rapid microbiology testing solutions, encouraging market competitiveness.
  • Investment opportunities are emerging, fostering partnerships and collaborations that drive innovation and market growth.
  • The United Kingdom is also promoting cross-industry collaborations, leveraging rapid microbiology testing solutions in healthcare, agriculture, and environmental sectors.
  • The United Kingdom's commitment to quality and innovation has garnered international recognition, leading to global collaborations.

Government Backing and Regulatory Vigilance Propel China's Microbiology Market Forward

  • China is a leading technological innovation hub in microbiology testing, with investments and advancements positioned at the forefront of cutting-edge solutions.
  • Market growth in rapid microbiology testing extends its global influence, shaping industry standards and contributing to international collaborations.
  • Government support and a proactive regulatory environment are crucial for propelling the market forward.
  • China's market diversifies its applications, addressing challenges in healthcare, biotechnology, and food safety with tailored solutions.

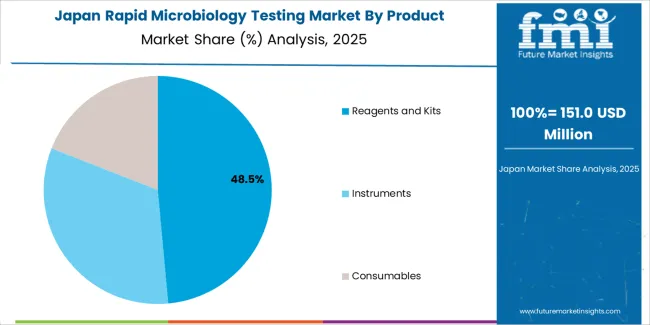
Japan Sets High Quality Standards and Harmonizes Global Practices in Microbiology Testing

  • Japan's market resurgence is driven by innovative technologies, global collaboration, and environmental considerations in microbiology testing.
  • The country ensures high product quality standards and actively collaborates on a global scale, contributing to the harmonization of standards.
  • It also incorporates environmental considerations into its testing practices, aligning market growth with sustainability goals.
  • Strategic industry partnerships further support Japan's market growth, promoting knowledge exchange and collective advancements in microbiology testing.

Export-oriented Rapid Microbiology Testing Propels South Korea's Influence on Global Trade

  • South Korea's innovation ecosystem is thriving, fostering breakthroughs in microbiology testing technologies and solidifying its position as a global market player.
  • The export-driven microbiology market contributes to global trade networks and influences international market dynamics.
  • South Korea is at the forefront of digital transformation in microbiology, enhancing efficiency and accuracy.
  • This rapid growth has regional implications, fostering local stability and contributing to global advancements.

Competitive Landscape

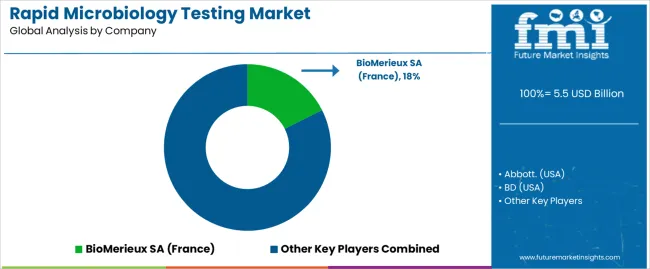
The rapid microbiology testing market is shaped by technological advancements, regulatory compliance, strategic alliances, and market segmentation.

  • Key players dominate the market with innovative products and extensive application areas.
  • Competition is driven by technological advancements such as automated systems and molecular diagnostics, while regulatory frameworks shape market strategies.
  • Market segmentation, based on application areas, testing methods, and geographic regions, defines competition.
  • Companies must consider pricing strategies, customer preferences, and research investment to maintain competitiveness.
  • Emerging trends like point-of-care testing and antimicrobial resistance foster competitive resilience.

Recent Development Rapid Microbiology Testing market
  • In November 2022, IDEXX acquired Tecta-PDS, a Canada-based company specializing in automating water microbiology testing processes, thereby expanding its portfolio of solutions for laboratory-based and in-field applications.
  • In October 2020, Merck KGAA and Mammoth Biosciences partnered to develop and commercialize a CRISPR-based diagnostic test for SARS-CoV-2, leveraging their strengths to create innovative diagnostic solutions.
  • In September 2020, Bruker Corporation acquired Canopy Bioscience LLC, a United States-based company specializing in multi-omics and fluorescence-based imaging techniques, enhancing its market position and capabilities.

Key Market Players

  • Abbott. (USA)
  • BD (USA)
  • BioMerieux SA (France)
  • Bruker (USA)
  • Charles River (USA)
  • Danaher (USA)
  • Don Whitley Scientific Limited (USA)
  • Merck KGaA
  • Neogen Corporation (USA)

Key Segments

By Product:

  • Instruments
  • Reagents and Kits
  • Consumables

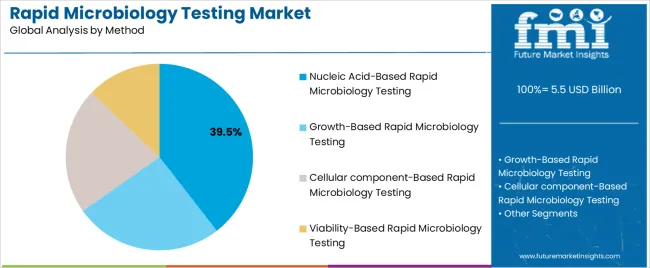
By Method:

  • Growth-Based Rapid Microbiology Testing
  • Cellular component-Based Rapid Microbiology Testing
  • Nucleic Acid-Based Rapid Microbiology Testing
  • Viability-Based Rapid Microbiology Testing

By Applications:

  • Clinical Disease Diagnostics
  • Food & Beverage Testing
  • Pharmaceutical & Biological Drug Testing
  • Environmental Testing
  • Cosmetics and Personal Care Products Testing
  • Research Applications
  • Other Applications

By End Users:

  • Laboratories and Hospitals
  • Food and Beverage Companies
  • Pharmaceutical and Biotechnology Companies
  • Contract Research Organizations
  • Other End-Users

By Region:

  • North America
  • Latin America
  • Europe
  • Asia Pacific
  • Middle East and Africa (MEA)

Frequently Asked Questions

What is the Projected Growth Rate for the Rapid Microbiology Testing market from 2024 to 2034?

The rapid microbiology testing market is projected to develop at a CAGR of 9.4% from 2024 to 2034.

What is the Estimated Market Size of Rapid Microbiology Testing by 2034?

The rapid microbiology testing market is projected to reach a significant growth from US$ 5.0 billion in 2024 to US$ 12.2 billion by 2034.

Who are the Key Service Providers of Self-healing Network?

Abbott, BD, and BioMerieux SA are among the key companies contributing to the expansion of the rapid microbiology testing market.

Table of Content

1. Executive Summary

    1.1. Global Market Outlook

    1.2. Demand-side Trends

    1.3. Supply-side Trends

    1.4. Technology Roadmap Analysis

    1.5. Analysis and Recommendations

2. Market Overview

    2.1. Market Coverage / Taxonomy

    2.2. Market Definition / Scope / Limitations

3. Market Background

    3.1. Market Dynamics

        3.1.1. Drivers

        3.1.2. Restraints

        3.1.3. Opportunity

        3.1.4. Trends

    3.2. Scenario Forecast

        3.2.1. Demand in Optimistic Scenario

        3.2.2. Demand in Likely Scenario

        3.2.3. Demand in Conservative Scenario

    3.3. Opportunity Map Analysis

    3.4. Investment Feasibility Matrix

    3.5. PESTLE and Porter’s Analysis

    3.6. Regulatory Landscape

        3.6.1. By Key Regions

        3.6.2. By Key Countries

    3.7. Regional Parent Market Outlook

4. Global Market Analysis 2019 to 2023 and Forecast, 2024 to 2034

    4.1. Historical Market Size Value (US$ Million) Analysis, 2019 to 2023

    4.2. Current and Future Market Size Value (US$ Million) Projections, 2024 to 2034

        4.2.1. Y-o-Y Growth Trend Analysis

        4.2.2. Absolute $ Opportunity Analysis

5. Global Market Analysis 2019 to 2023 and Forecast 2024 to 2034, By Product Type

    5.1. Introduction / Key Findings

    5.2. Historical Market Size Value (US$ Million) Analysis By Product Type, 2019 to 2023

    5.3. Current and Future Market Size Value (US$ Million) Analysis and Forecast By Product Type, 2024 to 2034

        5.3.1. Instruments

        5.3.2. Reagents and Kits

        5.3.3. Others

    5.4. Y-o-Y Growth Trend Analysis By Product Type, 2019 to 2023

    5.5. Absolute $ Opportunity Analysis By Product Type, 2024 to 2034

6. Global Market Analysis 2019 to 2023 and Forecast 2024 to 2034, By Method

    6.1. Introduction / Key Findings

    6.2. Historical Market Size Value (US$ Million) Analysis By Method, 2019 to 2023

    6.3. Current and Future Market Size Value (US$ Million) Analysis and Forecast By Method, 2024 to 2034

        6.3.1. Growth-Based

        6.3.2. Cellular Component-Based

        6.3.3. Nucleic Acid-Based

        6.3.4. Viability-Based

    6.4. Y-o-Y Growth Trend Analysis By Method, 2019 to 2023

    6.5. Absolute $ Opportunity Analysis By Method, 2024 to 2034

7. Global Market Analysis 2019 to 2023 and Forecast 2024 to 2034, By Applications 

    7.1. Introduction / Key Findings

    7.2. Historical Market Size Value (US$ Million) Analysis By Applications, 2019 to 2023

    7.3. Current and Future Market Size Value (US$ Million) Analysis and Forecast By Applications, 2024 to 2034

        7.3.1. Clinical Disease Diagnostics

        7.3.2. Food & Beverage Testing

        7.3.3. Pharmaceutical & Biological Drug Testing

        7.3.4. Environmental Testing

        7.3.5. Cosmetics and Personal Care Products Testing

        7.3.6. Research Applications

        7.3.7. Others

    7.4. Y-o-Y Growth Trend Analysis By Applications, 2019 to 2023

    7.5. Absolute $ Opportunity Analysis By Applications, 2024 to 2034

8. Global Market Analysis 2019 to 2023 and Forecast 2024 to 2034, By Region

    8.1. Introduction

    8.2. Historical Market Size Value (US$ Million) Analysis By Region, 2019 to 2023

    8.3. Current Market Size Value (US$ Million) Analysis and Forecast By Region, 2024 to 2034

        8.3.1. North America

        8.3.2. Latin America

        8.3.3. Western Europe

        8.3.4. Eastern Europe

        8.3.5. South Asia and Pacific

        8.3.6. East Asia

        8.3.7. Middle East and Africa

    8.4. Market Attractiveness Analysis By Region

9. North America Market Analysis 2019 to 2023 and Forecast 2024 to 2034, By Country

    9.1. Historical Market Size Value (US$ Million) Trend Analysis By Market Taxonomy, 2019 to 2023

    9.2. Market Size Value (US$ Million) Forecast By Market Taxonomy, 2024 to 2034

        9.2.1. By Country

            9.2.1.1. USA

            9.2.1.2. Canada

        9.2.2. By Product Type

        9.2.3. By Method

        9.2.4. By Applications

    9.3. Market Attractiveness Analysis

        9.3.1. By Country

        9.3.2. By Product Type

        9.3.3. By Method

        9.3.4. By Applications

    9.4. Key Takeaways

10. Latin America Market Analysis 2019 to 2023 and Forecast 2024 to 2034, By Country

    10.1. Historical Market Size Value (US$ Million) Trend Analysis By Market Taxonomy, 2019 to 2023

    10.2. Market Size Value (US$ Million) Forecast By Market Taxonomy, 2024 to 2034

        10.2.1. By Country

            10.2.1.1. Brazil

            10.2.1.2. Mexico

            10.2.1.3. Rest of Latin America

        10.2.2. By Product Type

        10.2.3. By Method

        10.2.4. By Applications

    10.3. Market Attractiveness Analysis

        10.3.1. By Country

        10.3.2. By Product Type

        10.3.3. By Method

        10.3.4. By Applications

    10.4. Key Takeaways

11. Western Europe Market Analysis 2019 to 2023 and Forecast 2024 to 2034, By Country

    11.1. Historical Market Size Value (US$ Million) Trend Analysis By Market Taxonomy, 2019 to 2023

    11.2. Market Size Value (US$ Million) Forecast By Market Taxonomy, 2024 to 2034

        11.2.1. By Country

            11.2.1.1. Germany

            11.2.1.2. UK

            11.2.1.3. France

            11.2.1.4. Spain

            11.2.1.5. Italy

            11.2.1.6. Rest of Western Europe

        11.2.2. By Product Type

        11.2.3. By Method

        11.2.4. By Applications

    11.3. Market Attractiveness Analysis

        11.3.1. By Country

        11.3.2. By Product Type

        11.3.3. By Method

        11.3.4. By Applications

    11.4. Key Takeaways

12. Eastern Europe Market Analysis 2019 to 2023 and Forecast 2024 to 2034, By Country

    12.1. Historical Market Size Value (US$ Million) Trend Analysis By Market Taxonomy, 2019 to 2023

    12.2. Market Size Value (US$ Million) Forecast By Market Taxonomy, 2024 to 2034

        12.2.1. By Country

            12.2.1.1. Poland

            12.2.1.2. Russia

            12.2.1.3. Czech Republic

            12.2.1.4. Romania

            12.2.1.5. Rest of Eastern Europe

        12.2.2. By Product Type

        12.2.3. By Method

        12.2.4. By Applications

    12.3. Market Attractiveness Analysis

        12.3.1. By Country

        12.3.2. By Product Type

        12.3.3. By Method

        12.3.4. By Applications

    12.4. Key Takeaways

13. South Asia and Pacific Market Analysis 2019 to 2023 and Forecast 2024 to 2034, By Country

    13.1. Historical Market Size Value (US$ Million) Trend Analysis By Market Taxonomy, 2019 to 2023

    13.2. Market Size Value (US$ Million) Forecast By Market Taxonomy, 2024 to 2034

        13.2.1. By Country

            13.2.1.1. India

            13.2.1.2. Bangladesh

            13.2.1.3. Australia

            13.2.1.4. New Zealand

            13.2.1.5. Rest of South Asia and Pacific

        13.2.2. By Product Type

        13.2.3. By Method

        13.2.4. By Applications

    13.3. Market Attractiveness Analysis

        13.3.1. By Country

        13.3.2. By Product Type

        13.3.3. By Method

        13.3.4. By Applications

    13.4. Key Takeaways

14. East Asia Market Analysis 2019 to 2023 and Forecast 2024 to 2034, By Country

    14.1. Historical Market Size Value (US$ Million) Trend Analysis By Market Taxonomy, 2019 to 2023

    14.2. Market Size Value (US$ Million) Forecast By Market Taxonomy, 2024 to 2034

        14.2.1. By Country

            14.2.1.1. China

            14.2.1.2. Japan

            14.2.1.3. South Korea

        14.2.2. By Product Type

        14.2.3. By Method

        14.2.4. By Applications

    14.3. Market Attractiveness Analysis

        14.3.1. By Country

        14.3.2. By Product Type

        14.3.3. By Method

        14.3.4. By Applications

    14.4. Key Takeaways

15. Middle East and Africa Market Analysis 2019 to 2023 and Forecast 2024 to 2034, By Country

    15.1. Historical Market Size Value (US$ Million) Trend Analysis By Market Taxonomy, 2019 to 2023

    15.2. Market Size Value (US$ Million) Forecast By Market Taxonomy, 2024 to 2034

        15.2.1. By Country

            15.2.1.1. GCC Countries

            15.2.1.2. South Africa

            15.2.1.3. Israel

            15.2.1.4. Rest of MEA

        15.2.2. By Product Type

        15.2.3. By Method

        15.2.4. By Applications

    15.3. Market Attractiveness Analysis

        15.3.1. By Country

        15.3.2. By Product Type

        15.3.3. By Method

        15.3.4. By Applications

    15.4. Key Takeaways

16. Key Countries Market Analysis

    16.1. USA

        16.1.1. Market Share Analysis, 2023

            16.1.1.1. By Product Type

            16.1.1.2. By Method

            16.1.1.3. By Applications

    16.2. Canada

        16.2.1. Market Share Analysis, 2023

            16.2.1.1. By Product Type

            16.2.1.2. By Method

            16.2.1.3. By Applications

    16.3. Brazil

        16.3.1. Market Share Analysis, 2023

            16.3.1.1. By Product Type

            16.3.1.2. By Method

            16.3.1.3. By Applications

    16.4. Mexico

        16.4.1. Market Share Analysis, 2023

            16.4.1.1. By Product Type

            16.4.1.2. By Method

            16.4.1.3. By Applications

    16.5. Germany

        16.5.1. Market Share Analysis, 2023

            16.5.1.1. By Product Type

            16.5.1.2. By Method

            16.5.1.3. By Applications

    16.6. UK

        16.6.1. Market Share Analysis, 2023

            16.6.1.1. By Product Type

            16.6.1.2. By Method

            16.6.1.3. By Applications

    16.7. France

        16.7.1. Market Share Analysis, 2023

            16.7.1.1. By Product Type

            16.7.1.2. By Method

            16.7.1.3. By Applications

    16.8. Spain

        16.8.1. Market Share Analysis, 2023

            16.8.1.1. By Product Type

            16.8.1.2. By Method

            16.8.1.3. By Applications

    16.9. Italy

        16.9.1. Market Share Analysis, 2023

            16.9.1.1. By Product Type

            16.9.1.2. By Method

            16.9.1.3. By Applications

    16.10. Poland

        16.10.1. Market Share Analysis, 2023

            16.10.1.1. By Product Type

            16.10.1.2. By Method

            16.10.1.3. By Applications

    16.11. Russia

        16.11.1. Market Share Analysis, 2023

            16.11.1.1. By Product Type

            16.11.1.2. By Method

            16.11.1.3. By Applications

    16.12. Czech Republic

        16.12.1. Market Share Analysis, 2023

            16.12.1.1. By Product Type

            16.12.1.2. By Method

            16.12.1.3. By Applications

    16.13. Romania

        16.13.1. Market Share Analysis, 2023

            16.13.1.1. By Product Type

            16.13.1.2. By Method

            16.13.1.3. By Applications

    16.14. India

        16.14.1. Market Share Analysis, 2023

            16.14.1.1. By Product Type

            16.14.1.2. By Method

            16.14.1.3. By Applications

    16.15. Bangladesh

        16.15.1. Market Share Analysis, 2023

            16.15.1.1. By Product Type

            16.15.1.2. By Method

            16.15.1.3. By Applications

    16.16. Australia

        16.16.1. Market Share Analysis, 2023

            16.16.1.1. By Product Type

            16.16.1.2. By Method

            16.16.1.3. By Applications

    16.17. New Zealand

        16.17.1. Market Share Analysis, 2023

            16.17.1.1. By Product Type

            16.17.1.2. By Method

            16.17.1.3. By Applications

    16.18. China

        16.18.1. Market Share Analysis, 2023

            16.18.1.1. By Product Type

            16.18.1.2. By Method

            16.18.1.3. By Applications

    16.19. Japan

        16.19.1. Market Share Analysis, 2023

            16.19.1.1. By Product Type

            16.19.1.2. By Method

            16.19.1.3. By Applications

    16.20. South Korea

        16.20.1. Market Share Analysis, 2023

            16.20.1.1. By Product Type

            16.20.1.2. By Method

            16.20.1.3. By Applications

    16.21. GCC Countries

        16.21.1. Market Share Analysis, 2023

            16.21.1.1. By Product Type

            16.21.1.2. By Method

            16.21.1.3. By Applications

    16.22. South Africa

        16.22.1. Market Share Analysis, 2023

            16.22.1.1. By Product Type

            16.22.1.2. By Method

            16.22.1.3. By Applications

    16.23. Israel

        16.23.1. Market Share Analysis, 2023

            16.23.1.1. By Product Type

            16.23.1.2. By Method

            16.23.1.3. By Applications

17. Market Structure Analysis

    17.1. Competition Dashboard

    17.2. Competition Benchmarking

    17.3. Market Share Analysis of Top Players

        17.3.1. By Regional

        17.3.2. By Product Type

        17.3.3. By Method

        17.3.4. By Applications

18. Competition Analysis

    18.1. Competition Deep Dive

        18.1.1. Creative Diagnostics

            18.1.1.1. Overview

            18.1.1.2. Product Portfolio

            18.1.1.3. Profitability by Market Segments

            18.1.1.4. Sales Footprint

            18.1.1.5. Strategy Overview

                18.1.1.5.1. Marketing Strategy

        18.1.2. Bioanalyse

            18.1.2.1. Overview

            18.1.2.2. Product Portfolio

            18.1.2.3. Profitability by Market Segments

            18.1.2.4. Sales Footprint

            18.1.2.5. Strategy Overview

                18.1.2.5.1. Marketing Strategy

        18.1.3. Synbiosis

            18.1.3.1. Overview

            18.1.3.2. Product Portfolio

            18.1.3.3. Profitability by Market Segments

            18.1.3.4. Sales Footprint

            18.1.3.5. Strategy Overview

                18.1.3.5.1. Marketing Strategy

        18.1.4. Thermo Fisher Scientific

            18.1.4.1. Overview

            18.1.4.2. Product Portfolio

            18.1.4.3. Profitability by Market Segments

            18.1.4.4. Sales Footprint

            18.1.4.5. Strategy Overview

                18.1.4.5.1. Marketing Strategy

        18.1.5. MERLIN

            18.1.5.1. Overview

            18.1.5.2. Product Portfolio

            18.1.5.3. Profitability by Market Segments

            18.1.5.4. Sales Footprint

            18.1.5.5. Strategy Overview

                18.1.5.5.1. Marketing Strategy

        18.1.6. Bio-Rad

            18.1.6.1. Overview

            18.1.6.2. Product Portfolio

            18.1.6.3. Profitability by Market Segments

            18.1.6.4. Sales Footprint

            18.1.6.5. Strategy Overview

                18.1.6.5.1. Marketing Strategy

        18.1.7. Danaher Corporation

            18.1.7.1. Overview

            18.1.7.2. Product Portfolio

            18.1.7.3. Profitability by Market Segments

            18.1.7.4. Sales Footprint

            18.1.7.5. Strategy Overview

                18.1.7.5.1. Marketing Strategy

        18.1.8. Merck Group

            18.1.8.1. Overview

            18.1.8.2. Product Portfolio

            18.1.8.3. Profitability by Market Segments

            18.1.8.4. Sales Footprint

            18.1.8.5. Strategy Overview

                18.1.8.5.1. Marketing Strategy

        18.1.9. Zhuhai DL Biotech.

            18.1.9.1. Overview

            18.1.9.2. Product Portfolio

            18.1.9.3. Profitability by Market Segments

            18.1.9.4. Sales Footprint

            18.1.9.5. Strategy Overview

                18.1.9.5.1. Marketing Strategy

        18.1.10. Hi-Media

            18.1.10.1. Overview

            18.1.10.2. Product Portfolio

            18.1.10.3. Profitability by Market Segments

            18.1.10.4. Sales Footprint

            18.1.10.5. Strategy Overview

                18.1.10.5.1. Marketing Strategy

        18.1.11. Liofilchem

            18.1.11.1. Overview

            18.1.11.2. Product Portfolio

            18.1.11.3. Profitability by Market Segments

            18.1.11.4. Sales Footprint

            18.1.11.5. Strategy Overview

                18.1.11.5.1. Marketing Strategy

19. Assumptions & Acronyms Used

20. Research Methodology

List of Tables

Table 1: Global Market Value (US$ Million) Forecast by Region, 2019 to 2034

Table 2: Global Market Value (US$ Million) Forecast by Product Type, 2019 to 2034

Table 3: Global Market Value (US$ Million) Forecast by Method, 2019 to 2034

Table 4: Global Market Value (US$ Million) Forecast by Applications, 2019 to 2034

Table 5: North America Market Value (US$ Million) Forecast by Country, 2019 to 2034

Table 6: North America Market Value (US$ Million) Forecast by Product Type, 2019 to 2034

Table 7: North America Market Value (US$ Million) Forecast by Method, 2019 to 2034

Table 8: North America Market Value (US$ Million) Forecast by Applications, 2019 to 2034

Table 9: Latin America Market Value (US$ Million) Forecast by Country, 2019 to 2034

Table 10: Latin America Market Value (US$ Million) Forecast by Product Type, 2019 to 2034

Table 11: Latin America Market Value (US$ Million) Forecast by Method, 2019 to 2034

Table 12: Latin America Market Value (US$ Million) Forecast by Applications, 2019 to 2034

Table 13: Western Europe Market Value (US$ Million) Forecast by Country, 2019 to 2034

Table 14: Western Europe Market Value (US$ Million) Forecast by Product Type, 2019 to 2034

Table 15: Western Europe Market Value (US$ Million) Forecast by Method, 2019 to 2034

Table 16: Western Europe Market Value (US$ Million) Forecast by Applications, 2019 to 2034

Table 17: Eastern Europe Market Value (US$ Million) Forecast by Country, 2019 to 2034

Table 18: Eastern Europe Market Value (US$ Million) Forecast by Product Type, 2019 to 2034

Table 19: Eastern Europe Market Value (US$ Million) Forecast by Method, 2019 to 2034

Table 20: Eastern Europe Market Value (US$ Million) Forecast by Applications, 2019 to 2034

Table 21: South Asia and Pacific Market Value (US$ Million) Forecast by Country, 2019 to 2034

Table 22: South Asia and Pacific Market Value (US$ Million) Forecast by Product Type, 2019 to 2034

Table 23: South Asia and Pacific Market Value (US$ Million) Forecast by Method, 2019 to 2034

Table 24: South Asia and Pacific Market Value (US$ Million) Forecast by Applications, 2019 to 2034

Table 25: East Asia Market Value (US$ Million) Forecast by Country, 2019 to 2034

Table 26: East Asia Market Value (US$ Million) Forecast by Product Type, 2019 to 2034

Table 27: East Asia Market Value (US$ Million) Forecast by Method, 2019 to 2034

Table 28: East Asia Market Value (US$ Million) Forecast by Applications, 2019 to 2034

Table 29: Middle East and Africa Market Value (US$ Million) Forecast by Country, 2019 to 2034

Table 30: Middle East and Africa Market Value (US$ Million) Forecast by Product Type, 2019 to 2034

Table 31: Middle East and Africa Market Value (US$ Million) Forecast by Method, 2019 to 2034

Table 32: Middle East and Africa Market Value (US$ Million) Forecast by Applications, 2019 to 2034

List of Charts

Figure 1: Global Market Value (US$ Million) by Product Type, 2024 to 2034

Figure 2: Global Market Value (US$ Million) by Method, 2024 to 2034

Figure 3: Global Market Value (US$ Million) by Applications, 2024 to 2034

Figure 4: Global Market Value (US$ Million) by Region, 2024 to 2034

Figure 5: Global Market Value (US$ Million) Analysis by Region, 2019 to 2034

Figure 6: Global Market Value Share (%) and BPS Analysis by Region, 2024 to 2034

Figure 7: Global Market Y-o-Y Growth (%) Projections by Region, 2024 to 2034

Figure 8: Global Market Value (US$ Million) Analysis by Product Type, 2019 to 2034

Figure 9: Global Market Value Share (%) and BPS Analysis by Product Type, 2024 to 2034

Figure 10: Global Market Y-o-Y Growth (%) Projections by Product Type, 2024 to 2034

Figure 11: Global Market Value (US$ Million) Analysis by Method, 2019 to 2034

Figure 12: Global Market Value Share (%) and BPS Analysis by Method, 2024 to 2034

Figure 13: Global Market Y-o-Y Growth (%) Projections by Method, 2024 to 2034

Figure 14: Global Market Value (US$ Million) Analysis by Applications, 2019 to 2034

Figure 15: Global Market Value Share (%) and BPS Analysis by Applications, 2024 to 2034

Figure 16: Global Market Y-o-Y Growth (%) Projections by Applications, 2024 to 2034

Figure 17: Global Market Attractiveness by Product Type, 2024 to 2034

Figure 18: Global Market Attractiveness by Method, 2024 to 2034

Figure 19: Global Market Attractiveness by Applications, 2024 to 2034

Figure 20: Global Market Attractiveness by Region, 2024 to 2034

Figure 21: North America Market Value (US$ Million) by Product Type, 2024 to 2034

Figure 22: North America Market Value (US$ Million) by Method, 2024 to 2034

Figure 23: North America Market Value (US$ Million) by Applications, 2024 to 2034

Figure 24: North America Market Value (US$ Million) by Country, 2024 to 2034

Figure 25: North America Market Value (US$ Million) Analysis by Country, 2019 to 2034

Figure 26: North America Market Value Share (%) and BPS Analysis by Country, 2024 to 2034

Figure 27: North America Market Y-o-Y Growth (%) Projections by Country, 2024 to 2034

Figure 28: North America Market Value (US$ Million) Analysis by Product Type, 2019 to 2034

Figure 29: North America Market Value Share (%) and BPS Analysis by Product Type, 2024 to 2034

Figure 30: North America Market Y-o-Y Growth (%) Projections by Product Type, 2024 to 2034

Figure 31: North America Market Value (US$ Million) Analysis by Method, 2019 to 2034

Figure 32: North America Market Value Share (%) and BPS Analysis by Method, 2024 to 2034

Figure 33: North America Market Y-o-Y Growth (%) Projections by Method, 2024 to 2034

Figure 34: North America Market Value (US$ Million) Analysis by Applications, 2019 to 2034

Figure 35: North America Market Value Share (%) and BPS Analysis by Applications, 2024 to 2034

Figure 36: North America Market Y-o-Y Growth (%) Projections by Applications, 2024 to 2034

Figure 37: North America Market Attractiveness by Product Type, 2024 to 2034

Figure 38: North America Market Attractiveness by Method, 2024 to 2034

Figure 39: North America Market Attractiveness by Applications, 2024 to 2034

Figure 40: North America Market Attractiveness by Country, 2024 to 2034

Figure 41: Latin America Market Value (US$ Million) by Product Type, 2024 to 2034

Figure 42: Latin America Market Value (US$ Million) by Method, 2024 to 2034

Figure 43: Latin America Market Value (US$ Million) by Applications, 2024 to 2034

Figure 44: Latin America Market Value (US$ Million) by Country, 2024 to 2034

Figure 45: Latin America Market Value (US$ Million) Analysis by Country, 2019 to 2034

Figure 46: Latin America Market Value Share (%) and BPS Analysis by Country, 2024 to 2034

Figure 47: Latin America Market Y-o-Y Growth (%) Projections by Country, 2024 to 2034

Figure 48: Latin America Market Value (US$ Million) Analysis by Product Type, 2019 to 2034

Figure 49: Latin America Market Value Share (%) and BPS Analysis by Product Type, 2024 to 2034

Figure 50: Latin America Market Y-o-Y Growth (%) Projections by Product Type, 2024 to 2034

Figure 51: Latin America Market Value (US$ Million) Analysis by Method, 2019 to 2034

Figure 52: Latin America Market Value Share (%) and BPS Analysis by Method, 2024 to 2034

Figure 53: Latin America Market Y-o-Y Growth (%) Projections by Method, 2024 to 2034

Figure 54: Latin America Market Value (US$ Million) Analysis by Applications, 2019 to 2034

Figure 55: Latin America Market Value Share (%) and BPS Analysis by Applications, 2024 to 2034

Figure 56: Latin America Market Y-o-Y Growth (%) Projections by Applications, 2024 to 2034

Figure 57: Latin America Market Attractiveness by Product Type, 2024 to 2034

Figure 58: Latin America Market Attractiveness by Method, 2024 to 2034

Figure 59: Latin America Market Attractiveness by Applications, 2024 to 2034

Figure 60: Latin America Market Attractiveness by Country, 2024 to 2034

Figure 61: Western Europe Market Value (US$ Million) by Product Type, 2024 to 2034

Figure 62: Western Europe Market Value (US$ Million) by Method, 2024 to 2034

Figure 63: Western Europe Market Value (US$ Million) by Applications, 2024 to 2034

Figure 64: Western Europe Market Value (US$ Million) by Country, 2024 to 2034

Figure 65: Western Europe Market Value (US$ Million) Analysis by Country, 2019 to 2034

Figure 66: Western Europe Market Value Share (%) and BPS Analysis by Country, 2024 to 2034

Figure 67: Western Europe Market Y-o-Y Growth (%) Projections by Country, 2024 to 2034

Figure 68: Western Europe Market Value (US$ Million) Analysis by Product Type, 2019 to 2034

Figure 69: Western Europe Market Value Share (%) and BPS Analysis by Product Type, 2024 to 2034

Figure 70: Western Europe Market Y-o-Y Growth (%) Projections by Product Type, 2024 to 2034

Figure 71: Western Europe Market Value (US$ Million) Analysis by Method, 2019 to 2034

Figure 72: Western Europe Market Value Share (%) and BPS Analysis by Method, 2024 to 2034

Figure 73: Western Europe Market Y-o-Y Growth (%) Projections by Method, 2024 to 2034

Figure 74: Western Europe Market Value (US$ Million) Analysis by Applications, 2019 to 2034

Figure 75: Western Europe Market Value Share (%) and BPS Analysis by Applications, 2024 to 2034

Figure 76: Western Europe Market Y-o-Y Growth (%) Projections by Applications, 2024 to 2034

Figure 77: Western Europe Market Attractiveness by Product Type, 2024 to 2034

Figure 78: Western Europe Market Attractiveness by Method, 2024 to 2034

Figure 79: Western Europe Market Attractiveness by Applications, 2024 to 2034

Figure 80: Western Europe Market Attractiveness by Country, 2024 to 2034

Figure 81: Eastern Europe Market Value (US$ Million) by Product Type, 2024 to 2034

Figure 82: Eastern Europe Market Value (US$ Million) by Method, 2024 to 2034

Figure 83: Eastern Europe Market Value (US$ Million) by Applications, 2024 to 2034

Figure 84: Eastern Europe Market Value (US$ Million) by Country, 2024 to 2034

Figure 85: Eastern Europe Market Value (US$ Million) Analysis by Country, 2019 to 2034

Figure 86: Eastern Europe Market Value Share (%) and BPS Analysis by Country, 2024 to 2034

Figure 87: Eastern Europe Market Y-o-Y Growth (%) Projections by Country, 2024 to 2034

Figure 88: Eastern Europe Market Value (US$ Million) Analysis by Product Type, 2019 to 2034

Figure 89: Eastern Europe Market Value Share (%) and BPS Analysis by Product Type, 2024 to 2034

Figure 90: Eastern Europe Market Y-o-Y Growth (%) Projections by Product Type, 2024 to 2034

Figure 91: Eastern Europe Market Value (US$ Million) Analysis by Method, 2019 to 2034

Figure 92: Eastern Europe Market Value Share (%) and BPS Analysis by Method, 2024 to 2034

Figure 93: Eastern Europe Market Y-o-Y Growth (%) Projections by Method, 2024 to 2034

Figure 94: Eastern Europe Market Value (US$ Million) Analysis by Applications, 2019 to 2034

Figure 95: Eastern Europe Market Value Share (%) and BPS Analysis by Applications, 2024 to 2034

Figure 96: Eastern Europe Market Y-o-Y Growth (%) Projections by Applications, 2024 to 2034

Figure 97: Eastern Europe Market Attractiveness by Product Type, 2024 to 2034

Figure 98: Eastern Europe Market Attractiveness by Method, 2024 to 2034

Figure 99: Eastern Europe Market Attractiveness by Applications, 2024 to 2034

Figure 100: Eastern Europe Market Attractiveness by Country, 2024 to 2034

Figure 101: South Asia and Pacific Market Value (US$ Million) by Product Type, 2024 to 2034

Figure 102: South Asia and Pacific Market Value (US$ Million) by Method, 2024 to 2034

Figure 103: South Asia and Pacific Market Value (US$ Million) by Applications, 2024 to 2034

Figure 104: South Asia and Pacific Market Value (US$ Million) by Country, 2024 to 2034

Figure 105: South Asia and Pacific Market Value (US$ Million) Analysis by Country, 2019 to 2034

Figure 106: South Asia and Pacific Market Value Share (%) and BPS Analysis by Country, 2024 to 2034

Figure 107: South Asia and Pacific Market Y-o-Y Growth (%) Projections by Country, 2024 to 2034

Figure 108: South Asia and Pacific Market Value (US$ Million) Analysis by Product Type, 2019 to 2034

Figure 109: South Asia and Pacific Market Value Share (%) and BPS Analysis by Product Type, 2024 to 2034

Figure 110: South Asia and Pacific Market Y-o-Y Growth (%) Projections by Product Type, 2024 to 2034

Figure 111: South Asia and Pacific Market Value (US$ Million) Analysis by Method, 2019 to 2034

Figure 112: South Asia and Pacific Market Value Share (%) and BPS Analysis by Method, 2024 to 2034

Figure 113: South Asia and Pacific Market Y-o-Y Growth (%) Projections by Method, 2024 to 2034

Figure 114: South Asia and Pacific Market Value (US$ Million) Analysis by Applications, 2019 to 2034

Figure 115: South Asia and Pacific Market Value Share (%) and BPS Analysis by Applications, 2024 to 2034

Figure 116: South Asia and Pacific Market Y-o-Y Growth (%) Projections by Applications, 2024 to 2034

Figure 117: South Asia and Pacific Market Attractiveness by Product Type, 2024 to 2034

Figure 118: South Asia and Pacific Market Attractiveness by Method, 2024 to 2034

Figure 119: South Asia and Pacific Market Attractiveness by Applications, 2024 to 2034

Figure 120: South Asia and Pacific Market Attractiveness by Country, 2024 to 2034

Figure 121: East Asia Market Value (US$ Million) by Product Type, 2024 to 2034

Figure 122: East Asia Market Value (US$ Million) by Method, 2024 to 2034

Figure 123: East Asia Market Value (US$ Million) by Applications, 2024 to 2034

Figure 124: East Asia Market Value (US$ Million) by Country, 2024 to 2034

Figure 125: East Asia Market Value (US$ Million) Analysis by Country, 2019 to 2034

Figure 126: East Asia Market Value Share (%) and BPS Analysis by Country, 2024 to 2034

Figure 127: East Asia Market Y-o-Y Growth (%) Projections by Country, 2024 to 2034

Figure 128: East Asia Market Value (US$ Million) Analysis by Product Type, 2019 to 2034

Figure 129: East Asia Market Value Share (%) and BPS Analysis by Product Type, 2024 to 2034

Figure 130: East Asia Market Y-o-Y Growth (%) Projections by Product Type, 2024 to 2034

Figure 131: East Asia Market Value (US$ Million) Analysis by Method, 2019 to 2034

Figure 132: East Asia Market Value Share (%) and BPS Analysis by Method, 2024 to 2034

Figure 133: East Asia Market Y-o-Y Growth (%) Projections by Method, 2024 to 2034

Figure 134: East Asia Market Value (US$ Million) Analysis by Applications, 2019 to 2034

Figure 135: East Asia Market Value Share (%) and BPS Analysis by Applications, 2024 to 2034

Figure 136: East Asia Market Y-o-Y Growth (%) Projections by Applications, 2024 to 2034

Figure 137: East Asia Market Attractiveness by Product Type, 2024 to 2034

Figure 138: East Asia Market Attractiveness by Method, 2024 to 2034

Figure 139: East Asia Market Attractiveness by Applications, 2024 to 2034

Figure 140: East Asia Market Attractiveness by Country, 2024 to 2034

Figure 141: Middle East and Africa Market Value (US$ Million) by Product Type, 2024 to 2034

Figure 142: Middle East and Africa Market Value (US$ Million) by Method, 2024 to 2034

Figure 143: Middle East and Africa Market Value (US$ Million) by Applications, 2024 to 2034

Figure 144: Middle East and Africa Market Value (US$ Million) by Country, 2024 to 2034

Figure 145: Middle East and Africa Market Value (US$ Million) Analysis by Country, 2019 to 2034

Figure 146: Middle East and Africa Market Value Share (%) and BPS Analysis by Country, 2024 to 2034

Figure 147: Middle East and Africa Market Y-o-Y Growth (%) Projections by Country, 2024 to 2034

Figure 148: Middle East and Africa Market Value (US$ Million) Analysis by Product Type, 2019 to 2034

Figure 149: Middle East and Africa Market Value Share (%) and BPS Analysis by Product Type, 2024 to 2034

Figure 150: Middle East and Africa Market Y-o-Y Growth (%) Projections by Product Type, 2024 to 2034

Figure 151: Middle East and Africa Market Value (US$ Million) Analysis by Method, 2019 to 2034

Figure 152: Middle East and Africa Market Value Share (%) and BPS Analysis by Method, 2024 to 2034

Figure 153: Middle East and Africa Market Y-o-Y Growth (%) Projections by Method, 2024 to 2034

Figure 154: Middle East and Africa Market Value (US$ Million) Analysis by Applications, 2019 to 2034

Figure 155: Middle East and Africa Market Value Share (%) and BPS Analysis by Applications, 2024 to 2034

Figure 156: Middle East and Africa Market Y-o-Y Growth (%) Projections by Applications, 2024 to 2034

Figure 157: Middle East and Africa Market Attractiveness by Product Type, 2024 to 2034

Figure 158: Middle East and Africa Market Attractiveness by Method, 2024 to 2034

Figure 159: Middle East and Africa Market Attractiveness by Applications, 2024 to 2034

Figure 160: Middle East and Africa Market Attractiveness by Country, 2024 to 2034

Recommendations

Healthcare

Industrial Microbiology Market

Published : June 2023

Healthcare

Microbial Fermentation Technology Market

Published : April 2023

Healthcare

Microbial Identification Market

Published : October 2022

Explore Healthcare Insights

View Reports

Rapid Microbiology Testing Market