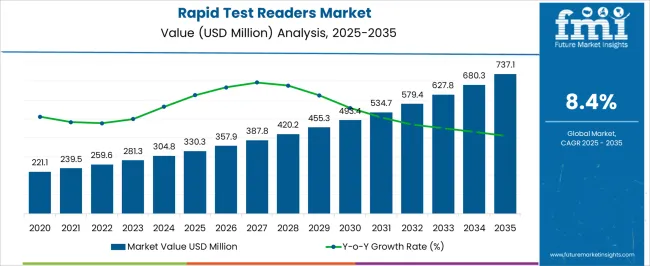
The Rapid Test Readers Market is estimated to be valued at USD 330.3 million in 2025 and is projected to reach USD 737.1 million by 2035, registering a compound annual growth rate (CAGR) of 8.4% over the forecast period.
| Metric | Value |
|---|---|
| Rapid Test Readers Market Estimated Value in (2025 E) | USD 330.3 million |
| Rapid Test Readers Market Forecast Value in (2035 F) | USD 737.1 million |
| Forecast CAGR (2025 to 2035) | 8.4% |
The rapid test readers market is advancing steadily as healthcare systems place greater emphasis on fast, reliable, and decentralized diagnostic solutions. Growing demand for point of care testing, particularly during global health crises, has elevated the importance of rapid test readers in ensuring accurate and timely results.
The integration of portable formats, digital connectivity, and automated result interpretation is driving adoption across both developed and emerging healthcare ecosystems. Regulatory support for rapid testing in infectious disease management, coupled with investment in innovative diagnostic technologies, is further propelling market growth.
The outlook remains strong as diagnostic workflows continue to shift toward accessibility, accuracy, and efficiency, reinforcing the critical role of rapid test readers across clinical and field applications.
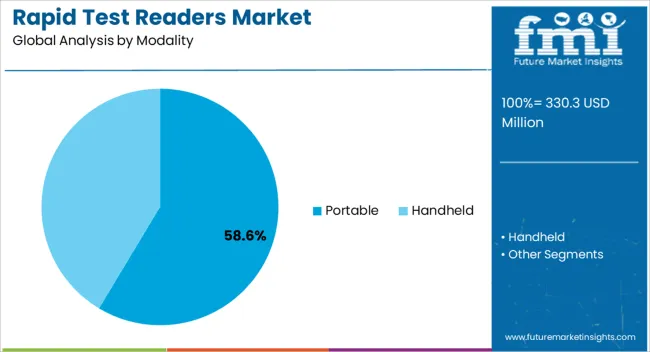
The portable modality segment is expected to contribute 58.60% of total revenue by 2025, making it the leading category. Its dominance is being driven by the demand for compact, easy to use devices that enable on site testing in hospitals, clinics, and remote locations.
Portability ensures faster turnaround times, reduces the need for centralized laboratory infrastructure, and expands diagnostic access in underserved regions. Additionally, advances in lightweight design, wireless connectivity, and battery efficiency have supported wider adoption of portable readers.
Their flexibility and adaptability across multiple diagnostic applications have reinforced their position as the preferred modality within the rapid test readers market.
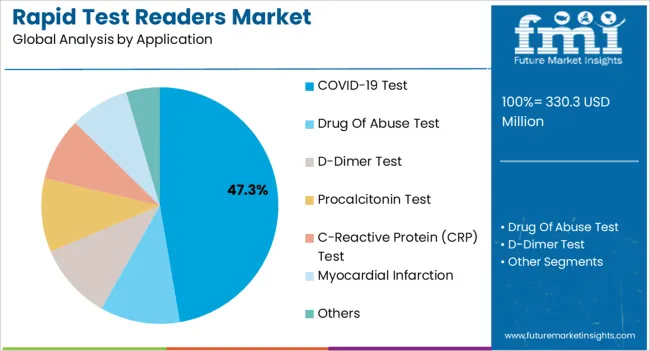
The COVID 19 test application segment is projected to hold 47.30% of market revenue by 2025, highlighting its leading role within the application category. This growth has been fueled by the global pandemic, which underscored the importance of scalable and rapid diagnostic testing solutions.
Rapid test readers have been critical in enhancing accuracy, ensuring data reliability, and supporting large scale screening programs. Their deployment across airports, workplaces, and community health centers has further reinforced adoption.
Continued vigilance for viral variants and preparedness for future outbreaks are expected to sustain demand for COVID 19 testing applications within the rapid test readers market.
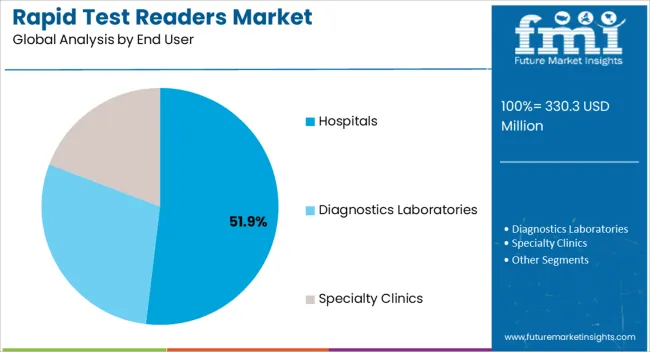
The hospitals segment is projected to account for 51.90% of total revenue by 2025, making it the most significant end user. Hospitals rely on rapid test readers to deliver quick, accurate, and integrated diagnostic results that support patient triage and treatment decisions.
Their use enhances workflow efficiency, reduces diagnostic delays, and supports infection control measures. The ability to integrate results into electronic health record systems further improves clinical management.
Given the rising patient volumes and the need for efficient diagnostic solutions, hospitals continue to drive large scale adoption of rapid test readers, reinforcing their dominance in the end user category.
The global rapid test readers market recorded a historic CAGR of 6.5% in the last 10 years from 2012 to 2025. Rapid test readers market holds around 1.0% of the global point-of-care diagnostics market in 2025.
The rising use of lateral flow assays is a significant market growth factor for rapid test readers. Lateral flow assays are simple, user-friendly diagnostic tests that produce results quickly without the need for expensive laboratory equipment or specialist expertise. These assays are frequently used in diagnostic applications such as infectious disease testing, pregnancy testing, drug testing, and food safety testing.
Several factors influence the use of lateral flow tests. For starters, their ease of use qualifies them for point-of-care testing, when quick results are critical for making timely treatment decisions. Lateral flow assays provide a practical and cost-effective way for healthcare professionals to perform on-site diagnostics, particularly in resource-constrained settings.
Likewise, lateral flow assays based rapid test readers are becoming more popular in home healthcare settings. Patients can readily do these tests at home without the assistance of a healthcare professional, allowing them to self-monitor and treat a variety of health issues. This tendency corresponds to the increasing need for decentralized healthcare solutions and patient empowerment.
Rapid testing market also influences telemedicine and remote monitoring systems (RMS) industry, allowing patients to complete tests remotely and communicate data with healthcare providers for real-time monitoring and diagnosis. This integration improves access to healthcare services and fosters continuity of treatment, especially in rural or disadvantaged areas.
Overall, the growing use of lateral flow assays is increasing the demand for rapid test readers. These readers provide impartial interpretation and analysis of the results, ensuring the lateral flow assay tests' correctness and dependability. The market for rapid test readers is predicted to increase significantly in the next years due to the rising uses and benefits of lateral flow tests (LFT).
Technological advancements are a significant market driver for the rapid test readers market. Continued innovation and development in the field have led to the introduction of highly sophisticated and user-friendly devices.
Integration of advanced technologies such as artificial intelligence (AI), machine learning, and advanced algorithms has enhanced the accuracy, sensitivity, and specificity of rapid test readers. These advancements have resulted in improved performance, faster turnaround times, and enhanced user experience.
The increasing prevalence of Infectious diseases around the globe has resulted in higher uptake of point-of-care diagnostic testing. These testing includes rapid testing for drug of abuse cases in forensics or lateral flow chromatography based immunoassays for qualitative detection of cTnI (cardiac Troponin I) at remote settings among many other testing applications.
These rapid tests are easy to use, ideal to read results and diagnose the conditions on the site. Owed to their rapid diagnosis and easy availability, point-of-care rapid diagnostics are typically the first form of testing recommended worldwide.
Drug abuse testing is frequently employed in forensic and clinical settings. Urine is the recommended specimen type for testing for drugs of abuse, but saliva, perspiration, hair, and meconium are also becoming more popular. The gold standard for confirmatory drug testing has been Rapid Gas Chromatography-Mass Spectrometry (Rapid- GC-MS), however, Liquid Chromatography-tandem-Mass Spectrometry (LC-tandem-MS) can evaluate a wider range of analyses than GC-MS.
The introduction of miniature ambient ionization mass spectrometry, which can evaluate biological samples including urine in one minute, is another technical achievement. As a result, these mass spectrometers show promise for rapid drug abuse detection in a POC setting.
Rapid test readers market growth is being fueled by the constant technological advancement that guarantees healthcare professionals access to cutting-edge diagnostic equipment.
The high initial costs involved in designing and producing these devices are one of the factors limiting the market growth for rapid test readers. Research, development, and production infrastructure may need to be heavily invested in order to create reliable and accurate quick test readers.
Components, software development, quality assurance procedures, and regulatory compliance are all included in the price. These prohibitive up-front expenses may discourage start-ups or smaller businesses from entering the market and may reduce the range of accessible options.
Rapid test readers can also be expensive, which limits their usability in healthcare settings with limited resources. This limitation makes it difficult to achieve broad adoption and commercial expansion for rapid test readers.
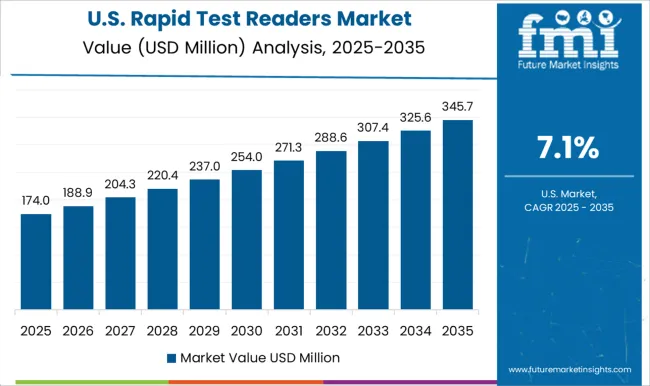
The USA dominates the global market with 29.8% market share in 2025 and is projected to continue experiencing high growth throughout the forecast period.
In the United States, a primary market driver for rapid test readers is the increase in demand for point-of-care testing and rapid testing. In a variety of healthcare settings, there is an increasing demand for instantaneous outcomes and on-the-spot diagnostics.
Healthcare practitioners can rapidly and accurately evaluate and analyze the results of rapid diagnostic tests using rapid test readers. Rapid test readers are becoming more popular because of point-of-care testing, which enables tests to be administered at the patient's bedside or in other unconventional healthcare settings.
Real-time readings enable prompt treatment decisions, enhance patient outcomes, and boost overall healthcare productivity. The demand for rapid test readers is fueled by the rising importance of rapid testing in the US, which is helping the market expand.
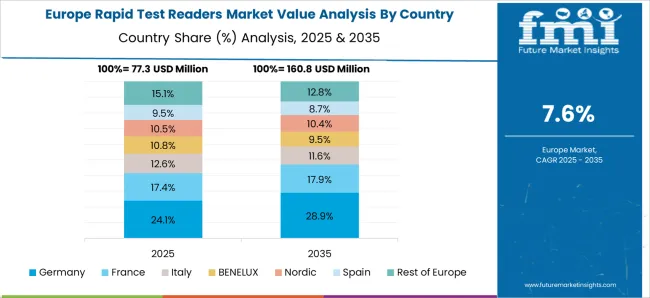
Germany holds about 32.7% of the market share, within Europe in 2025.
The expanding applications of rapid testing outside of healthcare settings has significantly impacted the rapid test reader market in Germany. Rapid test readers, which were once primarily employed in healthcare settings, are now finding use in many different industries. In Germany, these tools are used in veterinary care, food safety, environmental testing, and drug testing, among other fields.
Rapid test readers are useful tools in various non-healthcare fields due to their adaptability and capacity to give prompt and accurate test result interpretations. In Germany, the expansion of applications outside of healthcare has opened up new market prospects, promoting the use of rapid test readers across many industries and fostering industry expansion.
China holds about 10.2% share in the global market in 2025 and is projected to increase during the forecast period.
Rising demand for home testing has considerably impacted the rapid test readers market in China. Self-testing and home-based healthcare are becoming more popular in the nation. Rapid test readers have been essential in addressing this demand by allowing people to conduct diagnostic tests at the convenience of their own homes.
Home testing has become more and more popular in China due to its accessibility, convenience, and privacy benefits. Rapid test readers enable people to monitor their health and identify specific illnesses without having to go to a healthcare facility by providing accurate and trustworthy interpretations of test results.
Rapid test readers have a sizable market in China thanks to the country's rising need for at-home testing, which has accelerated their uptake and fueled the business.
Portable segment within the modality segment hold a revenue share of 82.3% in 2025, and the same trend is being followed over the forecasted period.
Due to the rising need for on-the-go diagnostics, point-of-care testing, and the convenience of portable devices for immediate and easy test results, the portable segment dominates the modality segment of the market for rapid test readers.
COVID-19 test held a market share of 38.0% in 2025. Due to the global pandemic and the widespread demand for quick and precise testing for the diagnosis and management of COVID-19 transmission, the COVID-19 test segment leads the market for rapid test readers.
Hospitals within the end user segment hold a market share of 54.0% in 2025, within the forecasted period.
Due to the increasing demand for point-of-care testing and the accessibility of advanced healthcare infrastructure in hospitals, which enables efficient and accurate diagnostic testing, the hospitals segment leads the end user segment for rapid test readers.
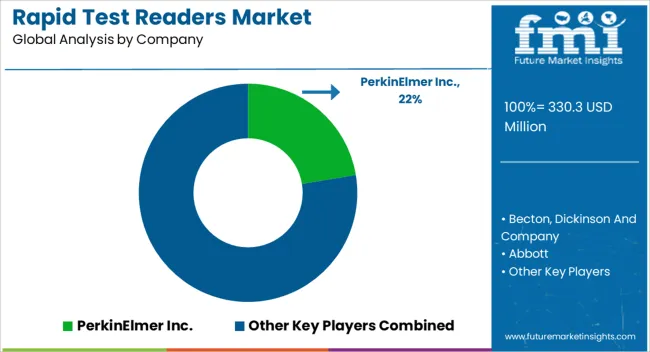
Key producers of rapid test readers are focusing on strategic collaborations to develop novel product lines and gain large customer base globally
Similarly, recent developments related to companies in rapid test readers market have been tracked by the team at Future Market Insights, which are available in the full report.
| Attributes | Details |
|---|---|
| Forecast Period | 2025 to 2035 |
| Historical Data Available for | 2012 to 2025 |
| Market Analysis | USD Million for Value, Units for Volume |
| Key Regions Covered | North America; Latin America; Europe; South Asia; East Asia; Oceania; and Middle East & Africa |
| Key Countries Covered | USA, Canada, Brazil, Mexico, Argentina, UK, Germany, Italy, Russia, Spain, France, BENELUX, India, Thailand, Indonesia, Malaysia, Japan, China, South Korea, Australia, New Zealand, Türkiye, GCC Countries, South Africa, and North Africa |
| Key Market Segments Covered | Modality, Application, End Users and Region |
| Key Companies Profiled | PerkinElmer Inc.; Becton, Dickinson and Company; Abbott; Gold Standard Diagnostics; CTK Biotech, Inc; Siemens Healthineers; VedaLab; ASEBIO; Invitron Ltd; Rapid Test Digital; Indifoss; NewScen Coast Bio-Pharmaceutical Co., Ltd.; Innovation Biotech (Beijing) Co.,Ltd |
| Report Coverage | Market Forecast, Competition Intelligence, DROT Analysis, Market Dynamics and Challenges, Strategic Growth Initiatives |
| Pricing | Available upon Request |
The global rapid test readers market is estimated to be valued at USD 330.3 million in 2025.
The market size for the rapid test readers market is projected to reach USD 737.1 million by 2035.
The rapid test readers market is expected to grow at a 8.4% CAGR between 2025 and 2035.
The key product types in rapid test readers market are portable and handheld.
In terms of application, covid-19 test segment to command 47.3% share in the rapid test readers market in 2025.


Full Research Suite comprises of:
Market outlook & trends analysis
Interviews & case studies
Strategic recommendations
Vendor profiles & capabilities analysis
5-year forecasts
8 regions and 60+ country-level data splits
Market segment data splits
12 months of continuous data updates
DELIVERED AS:
PDF EXCEL ONLINE
Rapid Prototyping Materials Market Size and Share Forecast Outlook 2025 to 2035
Rapid Strength Concrete Market Size and Share Forecast Outlook 2025 to 2035
Rapid Self-Healing Gel Market Size and Share Forecast Outlook 2025 to 2035
Rapid Infuser Market Size, Growth, and Forecast 2025 to 2035
Market Leaders & Share in the Rapid Infuser Industry
Rapid Cook-High Speed Ovens Market
Rapid Test Cards Market Size and Share Forecast Outlook 2025 to 2035
Rapid RNA Testing Kits Market Trends- Growth & Forecast 2025 to 2035
Rapid Antigen Testing Market - Demand, Growth & Forecast 2025 to 2035
Rapid Hepatitis Testing Market – Demand & Forecast 2025 to 2035
Rapid Coagulation Testing Market
Rapid Microbiology Testing Market Forecast Outlook 2025 to 2035
Rapid Plasma Reagin Test Market
Mono Rapid Testing Market Size and Share Forecast Outlook 2025 to 2035
Veterinary Rapid Test Market Size and Share Forecast Outlook 2025 to 2035
Veterinary Rapid Tests Market Size and Share Forecast Outlook 2025 to 2035
Malaria Ag Rapid Testing Market - Growth & Forecast 2025 to 2035
Trichomonas Rapid Tests Market Size and Share Forecast Outlook 2025 to 2035
Chloramphenicol Rapid Test Strip Market Size and Share Forecast Outlook 2025 to 2035
Candida Vaginitis Rapid Testing Market

Thank you!
You will receive an email from our Business Development Manager. Please be sure to check your SPAM/JUNK folder too.
Chat With
MaRIA