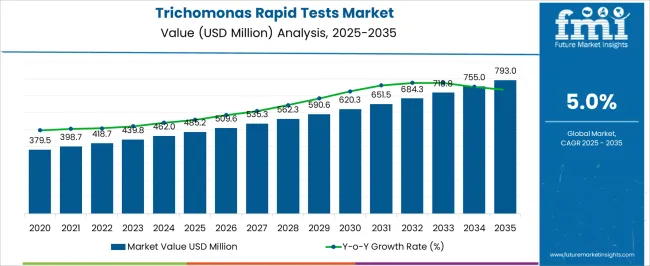
The Trichomonas Rapid Tests Market is estimated to be valued at USD 485.2 million in 2025 and is projected to reach USD 793.0 million by 2035, registering a compound annual growth rate (CAGR) of 5.0% over the forecast period.
| Metric | Value |
|---|---|
| Trichomonas Rapid Tests Market Estimated Value in (2025 E) | USD 485.2 million |
| Trichomonas Rapid Tests Market Forecast Value in (2035 F) | USD 793.0 million |
| Forecast CAGR (2025 to 2035) | 5.0% |
The trichomonas rapid tests market is experiencing steady growth due to the increasing prevalence of trichomoniasis, heightened awareness regarding sexually transmitted infections, and the demand for rapid and cost effective diagnostic solutions. The adoption of point of care testing is being encouraged by its ability to deliver accurate results within minutes, which supports timely treatment initiation and reduces transmission risks.
Advancements in assay design and sample handling techniques are further improving sensitivity and specificity, making these tests more reliable in both clinical and community settings. Public health initiatives and government screening programs are strengthening diagnostic coverage, particularly in high risk populations.
With rising emphasis on preventive healthcare and early detection, the market is positioned for continued expansion as accessibility and awareness continue to improve globally.
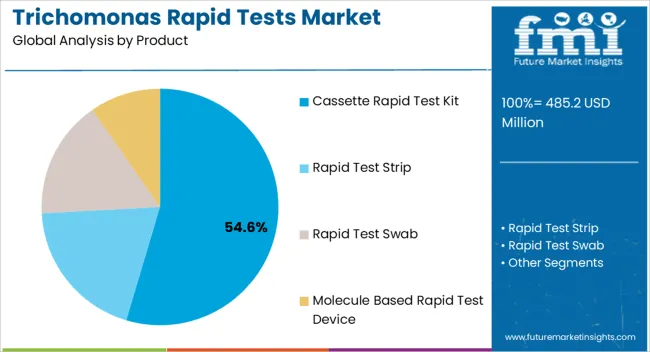
The cassette rapid test kit segment is projected to represent 54.60% of total revenue by 2025 within the product category, making it the dominant segment. Growth is driven by the simplicity of use, affordability, and minimal training requirements associated with cassette based kits.
Their compatibility with various healthcare settings, including clinics, hospitals, and outreach programs, further enhances adoption.
The ability to provide quick visual results without additional equipment strengthens their role as the preferred choice for frontline diagnostic applications.
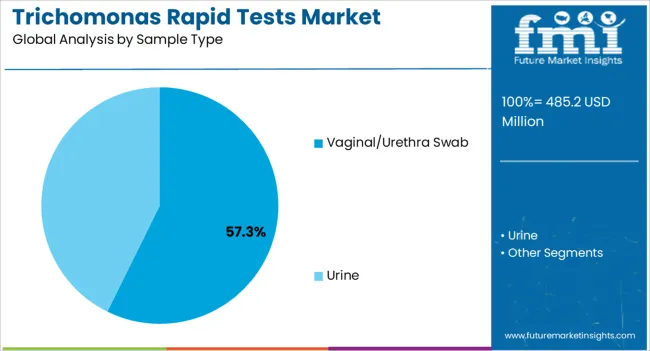
The vaginal or urethra swab segment is expected to account for 57.30% of total market revenue by 2025 within the sample type category, positioning it as the leading segment. Its dominance is attributed to the high accuracy and reliability of swab based collection methods in detecting trichomonas infections.
Ease of sample handling and consistency in results have supported its preference across clinical diagnostics.
The widespread use of swab samples in both hospital and outpatient settings ensures dependable detection rates, reinforcing their leadership in the sample type category.
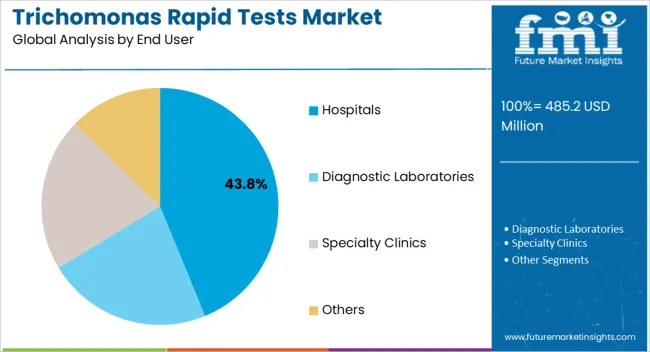
The hospitals segment is anticipated to hold 43.80% of total market revenue by 2025 within the end user category, making it the leading segment. This share is supported by the concentration of patient visits, availability of trained personnel, and the integration of rapid testing into routine diagnostic workflows.
Hospitals also serve as primary centers for disease screening and treatment, which amplifies their reliance on rapid diagnostic kits.
Their established infrastructure for infection control and laboratory testing further reinforces their role as the dominant end user in the trichomonas rapid tests market.
The global market recorded a historic CAGR of 4.2% in the last 5 years from 2020 to 2025.
The global Trichomonas rapid test market contributes around 11.0% to the USD 485.2 Billion global Sexually Transmitted Disease (STI) diagnostics market in 2025.
Growing demand in healthcare settings is a prominent market driver for the trichomonas rapid tests market. Clinics, hospitals, and diagnostic laboratories all play an important role in the diagnosis and treatment of trichomoniasis.
To begin, healthcare providers understand the significance of early and accurate trichomoniasis diagnosis. Rapid testing yields speedy answers, allowing healthcare providers to make treatment decisions in real-time. These tests' ease and efficiency make them essential tools in busy healthcare environments, allowing for timely patient management.
Subsequently, the usage of rapid tests in healthcare settings corresponds to the larger trend of point-of-care testing (POCT). POCT stands for point-of-care testing, which is performed at or near the site of patient care, providing quick results and removing the need to transmit samples to a centralized laboratory.
Trichomonas rapid tests are ideal for POCT because they provide quick and accurate findings without requiring complex laboratory equipment or lengthy sample processing. This allows healthcare providers to diagnose and commence therapy during the patient's visit, improving overall healthcare efficiency.
Likewise, the rising prevalence of trichomoniasis and the resulting need for efficient management have increased the demand for quick diagnosis in healthcare settings. Trichomoniasis is a common sexually transmitted infection that, if left untreated, can have serious health repercussions, particularly in women. Healthcare practitioners to enable early discovery, effective treatment, and complication prevention are rapidly using rapid tests in diagnostic protocols.
Also, the adoption of trichomonas rapid tests in healthcare settings improves patient satisfaction. Rapid tests lessen waiting periods and anxiety associated with delayed diagnosis due to their speedy response time. Patients can receive rapid results and begin therapy as soon as possible, resulting in better overall patient experiences.
Ultimately, the increased demand for Trichomonas rapid tests in healthcare settings can be ascribed to the emphasis on early diagnosis, the adoption of POCT, the rising burden of trichomoniasis, and the emphasis on improving patient satisfaction and outcomes. These reasons are driving the market expansion for Trichomonas rapid testing in healthcare settings.
Diagnostic technology advances have had a profound impact on the global market for Trichomonas rapid testing. These developments have transformed the accuracy, sensitivity, and speed of trichomoniasis diagnostic testing. Nucleic acid amplification techniques, for example, have increased the detection capacities of Trichomonas tests, allowing for early and reliable diagnosis.
AmpliVue and Solana tests are molecularly amplified and can be completed in less than an hour. Solana has a sensitivity of 100% for vaginal swabs and 90.7% for NAATs. GeneXpert TV is a moderately complex test that requires a small platform and can be performed in less than one hour, with excellent sensitivity and specificity for both men and women.
Further, many companies have been making efforts to reduce the cost of the device by collaborating with regional institutions and research laboratories. They are providing funds to grade their kits and devices capabilities and to back their technological advancements with scientific data seeking for various government and clinical approvals.
Likewise, the introduction of point-of-care devices and portable testing platforms has increased the accessibility and convenience of fast testing. These technical improvements have not only improved the performance of rapid tests, but have also contributed to their wider usage in a variety of healthcare settings, allowing for faster diagnosis and treatment of Trichomoniasis, which propels the market growth exponentially.
The cost factor is a limitation for the Trichomonas rapid testing market. The cost of Trichomonas rapid tests can have an impact on their widespread usage, particularly in locations with low healthcare resources or no insurance coverage.
The expense of producing, delivering, and acquiring these tests may provide difficulties for both healthcare practitioners and patients. High-test fees may restrict access, particularly in low-income groups where affordability is a main concern.
Likewise, healthcare organizations and facilities may need to use their resources wisely, taking into account the cost-effectiveness of various diagnostic options. To limit the influence of cost concern as a market restraint, the availability of cost-effective Trichomonas rapid tests and the deployment of pricing mechanisms that ensure affordability is critical.
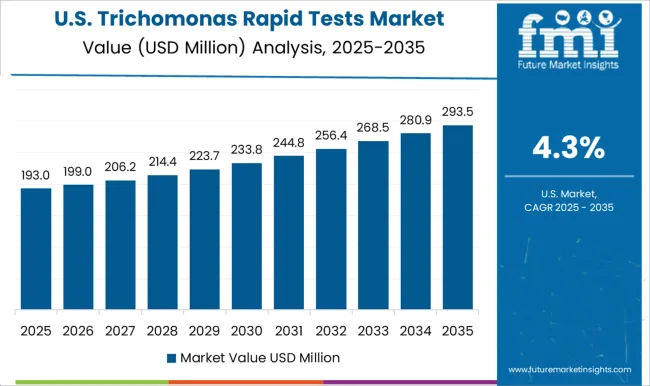
The USA dominates the global market with a market share of over 34.0% in 2025 and is projected to continue experiencing high growth throughout the forecast period.
The rising prevalence of trichomoniasis in the United States is a key market driver for trichomonas rapid tests. Trichomoniasis, a sexually transmitted infection caused by Trichomonas vaginalis, is on the rise, fueling demand for quick diagnostic testing.
According to a study published by Sex Transm Di, on 1st April 2024, Trichomonas vaginalis infections affected 379.5 million individuals aged 15-59, with 470,000 men and 2.1 million women, and incident infections were 6.9 million in 2020.
Changes in sexual practices, a lack of understanding, and a lack of prophylactic measures all contribute to the increased prevalence of trichomoniasis. The demand for Trichomonas rapid tests is driven by the necessity for early detection and treatment to avoid problems and slow transmission rates.
The increasing frequency of trichomoniasis in the United States emphasizes the need for improved diagnostic tools to combat this condition, which also propels the market growth significantly.

Germany holds about 8.1% of the global market share in 2025.
The growing emphasis on preventative healthcare in Germany is boosting the demand for Trichomonas rapid testing. There is a rising emphasis on early detection and screening for sexually transmitted diseases (STIs), including trichomoniasis, as part of a proactive approach to healthcare.
Preventive healthcare programs and efforts encourage high-risk people to get regular testing, raising awareness about the need of early diagnosis and treatment.
As healthcare practitioners and individuals prioritize proactive methods to identify and manage trichomoniasis to prevent its spread and related health consequences, the demand for Trichomonas rapid tests is increasing in Germany.
China holds about 9.6% share in the global trichomonas rapid test market in 2025 and is projected to increase during the forecast period.
There is an increasing emphasis on women's healthcare in China, which is a significant market driver for the Trichomonas rapid tests. Women's particular health requirements and challenges, including the risk of trichomoniasis, are becoming better recognized.
This increased attention on women's healthcare has resulted in a higher emphasis on early detection and treatment of illnesses such as trichomoniasis to avoid problems. Healthcare practitioners and organizations are prioritizing screening and diagnostic interventions geared exclusively toward women.
Trichomonas quick tests provide a practical and efficient solution for timely diagnosis in women's healthcare settings, contributing to their rising usage and demand in China.
Rapid test strip hold a revenue share of 38.1% in 2025, and the same trend is being followed over the forecasted period.
Due to their simplicity, accessibility of use, and quick results, rapid test strips dominate the product category globally. Rapid test strips are a popular choice among healthcare practitioners and patients because they provide a convenient and cost-effective alternative for Trichomonas identification.
Vaginal/urethra swab holds a market share of 79.5% in 2025, within the forecasted period.
Due to its direct sampling method from the site of infection, convenience, ease of collection, and accurate detection of Trichomonas vaginalis, the vaginal/urethra swab are the most sought after sample segment globally.
Hospitals hold a market share of 36.7% in 2025, within the forecasted period.
Given their comprehensive healthcare facilities, availability of qualified employees, and capacity to provide immediate testing and treatment for patients, hospitals dominate the end user segment globally.
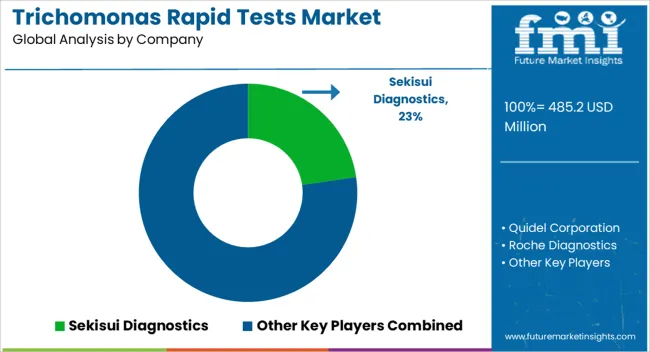
Advancements in the diagnostic technology for the trichomonas rapid tests and growing focus on geographical expansion by the acquisition of local market players are key strategies undertaken by leading firms. These strategies help companies to gain high revenue and expand their sales footprint in emerging countries
Similarly, recent developments related to companies in Trichomonas rapid tests market have been tracked by the team at Future Market Insights, which are available in the full report.
| Attributes | Details |
|---|---|
| Forecast Period | 2025 to 2035 |
| Historical Data Available for | 2020 to 2025 |
| Market Analysis | USD Million for Value, Units for Volume |
| Key Regions Covered | North America; Latin America; Europe; South Asia; East Asia; Oceania; and Middle East & Africa |
| Key Countries Covered | USA, Canada, Brazil, Mexico, Argentina, UK, Germany, Italy, Russia, Spain, France, BENELUX, India, Thailand, Indonesia, Malaysia, Japan, China, South Korea, Australia, New Zealand, Türkiye, GCC Countries, South Africa, and Northern Africa |
| Key Market Segments Covered | Product, Sample, End User and Region |
| Key Companies Profiled | Sekisui Diagnostics; Quidel Corporation; Roche Diagnostics; Home Health (UK) Ltd; Liming Bio; Orient Gene; Creative Diagnostics; Norgen Biotek Corp.; Cepheid, BD; cardinal Health; Jei Daniel Biotech Corp; Common Sense; nal von minden GmbH; Hologic, Inc.; Abbott |
| Pricing | Available upon Request |
The global trichomonas rapid tests market is estimated to be valued at USD 485.2 million in 2025.
The market size for the trichomonas rapid tests market is projected to reach USD 793.0 million by 2035.
The trichomonas rapid tests market is expected to grow at a 5.0% CAGR between 2025 and 2035.
The key product types in trichomonas rapid tests market are cassette rapid test kit, rapid test strip, rapid test swab and molecule based rapid test device.
In terms of sample type, vaginal/urethra swab segment to command 57.3% share in the trichomonas rapid tests market in 2025.


Full Research Suite comprises of:
Market outlook & trends analysis
Interviews & case studies
Strategic recommendations
Vendor profiles & capabilities analysis
5-year forecasts
8 regions and 60+ country-level data splits
Market segment data splits
12 months of continuous data updates
DELIVERED AS:
PDF EXCEL ONLINE
Rapid Test Cards Market Size and Share Forecast Outlook 2025 to 2035
Rapid Prototyping Materials Market Size and Share Forecast Outlook 2025 to 2035
Rapid Test Readers Market Size and Share Forecast Outlook 2025 to 2035
Rapid Strength Concrete Market Size and Share Forecast Outlook 2025 to 2035
Rapid Self-Healing Gel Market Size and Share Forecast Outlook 2025 to 2035
Rapid Infuser Market Size, Growth, and Forecast 2025 to 2035
Rapid RNA Testing Kits Market Trends- Growth & Forecast 2025 to 2035
Rapid Hepatitis Testing Market – Demand & Forecast 2025 to 2035
Rapid Antigen Testing Market - Demand, Growth & Forecast 2025 to 2035
Market Leaders & Share in the Rapid Infuser Industry
Global Rapid Microbiology Testing Market Analysis – Size, Share & Forecast 2024-2034
Rapid Plasma Reagin Test Market
Rapid Coagulation Testing Market
Rapid Cook-High Speed Ovens Market
Mono Rapid Testing Market Size and Share Forecast Outlook 2025 to 2035
Veterinary Rapid Test Market Size and Share Forecast Outlook 2025 to 2035
Malaria Ag Rapid Testing Market - Growth & Forecast 2025 to 2035
Veterinary Rapid Tests Market Size and Share Forecast Outlook 2025 to 2035
Chloramphenicol Rapid Test Strip Market Size and Share Forecast Outlook 2025 to 2035
Candida Vaginitis Rapid Testing Market

Thank you!
You will receive an email from our Business Development Manager. Please be sure to check your SPAM/JUNK folder too.
Chat With
MaRIA