The chloramphenicol rapid test strip market is anticipated to grow from USD 64.5 million in 2025 to USD 168.9 million by 2035, advancing at a CAGR of 10.1%. Growth momentum analysis illustrates the speed and consistency of market expansion over the decade, highlighting periods of accelerated adoption and stabilization. From 2025 to 2028, the market experiences strong momentum as increasing demand for rapid, reliable antibiotic residue detection in food products, especially in dairy, aquaculture, and meat, drives initial uptake. The convenience of rapid test strips, combined with regulatory pressure for food safety compliance, establishes a clear early growth phase, with frequent adoption by laboratories, farms, and quality control facilities.
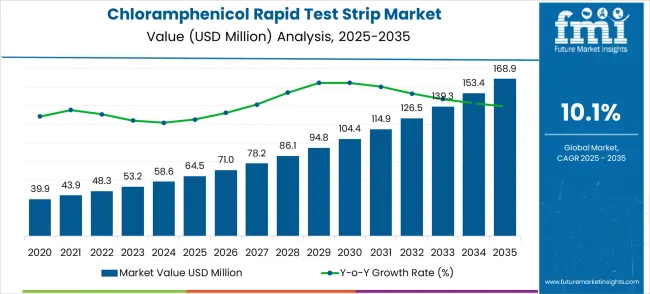
Between 2028 and 2032, momentum intensifies further as advancements in sensitivity, specificity, and ease of use enhance product appeal. Integration with digital reporting tools and multi-residue detection capabilities enhances adoption in large-scale operations and export-oriented industries, driving sustained revenue growth acceleration. From 2032 to 2035, the market momentum slightly moderates as penetration in primary markets approaches saturation. Growth during this period is driven mainly by replacement demand, expansion into emerging regions, and upgrades to newer strip versions with improved performance. This pattern highlights the importance for manufacturers and distributors to align their production capacity, marketing efforts, and R&D investments with periods of high growth momentum to capture the maximum market share throughout the decade.
| Metric | Value |
|---|---|
| Estimated Value in (2025E) | USD 64.5 million |
| Forecast Value in (2035F) | USD 168.9 million |
| Forecast CAGR (2025 to 2035) | 10.1% |
The chloramphenicol rapid test strip market is segmented across food safety testing (42%), pharmaceutical quality control (26%), aquaculture and seafood inspection (16%), veterinary applications (10%), and research and academic laboratories (6%). Food safety testing dominates adoption as regulatory authorities and manufacturers use rapid test strips to detect antibiotic residues in milk, meat, and seafood. Key trends include high-sensitivity detection, multiplexed assays, and user-friendly portable formats. Manufacturers are innovating with longer shelf life, faster results, and integration with mobile diagnostic platforms. Pharmaceutical quality control applications ensure compliance with drug purity and safety standards. Aquaculture and seafood inspection rely on rapid strips to prevent chloramphenicol contamination in exported and domestic products. Veterinary applications use them for monitoring livestock and pets. Research and academic institutions leverage these strips for experimental assays and training.
Market expansion is being supported by the increasing global focus on food safety regulations and the corresponding need for rapid testing solutions that can maintain detection accuracy while reducing testing time across various agricultural and food processing applications. Modern regulatory agencies are increasingly focused on implementing testing solutions that can minimize the distribution of contaminated products, ensure regulatory compliance, and provide consistent quality in food safety monitoring programs. Chloramphenicol rapid test strips' proven ability to deliver reliable detection, cost-effective testing capabilities, and versatile application across different sample types make them essential tools for contemporary food safety and regulatory compliance solutions.
The growing emphasis on consumer protection and supply chain transparency is driving demand for chloramphenicol rapid test strips that can support real-time testing, reduce laboratory dependency, and enable immediate decision-making regarding product safety. Food processors' preference for testing solutions that combine accuracy with operational efficiency and cost-effectiveness is creating opportunities for innovative rapid test strip implementations. The rising influence of international trade requirements and export compliance standards is also contributing to increased adoption of chloramphenicol rapid test strips that can provide internationally recognized testing results without complex laboratory procedures or extended waiting periods.
The market is segmented by product type, application, distribution channel, and region. By product type, the market is divided into colloidal gold test strips, fluorescent test strips, and others. Based on the application, the market is categorized into customs/market regulation and enterprises. By distribution channel, the market includes direct sales, distributors, and online channels. Regionally, the market is divided into North America, Europe, East Asia, South Asia & Pacific, Latin America, and the Middle East & Africa.
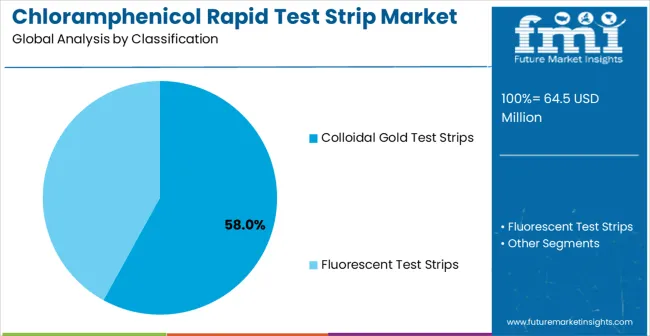
The colloidal gold test strips segment is projected to account for 58.0% of the chloramphenicol rapid test strip market in 2025, reaffirming its position as the leading product category. Regulatory agencies and food testing laboratories increasingly utilize colloidal gold test strips for their superior visual detection capabilities, cost-effectiveness, and ease of use in field testing applications across various sample matrices, including milk, honey, and meat products. Colloidal gold technology's established detection principles and reliable performance directly address the regulatory requirements for rapid screening and operational efficiency in large-scale food safety monitoring programs.
This product segment forms the foundation of modern food safety testing operations, as it represents the technology with the greatest versatility and established market acceptance across multiple regulatory environments and testing applications. Laboratory investments in standardized testing protocols and quality control systems continue to strengthen adoption among food safety professionals. With regulatory agencies prioritizing rapid detection capabilities and cost-effective screening methods, colloidal gold test strips align with both operational efficiency objectives and detection accuracy requirements, making them the central component of comprehensive food safety testing strategies.
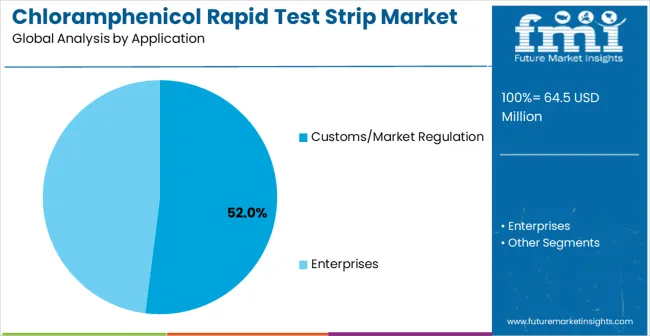
Customs/Market Regulation applications are projected to represent 52.0% of chloramphenicol rapid test strip demand in 2025, underscoring their critical role as the primary regulatory consumers of rapid testing solutions for import/export monitoring and market surveillance activities. Regulatory agencies prefer chloramphenicol rapid test strips for their cost-effectiveness, immediate results, and ability to enhance compliance monitoring while reducing testing complexity and laboratory dependency. Positioned as essential tools for modern regulatory enforcement, rapid test strips offer both operational advantages and detection reliability.
The segment is supported by continuous innovation in regulatory testing protocols and the growing availability of internationally harmonized testing standards that enable consistent enforcement across different jurisdictions. Additionally, customs authorities are investing in portable testing capabilities to support border inspection efficiency and real-time decision-making. As international trade requirements become more stringent and food safety enforcement increases, customs and market regulation agencies will continue to dominate the application market while supporting advanced testing implementation and compliance monitoring strategies.
The chloramphenicol rapid test strip market is advancing rapidly due to increasing regulatory pressure for antibiotic residue monitoring and growing adoption of point-of-care testing solutions that provide immediate results and enhanced food safety compliance across diverse agricultural and food processing applications. The market faces challenges, including detection sensitivity limitations, standardization across different regulatory frameworks, and the need for continuous validation against laboratory reference methods. Innovation in enhanced detection technologies and digital integration continues to influence product development and market expansion patterns.
The growing adoption of enhanced sensitivity detection methods and multiplexed testing capabilities is enabling testing organizations to produce more accurate chloramphenicol detection with improved trace-level sensitivity, reduced false positive rates, and expanded sample matrix compatibility. Advanced detection systems provide improved reliability while allowing more efficient testing protocols and consistent performance across various environmental conditions and sample types. Manufacturers are increasingly recognizing the competitive advantages of advanced detection capabilities for regulatory compliance and premium market positioning.
Modern chloramphenicol rapid test strip producers are incorporating digital reading systems and automated result documentation to enhance testing accuracy, streamline regulatory reporting, and ensure consistent data quality for compliance purposes. These technologies improve testing efficiency while enabling new applications, including real-time monitoring and centralized data management for large-scale surveillance programs. Digital integration also allows testing organizations to support enhanced traceability and regulatory compliance beyond traditional visual interpretation methods.
| Country | CAGR (2025-2035) |
|---|---|
| China | 13.6% |
| India | 12.6% |
| Germany | 11.6% |
| Brazil | 10.6% |
| USA | 9.6% |
| UK | 8.6% |
| Japan | 7.6% |
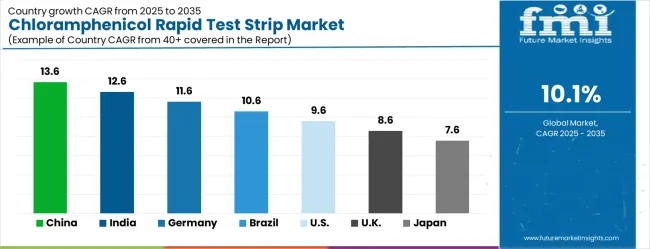
The chloramphenicol rapid test strip market is experiencing strong growth globally, with China leading at a 13.6% CAGR through 2035, driven by the expanding food safety regulatory framework, growing export quality control requirements, and significant investment in agricultural product testing infrastructure development. India follows at 12.6%, supported by increasing dairy industry regulation, enhanced food safety standards, and growing domestic demand for tested agricultural products. Germany shows growth at 11.6%, emphasizing technological innovation and premium testing solution development. Brazil records 10.6%, focusing on agrarian export compliance and regulatory enforcement expansion. USA demonstrates 9.6% growth, prioritizing advanced testing technologies and food safety system integration. The UK exhibits 8.6% growth, emphasizing post-Brexit food safety standards and import monitoring capabilities. Japan shows 7.6% growth, supported by premium food safety requirements and advanced testing protocol implementation.
The report covers an in-depth analysis of 40+ countries, Top-performing countries are highlighted below.
The chloramphenicol rapid test strip market in China is expanding at a CAGR of 13.6%, above the global average of 10.5%. Growth is driven by the food safety, pharmaceutical, and aquaculture sectors, which require fast, accurate detection of antibiotic residues. Industrial clusters deploy rapid test strips in laboratories, food processing units, and quality control facilities to ensure compliance with safety standards. Pilot programs demonstrate reduced testing time and higher detection accuracy. Suppliers focus on cost-effective, sensitive, and high-throughput systems for large-scale operations. Regulatory frameworks supporting food safety and stringent monitoring requirements further accelerate adoption. Research collaborations with universities and food testing laboratories enhance innovation and efficiency.
India is projected to grow at a CAGR of 12.6%, above the global average. Expansion is supported by pharmaceutical manufacturing, dairy, and aquaculture industries adopting rapid test strips to detect chloramphenicol residues. Test strips improve testing efficiency, reduce laboratory turnaround times, and enhance product safety. Industrial clusters implement high-sensitivity strips to maintain regulatory compliance. Pilot programs show faster testing cycles and higher throughput. Suppliers provide scalable, cost-effective solutions suitable for small and large-scale facilities. Increasing government regulations on food safety and export quality requirements further drive market adoption.
Germany grows at a CAGR of 11.6%, above the global average. Growth is LED by pharmaceutical and food processing sectors requiring precise and rapid detection of chloramphenicol residues. Test strips are deployed in laboratories and industrial units to ensure quality and safety. Suppliers focus on high-sensitivity, durable, and easy-to-use strips for commercial applications. Pilot programs demonstrate faster detection, reduced errors, and improved operational efficiency. Industrial clusters integrate test strips into automated quality control workflows. Research initiatives focus on enhancing detection limits, stability, and reliability of rapid tests.
The Brazilian market grows at a CAGR of 10.6%, slightly above the global average. Growth is supported by food safety, pharmaceutical, and aquaculture industries that rely on rapid, accurate testing. Test strips are applied to detect antibiotic residues in dairy, meat, and seafood products. Industrial clusters implement scalable and sensitive testing solutions to reduce operational time. Pilot programs demonstrate improved detection accuracy and reduced laboratory workload. Suppliers focus on durable and cost-efficient strips suitable for large-scale applications. Government initiatives promoting food safety and quality inspections further encourage adoption.
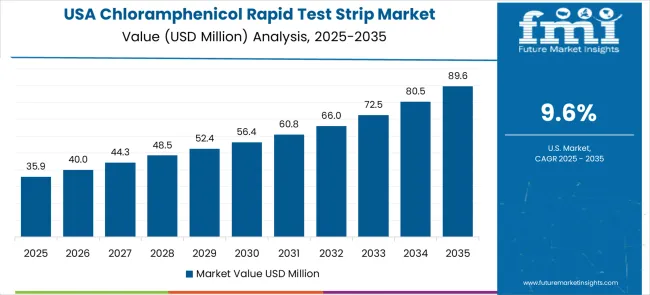
The United States grows at a CAGR of 9.6%, slightly below the global average. Growth is moderated by a mature food and pharmaceutical testing infrastructure. Rapid test strips are deployed in laboratories, pharmaceutical facilities, and food processing plants to ensure safety and regulatory compliance. Suppliers provide sensitive, reliable, and easy-to-use strips capable of high-throughput testing. Pilot installations demonstrate faster testing and higher detection precision. Industrial hubs integrate strips into automated quality control systems. Research efforts focus on improving sensitivity, stability, and operational efficiency of testing solutions.
The UK market grows at a CAGR of 8.6%, below the global average. Slower growth reflects a mature food safety and pharmaceutical testing market. Rapid test strips are deployed in laboratories, food processing, and aquaculture sectors to improve efficiency and reduce testing times. Suppliers provide reliable, easy-to-use, and sensitive strips for commercial applications. Pilot programs demonstrate enhanced detection accuracy and workflow efficiency. Industrial clusters adopt test strips to maintain consistent compliance with regulatory standards. Rising demand for quality assurance in exports supports steady adoption.
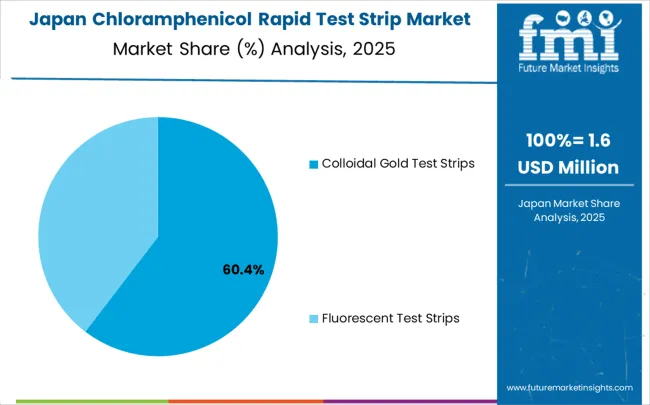
Japan grows at a CAGR of 7.6%, below the global average. Slower growth is influenced by a mature chemical, pharmaceutical, and food testing sector. Test strips are deployed in laboratories, aquaculture, and food processing plants to detect chloramphenicol residues rapidly and accurately. Suppliers focus on durable, sensitive, and cost-effective solutions suitable for small and large-scale operations. Pilot programs demonstrate reduced testing time and improved precision. Industrial clusters integrate strips into routine quality control protocols. Research initiatives aim to improve sensitivity, shelf-life, and ease of use of test strips.
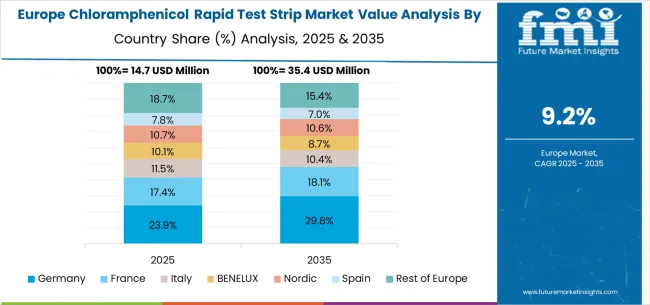
The chloramphenicol rapid test strip market in Europe is projected to grow from USD 14.2 million in 2025 to USD 29.8 million by 2035, registering a CAGR of 7.7% over the forecast period. Germany is expected to maintain its leadership position with a 28.0% market share in 2025, slightly increasing to 28.5% by 2035, supported by its strong food safety regulatory framework, advanced testing infrastructure, and comprehensive import monitoring systems serving major European markets.
France follows with a 19.0% share in 2025, projected to reach 19.2% by 2035, driven by robust demand for agricultural product testing, enhanced dairy industry monitoring, and established food safety protocols incorporating rapid testing methods. The United Kingdom holds a 17.0% share in 2025, expected to increase to 17.5% by 2035, supported by enhanced post-Brexit import controls and independent food safety standards requiring comprehensive testing capabilities. Italy commands a 13.0% share in 2025, projected to reach 13.2% by 2035, while Spain accounts for 11.0% in 2025, expected to reach 11.3% by 2035. The Netherlands maintains a 4.0% share in 2025, growing to 4.2% by 2035. The Rest of Europe region, including Nordic countries, Eastern Europe, Portugal, Belgium, Switzerland, and Austria, is anticipated to gain momentum, expanding its collective share from 8.0% to 6.1% by 2035, attributed to increasing adoption of food safety testing requirements in Nordic countries and growing regulatory enforcement activities across Eastern European markets implementing EU food safety standards.
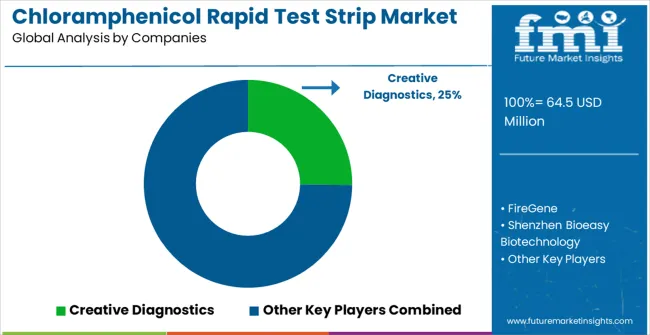
The chloramphenicol rapid test strip market is characterized by competition among established diagnostic companies, specialized rapid testing technology providers, and integrated food safety solution manufacturers. Companies are investing in advanced detection technology research, sensitivity enhancement, quality control systems, and comprehensive product portfolios to deliver accurate, reliable, and cost-effective chloramphenicol testing solutions. Innovation in detection sensitivity, digital integration, and multi-analyte capabilities is central to strengthening market position and competitive advantage.
Creative Diagnostics leads the market with a strong market share, offering comprehensive rapid testing solutions with a focus on regulatory compliance applications and laboratory distribution. FireGene provides specialized biotechnology capabilities with an emphasis on enhanced detection sensitivity and innovative testing platforms. Shenzhen Bioeasy Biotechnology delivers innovative rapid testing solutions with a focus on user-friendly design and application versatility. Shandong Meizheng Bio-Technology specializes in colloidal gold testing technologies and integrated detection systems. Beijing Kwinbon Technology focuses on advanced detection methods and automated testing solutions. Beijing Nbgen offers specialized rapid testing products with emphasis on Asian markets and regulatory applications.
Chloramphenicol rapid test strips represent a critical food safety technology enabling real-time detection of antibiotic residues in agricultural products, with the market projected to grow from USD 64.5 million in 2025 to USD 168.9 million by 2035 at a 10.1% CAGR. As regulatory pressure intensifies globally and consumer demand for food safety assurance increases, scaling this market requires coordinated action across government regulators, international standards bodies, diagnostic technology developers, food processing companies, agricultural producers, and investment partners to address the complex challenges of detection sensitivity, regulatory harmonization, and supply chain integration.
How Governments Could Strengthen Regulatory Infrastructure?
Harmonized Testing Standards: Establish internationally recognized chloramphenicol detection limits and testing protocols that enable mutual recognition of rapid test results across major trading partners. Create unified certification pathways for test strip manufacturers seeking multi-jurisdictional market access, reducing regulatory complexity and compliance costs.
Border Control Enhancement: Invest in training programs for customs officials and border inspection personnel on proper rapid test strip usage, result interpretation, and documentation procedures. Establish mobile testing laboratories at major import/export points equipped with advanced rapid testing capabilities and real-time reporting systems.
Regulatory Enforcement Support: Provide targeted funding for food safety agencies to implement comprehensive chloramphenicol monitoring programs using rapid test strips, particularly focusing on high-risk agricultural imports and domestic production facilities with history of violations.
Technology Validation Programs: Fund comparative studies between rapid test strips and laboratory reference methods to establish detection accuracy benchmarks, sensitivity thresholds, and acceptable false positive/negative rates for regulatory decision-making.
Market Surveillance Networks: Develop integrated data systems that track chloramphenicol detection patterns across regions, enabling predictive enforcement and early identification of contamination trends in specific agricultural sectors or geographic areas.
How International Standards Bodies Could Enable Market Growth?
Detection Sensitivity Standards: Develop globally accepted minimum detection limits for chloramphenicol rapid test strips across different food matrices (milk, honey, meat, aquaculture products), ensuring consistent performance expectations and regulatory acceptance worldwide.
Quality Assurance Protocols: Establish comprehensive validation requirements for rapid test strip manufacturers, including stability testing, cross-reactivity studies, and performance verification under various environmental conditions typically encountered in field testing scenarios.
Proficiency Testing Programs: Create international proficiency testing schemes for laboratories and regulatory agencies using rapid test strips, ensuring consistent interpretation of results and maintaining detection accuracy across different operators and testing environments.
Digital Integration Standards: Define data formats and reporting protocols for digital test readers and automated documentation systems, enabling seamless integration with food safety management systems and regulatory databases.
Training and Certification: Develop standardized training curricula and certification programs for rapid test operators, ensuring consistent testing procedures and reliable results across different organizations and geographic regions.
How Diagnostic Technology Companies Could Advance the Ecosystem?
Enhanced Detection Technologies: Develop next-generation fluorescent and colloidal gold test strips with improved sensitivity below current detection limits, enabling trace-level chloramphenicol detection that meets evolving regulatory requirements and consumer safety expectations.
Digital Integration Solutions: Create smartphone-compatible test readers with automated result interpretation, digital documentation, and cloud-based data management that streamline regulatory reporting and enable real-time monitoring across supply chains.
Multi-Analyte Platforms: Develop test strips capable of simultaneous detection of chloramphenicol and other prohibited antibiotics, reducing testing time and costs while providing comprehensive antibiotic residue screening in single-use formats.
Sample Preparation Innovation: Design simplified sample preparation kits that minimize technical expertise requirements while maintaining detection accuracy, enabling widespread adoption by smaller agricultural producers and processing facilities.
Cold Chain Solutions: Develop temperature-stable test strip formulations and packaging systems that maintain performance integrity during transportation and storage in diverse climatic conditions, particularly for emerging markets with limited cold storage infrastructure.
How Food Processing Companies Could Optimize Implementation?
Supply Chain Integration: Implement rapid test strip protocols at critical control points throughout processing operations, from raw material receiving through finished product verification, ensuring comprehensive chloramphenicol monitoring and regulatory compliance.
Supplier Qualification Programs: Establish mandatory rapid testing requirements for agricultural suppliers, providing training and technical support to ensure consistent testing practices and accurate result reporting across diverse supplier networks.
Quality Management Systems: Integrate rapid test strip results into existing HACCP and quality assurance programs, creating automated decision-making protocols for product acceptance, rejection, and corrective action implementation based on chloramphenicol detection levels.
Technology Partnerships: Collaborate with diagnostic companies on customized testing solutions for specific product lines or processing conditions, including specialized sample preparation methods and detection protocols optimized for unique operational requirements.
Data Analytics Implementation: Deploy data management systems that track testing patterns, identify trends in chloramphenicol detection, and enable predictive risk assessment for supplier performance and product quality management.
How Agricultural Producers Could Strengthen Primary Prevention?
On-Farm Testing Capabilities: Implement rapid test strip protocols for pre-harvest and pre-processing screening, enabling immediate identification of chloramphenicol contamination and preventing contaminated products from entering the food supply chain.
Veterinary Partnership Programs: Establish collaborative relationships with veterinarians to implement responsible antibiotic use protocols, regular monitoring programs, and rapid testing verification to ensure compliance with withdrawal periods and treatment guidelines.
Traceability Systems: Develop comprehensive record-keeping systems that document antibiotic treatments, withdrawal periods, and rapid test results, enabling complete product traceability and rapid response to contamination incidents or regulatory inquiries.
Cooperative Testing Networks: Form producer cooperatives that share rapid testing resources, technical expertise, and bulk purchasing agreements to reduce individual testing costs while maintaining consistent monitoring capabilities across member operations.
Training and Education Programs: Participate in comprehensive education initiatives on proper antibiotic use, withdrawal period compliance, and rapid testing procedures to minimize chloramphenicol residue risks and ensure consistent product quality.
How Investment Partners Could Accelerate Market Development?
Technology Innovation Funding: Support research and development initiatives focused on breakthrough detection technologies, including biosensor integration, artificial intelligence-enhanced result interpretation, and next-generation sensitivity improvements that could revolutionize rapid testing capabilities.
Manufacturing Capacity Expansion: Finance production facility development in key geographic markets, particularly in Asia-Pacific regions where demand growth is strongest, ensuring adequate supply capacity to meet projected market expansion requirements.
Market Access Financing: Provide working capital and market development funding for rapid test strip manufacturers seeking regulatory approvals in multiple jurisdictions, reducing barriers to international market expansion and accelerating global availability.
Supply Chain Infrastructure: Invest in cold storage and distribution networks that maintain test strip integrity during transportation and storage, particularly in emerging markets where infrastructure limitations currently constrain market development.
Digital Platform Development: Support software companies developing comprehensive food safety management platforms that integrate rapid testing data with supply chain tracking, regulatory reporting, and quality management systems.
China Leadership (13.6% CAGR): Leverage the country's massive agricultural production and expanding export quality control requirements by supporting technology transfer initiatives, manufacturing capacity development, and regulatory framework enhancement that maintains cost advantages while meeting international standards.
India Growth Potential (12.6% CAGR): Capitalize on the world's largest dairy industry by developing specialized test strips for milk testing, establishing cooperative testing networks, and supporting regulatory infrastructure development that enables both domestic food safety and export market access.
European Excellence (7.7% Market CAGR): Build on Germany's 11.6% growth and established regulatory leadership by promoting advanced detection technologies, digital integration solutions, and comprehensive training programs that set global benchmarks for rapid testing accuracy and regulatory compliance.
Americas Integration: Support Brazil's 10.6% growth and USA technological advancement by facilitating cross-border technology partnerships, harmonizing testing standards, and developing integrated supply chain monitoring systems that strengthen food safety across both North and South American markets.
| Items | Values |
|---|---|
| Quantitative Units (2025) | USD 64.5 million |
| Product Type | Colloidal Gold Test Strips, Fluorescent Test Strips, Others |
| Application | Customs/Market Regulation, Enterprises |
| Distribution Channel | Direct Sales, Distributors, Online Channels |
| Regions Covered | North America, Europe, East Asia, South Asia & Pacific, Latin America, Middle East & Africa |
| Countries Covered | United States, Canada, United Kingdom, Germany, France, China, Japan, South Korea, India, Brazil, Australia and 40+ countries |
| Key Companies Profiled | Creative Diagnostics, FireGene, Shenzhen Bioeasy Biotechnology, Shandong Meizheng Bio-Technology, Beijing Kwinbon Technology, and Beijing Nbgen |
| Additional Attributes | Dollar sales by product type and application category, regional demand trends, competitive landscape, technological advancements in detection systems, digital integration innovation, sensitivity enhancement development, and regulatory compliance optimization |
The global chloramphenicol rapid test strip market is estimated to be valued at USD 64.5 million in 2025.
The market size for the chloramphenicol rapid test strip market is projected to reach USD 168.9 million by 2035.
The chloramphenicol rapid test strip market is expected to grow at a 10.1% CAGR between 2025 and 2035.
The key product types in chloramphenicol rapid test strip market are colloidal gold test strips and fluorescent test strips.
In terms of application, customs/market regulation segment to command 52.0% share in the chloramphenicol rapid test strip market in 2025.


Our Research Products

The "Full Research Suite" delivers actionable market intel, deep dives on markets or technologies, so clients act faster, cut risk, and unlock growth.

The Leaderboard benchmarks and ranks top vendors, classifying them as Established Leaders, Leading Challengers, or Disruptors & Challengers.

Locates where complements amplify value and substitutes erode it, forecasting net impact by horizon

We deliver granular, decision-grade intel: market sizing, 5-year forecasts, pricing, adoption, usage, revenue, and operational KPIs—plus competitor tracking, regulation, and value chains—across 60 countries broadly.

Spot the shifts before they hit your P&L. We track inflection points, adoption curves, pricing moves, and ecosystem plays to show where demand is heading, why it is changing, and what to do next across high-growth markets and disruptive tech

Real-time reads of user behavior. We track shifting priorities, perceptions of today’s and next-gen services, and provider experience, then pace how fast tech moves from trial to adoption, blending buyer, consumer, and channel inputs with social signals (#WhySwitch, #UX).

Partner with our analyst team to build a custom report designed around your business priorities. From analysing market trends to assessing competitors or crafting bespoke datasets, we tailor insights to your needs.
Supplier Intelligence
Discovery & Profiling
Capacity & Footprint
Performance & Risk
Compliance & Governance
Commercial Readiness
Who Supplies Whom
Scorecards & Shortlists
Playbooks & Docs
Category Intelligence
Definition & Scope
Demand & Use Cases
Cost Drivers
Market Structure
Supply Chain Map
Trade & Policy
Operating Norms
Deliverables
Buyer Intelligence
Account Basics
Spend & Scope
Procurement Model
Vendor Requirements
Terms & Policies
Entry Strategy
Pain Points & Triggers
Outputs
Pricing Analysis
Benchmarks
Trends
Should-Cost
Indexation
Landed Cost
Commercial Terms
Deliverables
Brand Analysis
Positioning & Value Prop
Share & Presence
Customer Evidence
Go-to-Market
Digital & Reputation
Compliance & Trust
KPIs & Gaps
Outputs
Full Research Suite comprises of:
Market outlook & trends analysis
Interviews & case studies
Strategic recommendations
Vendor profiles & capabilities analysis
5-year forecasts
8 regions and 60+ country-level data splits
Market segment data splits
12 months of continuous data updates
DELIVERED AS:
PDF EXCEL ONLINE
Chloramphenicol Test Kits Market Size and Share Forecast Outlook 2025 to 2035
Rapid U-drills Market Size and Share Forecast Outlook 2025 to 2035
Rapid Prototyping Materials Market Size and Share Forecast Outlook 2025 to 2035
Rapid Strength Concrete Market Size and Share Forecast Outlook 2025 to 2035
Rapid Self-Healing Gel Market Size and Share Forecast Outlook 2025 to 2035
Rapid Infuser Market Size, Growth, and Forecast 2025 to 2035
Market Leaders & Share in the Rapid Infuser Industry
Rapid Cook-High Speed Ovens Market
Rapid Test Cards Market Size and Share Forecast Outlook 2025 to 2035
Rapid Test Readers Market Size and Share Forecast Outlook 2025 to 2035
Rapid RNA Testing Kits Market Trends- Growth & Forecast 2025 to 2035
Rapid Antigen Testing Market - Demand, Growth & Forecast 2025 to 2035
Rapid Hepatitis Testing Market – Demand & Forecast 2025 to 2035
Rapid Coagulation Testing Market
Rapid Microbiology Testing Market Forecast Outlook 2025 to 2035
Rapid Plasma Reagin Test Market
Mono Rapid Testing Market Size and Share Forecast Outlook 2025 to 2035
Veterinary Rapid Test Market Size and Share Forecast Outlook 2025 to 2035
Veterinary Rapid Tests Market Size and Share Forecast Outlook 2025 to 2035
Malaria Ag Rapid Testing Market - Growth & Forecast 2025 to 2035

Thank you!
You will receive an email from our Business Development Manager. Please be sure to check your SPAM/JUNK folder too.
Chat With
MaRIA