Immunoturbidimetric Kits Market Size and Share Forecast Outlook 2025 to 2035

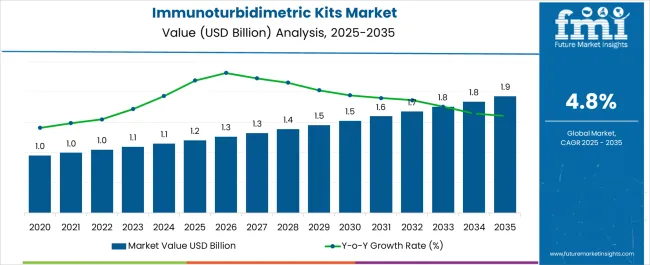
The Immunoturbidimetric Kits Market is estimated to be valued at USD 1.2 billion in 2025 and is projected to reach USD 1.9 billion by 2035, registering a compound annual growth rate (CAGR) of 4.8% over the forecast period.
Quick Stats for Immunoturbidimetric Kits Market

  • Immunoturbidimetric Kits Market Industry Value (2025): USD 1.2 billion
  • Immunoturbidimetric Kits Market Forecast Value (2035): USD 1.9 billion
  • Immunoturbidimetric Kits Market Forecast CAGR: 4.8%
  • Leading Segment in Immunoturbidimetric Kits Market in 2025: Reagent Kits (38.6%)
  • Key Growth Region in Immunoturbidimetric Kits Market: North America, Asia-Pacific, Europe
  • Top Key Players in Immunoturbidimetric Kits Market: DiaSys Diagnostic Systems GmbH, Creative Diagnostics, mti diagnostics, Biogenix Inc. Pvt. Ltd., Reckon Diagnostics Pvt. Ltd., Siemens Healthineers, F. Hoffmann-La Roche Ltd, Randox Laboratories Ltd., Diazyme Laboratories, Inc., FUJIFILM Wako Chemicals Europe GmbH, Erba Group, Eurolyser Diagnostica GmbH

Immunoturbidimetric Kits Market Market Value Analysis

Metric Value
Immunoturbidimetric Kits Market Estimated Value in (2025 E) USD 1.2 billion
Immunoturbidimetric Kits Market Forecast Value in (2035 F) USD 1.9 billion
Forecast CAGR (2025 to 2035) 4.8%

Rationale for Segmental Growth in the Immunoturbidimetric Kits Market

The immunoturbidimetric kits market is expanding steadily due to the rising prevalence of chronic diseases, increasing adoption of automated diagnostic platforms, and demand for cost effective yet reliable testing solutions. These kits are widely used in clinical laboratories and hospitals for the quantitative determination of proteins, enzymes, and other analytes critical in disease diagnosis and monitoring.

Advancements in assay sensitivity, coupled with compatibility with high throughput analyzers, have reinforced their role in modern diagnostics. The growing shift toward early disease detection and preventive healthcare strategies is further driving demand.

Regulatory emphasis on diagnostic accuracy and efficiency is encouraging laboratories to integrate advanced immunoturbidimetric kits. The market outlook remains positive as ongoing innovation in assay design and automated platforms continues to enhance performance, scalability, and accessibility in diverse healthcare settings.

Segmental Analysis

Insights into the Reagent Kits Product Segment

The reagent kits segment is expected to account for 38.60% of the total revenue by 2025 within the product category, establishing itself as a leading sub segment. Growth in this segment is driven by the rising need for standardized, ready to use solutions that reduce variability and improve reliability in laboratory testing.

Their compatibility with automated analyzers and ability to provide consistent performance have supported their widespread adoption.

In addition, the scalability of reagent kits allows laboratories to manage both routine and specialized testing efficiently, reinforcing their market leadership.
Insights into the Serum Sample Type Segment

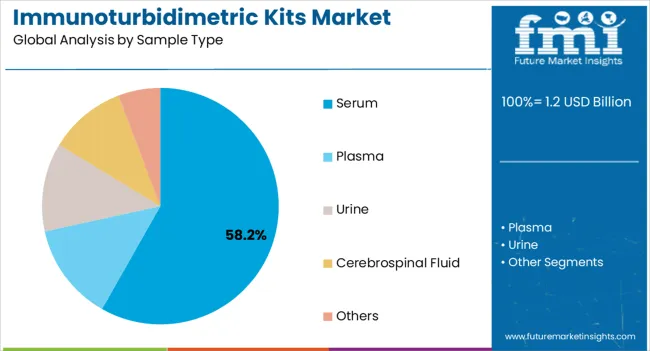
Immunoturbidimetric Kits Market Analysis By Sample Type

The serum sample type segment is projected to hold 58.20% of total revenue by 2025, making it the most significant sample type category. Serum remains the preferred matrix for immunoturbidimetric testing due to its stability, accuracy, and ability to provide clear insights into protein and biomarker levels.

Widespread clinical reliance on serum samples for diagnostic applications has further strengthened this segment.

Its compatibility with high throughput analyzers and suitability for large scale testing environments continue to underpin its dominance.
Insights into the Latex Enhanced Immunoturbidimetric Assay Technology Segment

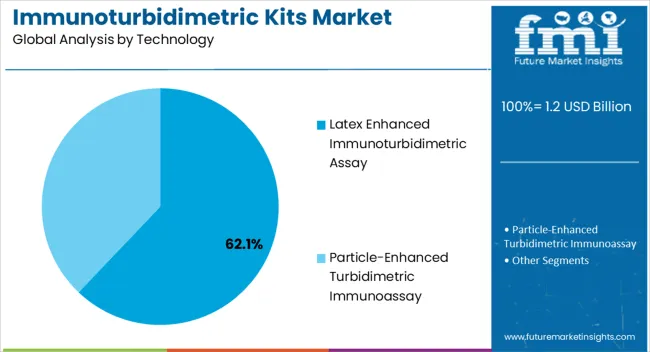
Immunoturbidimetric Kits Market Analysis By Technology

The latex enhanced immunoturbidimetric assay technology segment is anticipated to represent 62.10% of market revenue by 2025, positioning it as the most dominant technology. This is attributed to its high sensitivity, rapid turnaround time, and ability to detect low concentrations of analytes with enhanced precision.

The technique’s efficiency in handling a wide range of biomarkers and compatibility with automated systems have further driven adoption.

Continuous improvements in latex particle technology have contributed to improved assay performance, ensuring this technology remains central to the immunoturbidimetric kits market.

Comparison of Historical vs Future Outlook for Immunoturbidimetric Kits Market (2020 to 2035)

From 2012 to 2025, the global immunoturbidimetric kits market experienced a CAGR of 2.5%, reaching a market size of USD 1.2 billion in 2025.

From 2012 to 2025, Over time, the market for immunoturbidimetric kits has grown consistently. Immunoturbidimetric assays are increasingly being used to measure a variety of biomarkers due to its versatility, simplicity, and accuracy. Standardized, ready-to-use immunoturbidimetric kits have emerged on the market, increasing the effectiveness and dependability of testing.

Future Forecast for Immunoturbidimetric Kits Industry:

Looking ahead, the global immunoturbidimetric kits industry is expected to rise at a CAGR of 5.1% from 2025 to 2035. During the forecast period, the market size is expected to reach USD 1.90 billion by 2035.

In the upcoming years, the market for immunoturbidimetric kits is anticipated to maintain its upward trend. The prevalence of infectious and chronic diseases is rising, and early disease diagnosis is becoming increasingly important. These and other factors are projected to fuel market growth.

The market is anticipated to profit from continuous technological developments, such as enhanced multiplexing and detecting systems. These developments will increase the immunoturbidimetric assays' sensitivity, specificity, and adaptability, extending the range of diseases and research sectors for which they can be used.
Analysis of Top Countries Adopting Immunoturbidimetric Kits

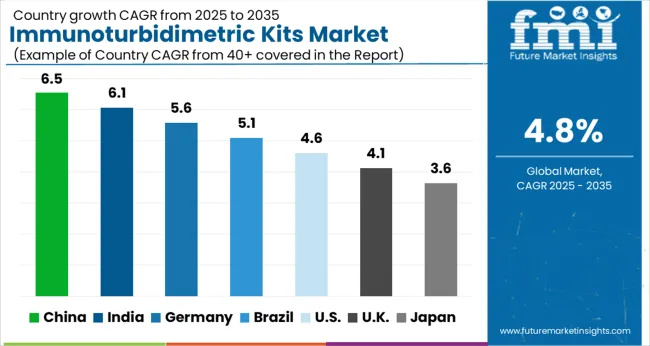
Immunoturbidimetric Kits Market Cagr Analysis By Country

Immunoturbidimetric Kits Market to Surge in the United States Due to Adoption of Automated Systems

Country The United States
Market Size (USD million) by End of Forecast Period (2035) USD 1.9 million
CAGR % 2025 to End of Forecast (2035) 6.4%

The immunoturbidimetric kits industry in the United States is expected to reach a market size of USD 1.9 million by 2035, expanding at a CAGR of 6.4%. The USA healthcare system is increasingly adopting automated laboratory systems to improve efficiency, reduce errors, and streamline workflow.

Immunoturbidimetric kits are compatible with automated platforms, allowing for high-throughput testing and integration with laboratory information systems (LIS). The adoption of automated systems in clinical laboratories drives the demand for immunoturbidimetric kits, contributing to market growth.

Technological Advancements for Immunoturbidimetric Kits by Healthcare Professional to Propel the United Kingdom Market Growth

Country The United Kingdom
Market Size (USD million) by End of Forecast Period (2035) USD 58.7 million
CAGR % 2025 to End of Forecast (2035) 4.9%

The immunoturbidimetric kits industry in the United Kingdom is expected to reach a market value of USD 58.7 million, expanding at a CAGR of 4.9% during the forecast period. The UK is known for its advancements in medical technology and diagnostic assays.

The development and adoption of advanced immunoturbidimetric assays, improved reagents, automated platforms, and enhanced detection systems contribute to the growth of the Immunoturbidimetric Kits market. Technological advancements improve the accuracy, sensitivity, and speed of testing, making immunoturbidimetric kits a preferred choice for diagnostic laboratories and healthcare providers in the UK

Notable Growth Expected in China's Immunoturbidimetric Kits Market as Growing Emphasis on Preventive Healthcare

Country China
Market Size (USD million) by End of Forecast Period (2035) USD 215.9 million
CAGR % 2025 to End of Forecast (2035) 7.9%

The immunoturbidimetric kits industry in China is anticipated to reach a market size of USD 215.9 million, moving at a CAGR of 7.9% during the forecast period. There is an increasing emphasis on preventive healthcare in China, with a focus on early disease detection and management.

Immunoturbidimetric kits play a vital role in preventive health check-ups and screening programs by providing rapid and accurate results for a wide range of biomarkers. The implementation of preventive healthcare initiatives by the Chinese government and healthcare organizations drives the demand for immunoturbidimetric kits.

Preventive Healthcare Initiatives to Drive Market Growth in Japan

Country Japan
Market Size (USD million) by End of Forecast Period (2035) USD 81.1 million
CAGR % 2025 to End of Forecast (2035) 6.6%

The immunoturbidimetric kits industry in Japan is estimated to reach a market size of USD 81.1 million by 2035, thriving at a CAGR of 6.6%. The Japanese government emphasizes preventive healthcare and encourages regular health check-ups for early disease detection and management.

Immunoturbidimetric kits play a vital role in preventive health screenings by providing rapid and accurate results for a wide range of biomarkers. The implementation of preventive healthcare programs and initiatives by the Japanese government and healthcare organizations drives the demand for immunoturbidimetric kits.
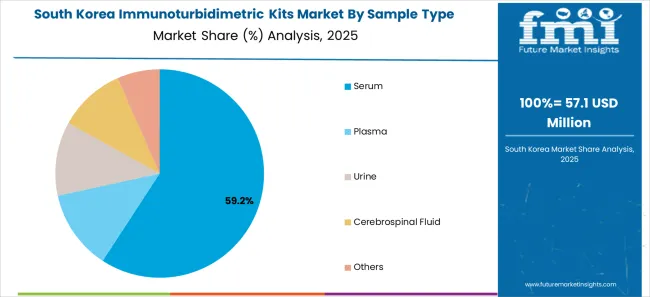
Demand for Immunoturbidimetric Kits is Rising Due to Government Support and Initiatives to Fuel Market Growth in South Korea

Immunoturbidimetric Kits Market South Korea Market Share Analysis By Sample Type

Country South Korea
Market Size (USD million) by End of Forecast Period (2035) USD 53.4 million
CAGR % 2025 to End of Forecast (2035) 5.7%

The immunoturbidimetric kits industry in South Korea is expected to reach a market size of USD 53.4 million, expanding at a CAGR of 5.7% during the forecast period. South Korean government supports healthcare innovation and has implemented initiatives to promote the development and adoption of advanced diagnostic technologies.

These initiatives include funding research projects, supporting collaborations between academia and industry, and providing regulatory guidelines for the approval and commercialization of immunoturbidimetric kits. Government support contributes to the growth of the Immunoturbidimetric Kits market in South Korea.

Immunoturbidimetric Kits Industry Analysis by Category

Reagent Kits to Dominate Immunoturbidimetric Kits Industry with 5.8% CAGR through 2035

Reagent kits is expected to dominate the immunoturbidimetric kits industry with a CAGR of 5.8% from 2025 to 2035. Reagent kits provide pre-optimized and standardized chemicals, removing the need for lab technicians to make reagents from scratch. This shortens the testing procedure, lowers the likelihood of mistakes, and saves time in the lab.

Reagent kits are produced using stringent quality control procedures to guarantee reliable performance. The accuracy of measurements is improved and variability is reduced when standardized reagents are used, which is essential in clinical diagnostics.

Which Sample Type is Driving the Growth of Market?

The Serum sample is expected to dominate the immunoturbidimetric kits industry with a CAGR of 6.5% from 2025 to 2035. Serum contains a wide range of biomarkers, including proteins, enzymes, hormones, lipids, and other analytes. These biomarkers provide valuable information about various diseases, organ function, and overall health status.

Immunoturbidimetric assays performed on serum samples enable the quantitative measurement of these biomarkers, facilitating disease diagnosis, prognosis, and treatment monitoring. The clinical relevance of serum biomarkers drives the demand for immunoturbidimetric kits.

Which Technology is Driving the Immunoturbidimetric Kits Market?

Latex enhanced immunoturbidimetric assay is expected to dominate the immunoturbidimetric kits industry with a CAGR of 4.7% from 2025 to 2035. Latex-enhanced immunoturbidimetric assays offer improved sensitivity compared to conventional immunoturbidimetry.

The use of latex particles coated with antibodies or antigens increases the surface area available for the binding of analytes, resulting in enhanced detection capabilities. This increased sensitivity allows for the measurement of analytes at lower concentrations, expanding the range of applications and driving the demand for immunoturbidimetric kits.

How the Infectious Disease Applications are Driving the Immunoturbidimetric Kits Market?

The Infectious disease are expected to dominate the immunoturbidimetric kits industry with a CAGR of 4.3% from 2025 to 2035. The rise of infectious diseases has increased the need for precise and effective diagnostic methods. Infectious diseases are a major problem for global health.

Antigens, antibodies, and pathogen-specific proteins are among the infectious illness indicators that can be accurately and quantitatively measured using immunoturbidimetric techniques. The market has grown as a result of the widespread use of immunoturbidimetric kits in clinical laboratories and healthcare facilities to identify and track infectious illnesses.

Which End User is Widely Adopted the Immunoturbidimetric Kits?

The hospital segment is expected to dominate the immunoturbidimetric kits industry with a CAGR of 6.2% from 2025 to 2035. Hospitals typically handle a large volume of patient samples on a daily basis. Immunoturbidimetric assays, which are widely used in clinical laboratories, offer a reliable and efficient method for quantitatively measuring various analytes in patient samples. The high testing volume in hospitals has contributed to the increased adoption of immunoturbidimetric kits, supporting the growth of the market.

Top Segments Studied in the Immunoturbidimetric Kits Market Research Report

By Product:

  • Reagent Kits
    • Albumin Test Kits
    • Microglobulin Albumin Test Kits
    • C-Reactive Protein Test Kits
    • Fibrinogen Test Kits
    • Fibronectin Test Kits
    • Myoglobin Test Kits
    • Kappa Light Chains Kits
    • Lambda Light Chains Kits
    • Transferrin Test Kits
    • Glycoprotein Test Kits
    • Antitrypsin Test Kits
    • Apolipoprotein B Test Kits
    • Cystatin Test Kits
    • Ferritin Test Kits
    • Immunoglobulin Test Kits
    • Lipoprotein Test Kits
    • Others
  • Controls Kits & Calibrators

By Sample Type:

  • Serum
  • Plasma
  • Urine
  • Cerebrospinal Fluid
  • Others

By Technology:

  • Latex Enhanced Immunoturbidimetric Assay
  • Particle-Enhanced Turbidimetric Immunoassay

By Application:

  • Infectious disease
  • Cardiac Disease
  • Diabetes
  • Autoimmune Disorders
  • Inflammatory maker
  • Kidney & Liver Disease
  • Oncology
  • Others

By End User:

  • Hospital
  • Specialty Clinics
  • Academic and Research Institute
  • Diagnostics Laboratories
  • Reference Laboratories
  • Cancer Research Institutes
  • Veterinary Hospitals
  • Blood Banks

By Region:

  • North America
  • Latin America
  • Europe
  • East Asia
  • South Asia
  • Oceania
  • Middle East & Africa

Frequently Asked Questions

How big is the immunoturbidimetric kits market in 2025?

The global immunoturbidimetric kits market is estimated to be valued at USD 1.2 billion in 2025.

What will be the size of immunoturbidimetric kits market in 2035?

The market size for the immunoturbidimetric kits market is projected to reach USD 1.9 billion by 2035.

How much will be the immunoturbidimetric kits market growth between 2025 and 2035?

The immunoturbidimetric kits market is expected to grow at a 4.8% CAGR between 2025 and 2035.

What are the key product types in the immunoturbidimetric kits market?

The key product types in immunoturbidimetric kits market are reagent kits, _albumin test, _microglobulin albumin test, _c-reactive protein test, _fibrinogen test, _fibronectin test, _haptoglobin test, _kappa light chains, _lambda light chains, _transferrin test, _alpha-1-acid glycoprotein test, _alpha-1-antitrypsin test, _apolipoprotein b test, _cystatin test, _ferritin test, _immunoglobulin test, _lipoprotein test, _others and controls kits/reagents.

Which sample type segment to contribute significant share in the immunoturbidimetric kits market in 2025?

In terms of sample type, serum segment to command 58.2% share in the immunoturbidimetric kits market in 2025.

Table of Content

  1. Executive Summary
    • Global Market Outlook
    • Demand-side Trends
    • Supply-side Trends
    • Technology Roadmap Analysis
    • Analysis and Recommendations
  2. Market Overview
    • Market Coverage / Taxonomy
    • Market Definition / Scope / Limitations
  3. Market Background
    • Market Dynamics
      • Drivers
      • Restraints
      • Opportunity
      • Trends
    • Scenario Forecast
      • Demand in Optimistic Scenario
      • Demand in Likely Scenario
      • Demand in Conservative Scenario
    • Opportunity Map Analysis
    • Product Life Cycle Analysis
    • Supply Chain Analysis
    • Investment Feasibility Matrix
    • Value Chain Analysis
    • PESTLE and Porter’s Analysis
    • Regulatory Landscape
    • Regional Parent Market Outlook
    • Production and Consumption Statistics
    • Import and Export Statistics
  4. Global Market Analysis 2020 to 2024 and Forecast, 2025 to 2035
    • Historical Market Size Value (USD Million) Analysis, 2020 to 2024
    • Current and Future Market Size Value (USD Million) Projections, 2025 to 2035
      • Y-o-Y Growth Trend Analysis
      • Absolute $ Opportunity Analysis
  5. Global Market Pricing Analysis 2020 to 2024 and Forecast 2025 to 2035
  6. Global Market Analysis 2020 to 2024 and Forecast 2025 to 2035, By Product
    • Introduction / Key Findings
    • Historical Market Size Value (USD Million) Analysis By Product , 2020 to 2024
    • Current and Future Market Size Value (USD Million) Analysis and Forecast By Product , 2025 to 2035
      • Reagent Kits
        • Albumin Test
        • Microglobulin Albumin Test
        • C-Reactive Protein Test
        • Fibrinogen Test
        • Fibronectin Test
        • Haptoglobin Test
        • Kappa Light Chains
        • Lambda Light Chains
        • Transferrin Test
        • Alpha-1-Acid Glycoprotein Test
      • Controls Kits/Reagents
    • Y-o-Y Growth Trend Analysis By Product , 2020 to 2024
    • Absolute $ Opportunity Analysis By Product , 2025 to 2035
  7. Global Market Analysis 2020 to 2024 and Forecast 2025 to 2035, By Sample Type
    • Introduction / Key Findings
    • Historical Market Size Value (USD Million) Analysis By Sample Type, 2020 to 2024
    • Current and Future Market Size Value (USD Million) Analysis and Forecast By Sample Type, 2025 to 2035
      • Serum
      • Plasma
      • Urine
      • Cerebrospinal Fluid
      • Others
    • Y-o-Y Growth Trend Analysis By Sample Type, 2020 to 2024
    • Absolute $ Opportunity Analysis By Sample Type, 2025 to 2035
  8. Global Market Analysis 2020 to 2024 and Forecast 2025 to 2035, By Technology
    • Introduction / Key Findings
    • Historical Market Size Value (USD Million) Analysis By Technology, 2020 to 2024
    • Current and Future Market Size Value (USD Million) Analysis and Forecast By Technology, 2025 to 2035
      • Latex Enhanced Immunoturbidimetric Assay
      • Particle-Enhanced Turbidimetric Immunoassay
    • Y-o-Y Growth Trend Analysis By Technology, 2020 to 2024
    • Absolute $ Opportunity Analysis By Technology, 2025 to 2035
  9. Global Market Analysis 2020 to 2024 and Forecast 2025 to 2035, By End User
    • Introduction / Key Findings
    • Historical Market Size Value (USD Million) Analysis By End User, 2020 to 2024
    • Current and Future Market Size Value (USD Million) Analysis and Forecast By End User, 2025 to 2035
      • Hospital
      • Specialty Clinics
      • Academic And Research Institute
      • Diagnostics Laboratories
      • Reference Laboratories
      • Cancer Research Institutes
      • Veterinary Hospitals
      • Blood Banks
    • Y-o-Y Growth Trend Analysis By End User, 2020 to 2024
    • Absolute $ Opportunity Analysis By End User, 2025 to 2035
  10. Global Market Analysis 2020 to 2024 and Forecast 2025 to 2035, By Region
    • Introduction
    • Historical Market Size Value (USD Million) Analysis By Region, 2020 to 2024
    • Current Market Size Value (USD Million) Analysis and Forecast By Region, 2025 to 2035
      • North America
      • Latin America
      • Western Europe
      • Eastern Europe
      • East Asia
      • South Asia and Pacific
      • Middle East & Africa
    • Market Attractiveness Analysis By Region
  11. North America Market Analysis 2020 to 2024 and Forecast 2025 to 2035, By Country
    • Historical Market Size Value (USD Million) Trend Analysis By Market Taxonomy, 2020 to 2024
    • Market Size Value (USD Million) Forecast By Market Taxonomy, 2025 to 2035
      • By Country
        • USA
        • Canada
        • Mexico
      • By Product
      • By Sample Type
      • By Technology
      • By End User
    • Market Attractiveness Analysis
      • By Country
      • By Product
      • By Sample Type
      • By Technology
      • By End User
    • Key Takeaways
  12. Latin America Market Analysis 2020 to 2024 and Forecast 2025 to 2035, By Country
    • Historical Market Size Value (USD Million) Trend Analysis By Market Taxonomy, 2020 to 2024
    • Market Size Value (USD Million) Forecast By Market Taxonomy, 2025 to 2035
      • By Country
        • Brazil
        • Chile
        • Rest of Latin America
      • By Product
      • By Sample Type
      • By Technology
      • By End User
    • Market Attractiveness Analysis
      • By Country
      • By Product
      • By Sample Type
      • By Technology
      • By End User
    • Key Takeaways
  13. Western Europe Market Analysis 2020 to 2024 and Forecast 2025 to 2035, By Country
    • Historical Market Size Value (USD Million) Trend Analysis By Market Taxonomy, 2020 to 2024
    • Market Size Value (USD Million) Forecast By Market Taxonomy, 2025 to 2035
      • By Country
        • Germany
        • UK
        • Italy
        • Spain
        • France
        • Nordic
        • BENELUX
        • Rest of Western Europe
      • By Product
      • By Sample Type
      • By Technology
      • By End User
    • Market Attractiveness Analysis
      • By Country
      • By Product
      • By Sample Type
      • By Technology
      • By End User
    • Key Takeaways
  14. Eastern Europe Market Analysis 2020 to 2024 and Forecast 2025 to 2035, By Country
    • Historical Market Size Value (USD Million) Trend Analysis By Market Taxonomy, 2020 to 2024
    • Market Size Value (USD Million) Forecast By Market Taxonomy, 2025 to 2035
      • By Country
        • Russia
        • Poland
        • Hungary
        • Balkan & Baltic
        • Rest of Eastern Europe
      • By Product
      • By Sample Type
      • By Technology
      • By End User
    • Market Attractiveness Analysis
      • By Country
      • By Product
      • By Sample Type
      • By Technology
      • By End User
    • Key Takeaways
  15. East Asia Market Analysis 2020 to 2024 and Forecast 2025 to 2035, By Country
    • Historical Market Size Value (USD Million) Trend Analysis By Market Taxonomy, 2020 to 2024
    • Market Size Value (USD Million) Forecast By Market Taxonomy, 2025 to 2035
      • By Country
        • China
        • Japan
        • South Korea
      • By Product
      • By Sample Type
      • By Technology
      • By End User
    • Market Attractiveness Analysis
      • By Country
      • By Product
      • By Sample Type
      • By Technology
      • By End User
    • Key Takeaways
  16. South Asia and Pacific Market Analysis 2020 to 2024 and Forecast 2025 to 2035, By Country
    • Historical Market Size Value (USD Million) Trend Analysis By Market Taxonomy, 2020 to 2024
    • Market Size Value (USD Million) Forecast By Market Taxonomy, 2025 to 2035
      • By Country
        • India
        • ASEAN
        • Australia & New Zealand
        • Rest of South Asia and Pacific
      • By Product
      • By Sample Type
      • By Technology
      • By End User
    • Market Attractiveness Analysis
      • By Country
      • By Product
      • By Sample Type
      • By Technology
      • By End User
    • Key Takeaways
  17. Middle East & Africa Market Analysis 2020 to 2024 and Forecast 2025 to 2035, By Country
    • Historical Market Size Value (USD Million) Trend Analysis By Market Taxonomy, 2020 to 2024
    • Market Size Value (USD Million) Forecast By Market Taxonomy, 2025 to 2035
      • By Country
        • Kingdom of Saudi Arabia
        • Other GCC Countries
        • Turkiye
        • South Africa
        • Other African Union
        • Rest of Middle East & Africa
      • By Product
      • By Sample Type
      • By Technology
      • By End User
    • Market Attractiveness Analysis
      • By Country
      • By Product
      • By Sample Type
      • By Technology
      • By End User
    • Key Takeaways
  18. Key Countries Market Analysis
    • USA
      • Pricing Analysis
      • Market Share Analysis, 2024
        • By Product
        • By Sample Type
        • By Technology
        • By End User
    • Canada
      • Pricing Analysis
      • Market Share Analysis, 2024
        • By Product
        • By Sample Type
        • By Technology
        • By End User
    • Mexico
      • Pricing Analysis
      • Market Share Analysis, 2024
        • By Product
        • By Sample Type
        • By Technology
        • By End User
    • Brazil
      • Pricing Analysis
      • Market Share Analysis, 2024
        • By Product
        • By Sample Type
        • By Technology
        • By End User
    • Chile
      • Pricing Analysis
      • Market Share Analysis, 2024
        • By Product
        • By Sample Type
        • By Technology
        • By End User
    • Germany
      • Pricing Analysis
      • Market Share Analysis, 2024
        • By Product
        • By Sample Type
        • By Technology
        • By End User
    • UK
      • Pricing Analysis
      • Market Share Analysis, 2024
        • By Product
        • By Sample Type
        • By Technology
        • By End User
    • Italy
      • Pricing Analysis
      • Market Share Analysis, 2024
        • By Product
        • By Sample Type
        • By Technology
        • By End User
    • Spain
      • Pricing Analysis
      • Market Share Analysis, 2024
        • By Product
        • By Sample Type
        • By Technology
        • By End User
    • France
      • Pricing Analysis
      • Market Share Analysis, 2024
        • By Product
        • By Sample Type
        • By Technology
        • By End User
    • India
      • Pricing Analysis
      • Market Share Analysis, 2024
        • By Product
        • By Sample Type
        • By Technology
        • By End User
    • ASEAN
      • Pricing Analysis
      • Market Share Analysis, 2024
        • By Product
        • By Sample Type
        • By Technology
        • By End User
    • Australia & New Zealand
      • Pricing Analysis
      • Market Share Analysis, 2024
        • By Product
        • By Sample Type
        • By Technology
        • By End User
    • China
      • Pricing Analysis
      • Market Share Analysis, 2024
        • By Product
        • By Sample Type
        • By Technology
        • By End User
    • Japan
      • Pricing Analysis
      • Market Share Analysis, 2024
        • By Product
        • By Sample Type
        • By Technology
        • By End User
    • South Korea
      • Pricing Analysis
      • Market Share Analysis, 2024
        • By Product
        • By Sample Type
        • By Technology
        • By End User
    • Russia
      • Pricing Analysis
      • Market Share Analysis, 2024
        • By Product
        • By Sample Type
        • By Technology
        • By End User
    • Poland
      • Pricing Analysis
      • Market Share Analysis, 2024
        • By Product
        • By Sample Type
        • By Technology
        • By End User
    • Hungary
      • Pricing Analysis
      • Market Share Analysis, 2024
        • By Product
        • By Sample Type
        • By Technology
        • By End User
    • Kingdom of Saudi Arabia
      • Pricing Analysis
      • Market Share Analysis, 2024
        • By Product
        • By Sample Type
        • By Technology
        • By End User
    • Turkiye
      • Pricing Analysis
      • Market Share Analysis, 2024
        • By Product
        • By Sample Type
        • By Technology
        • By End User
    • South Africa
      • Pricing Analysis
      • Market Share Analysis, 2024
        • By Product
        • By Sample Type
        • By Technology
        • By End User
  19. Market Structure Analysis
    • Competition Dashboard
    • Competition Benchmarking
    • Market Share Analysis of Top Players
      • By Regional
      • By Product
      • By Sample Type
      • By Technology
      • By End User
  20. Competition Analysis
    • Competition Deep Dive
      • DiaSys Diagnostic Systems GmbH
        • Overview
        • Product Portfolio
        • Profitability by Market Segments (Product/Age /Sales Channel/Region)
        • Sales Footprint
        • Strategy Overview
          • Marketing Strategy
          • Product Strategy
          • Channel Strategy
      • Creative Diagnostics
      • mti diagnostics
      • Biogenix Inc. Pvt. Ltd.
      • Reckon Diagnostics Pvt. Ltd.
      • Siemens Healthineers
      • F. Hoffmann-La Roche Ltd
      • Randox Laboratories Ltd.
      • Diazyme Laboratories, Inc.
      • FUJIFILM Wako Chemicals Europe GmbH
      • Erba Group
      • Eurolyser Diagnostica GmbH
  21. Assumptions & Acronyms Used
  22. Research Methodology

List of Tables

  • Table 1: Global Market Value (USD Million) Forecast by Region, 2020 to 2035
  • Table 2: Global Market Value (USD Million) Forecast by Product , 2020 to 2035
  • Table 3: Global Market Value (USD Million) Forecast by Sample Type, 2020 to 2035
  • Table 4: Global Market Value (USD Million) Forecast by Technology, 2020 to 2035
  • Table 5: Global Market Value (USD Million) Forecast by End User, 2020 to 2035
  • Table 6: North America Market Value (USD Million) Forecast by Country, 2020 to 2035
  • Table 7: North America Market Value (USD Million) Forecast by Product , 2020 to 2035
  • Table 8: North America Market Value (USD Million) Forecast by Sample Type, 2020 to 2035
  • Table 9: North America Market Value (USD Million) Forecast by Technology, 2020 to 2035
  • Table 10: North America Market Value (USD Million) Forecast by End User, 2020 to 2035
  • Table 11: Latin America Market Value (USD Million) Forecast by Country, 2020 to 2035
  • Table 12: Latin America Market Value (USD Million) Forecast by Product , 2020 to 2035
  • Table 13: Latin America Market Value (USD Million) Forecast by Sample Type, 2020 to 2035
  • Table 14: Latin America Market Value (USD Million) Forecast by Technology, 2020 to 2035
  • Table 15: Latin America Market Value (USD Million) Forecast by End User, 2020 to 2035
  • Table 16: Western Europe Market Value (USD Million) Forecast by Country, 2020 to 2035
  • Table 17: Western Europe Market Value (USD Million) Forecast by Product , 2020 to 2035
  • Table 18: Western Europe Market Value (USD Million) Forecast by Sample Type, 2020 to 2035
  • Table 19: Western Europe Market Value (USD Million) Forecast by Technology, 2020 to 2035
  • Table 20: Western Europe Market Value (USD Million) Forecast by End User, 2020 to 2035
  • Table 21: Eastern Europe Market Value (USD Million) Forecast by Country, 2020 to 2035
  • Table 22: Eastern Europe Market Value (USD Million) Forecast by Product , 2020 to 2035
  • Table 23: Eastern Europe Market Value (USD Million) Forecast by Sample Type, 2020 to 2035
  • Table 24: Eastern Europe Market Value (USD Million) Forecast by Technology, 2020 to 2035
  • Table 25: Eastern Europe Market Value (USD Million) Forecast by End User, 2020 to 2035
  • Table 26: East Asia Market Value (USD Million) Forecast by Country, 2020 to 2035
  • Table 27: East Asia Market Value (USD Million) Forecast by Product , 2020 to 2035
  • Table 28: East Asia Market Value (USD Million) Forecast by Sample Type, 2020 to 2035
  • Table 29: East Asia Market Value (USD Million) Forecast by Technology, 2020 to 2035
  • Table 30: East Asia Market Value (USD Million) Forecast by End User, 2020 to 2035
  • Table 31: South Asia and Pacific Market Value (USD Million) Forecast by Country, 2020 to 2035
  • Table 32: South Asia and Pacific Market Value (USD Million) Forecast by Product , 2020 to 2035
  • Table 33: South Asia and Pacific Market Value (USD Million) Forecast by Sample Type, 2020 to 2035
  • Table 34: South Asia and Pacific Market Value (USD Million) Forecast by Technology, 2020 to 2035
  • Table 35: South Asia and Pacific Market Value (USD Million) Forecast by End User, 2020 to 2035
  • Table 36: Middle East & Africa Market Value (USD Million) Forecast by Country, 2020 to 2035
  • Table 37: Middle East & Africa Market Value (USD Million) Forecast by Product , 2020 to 2035
  • Table 38: Middle East & Africa Market Value (USD Million) Forecast by Sample Type, 2020 to 2035
  • Table 39: Middle East & Africa Market Value (USD Million) Forecast by Technology, 2020 to 2035
  • Table 40: Middle East & Africa Market Value (USD Million) Forecast by End User, 2020 to 2035

List of Figures

  • Figure 1: Global Market Pricing Analysis
  • Figure 2: Global Market Value (USD Million) Forecast 2020 to 2035
  • Figure 3: Global Market Value Share and BPS Analysis by Product , 2025 and 2035
  • Figure 4: Global Market Y-o-Y Growth Comparison by Product , 2025 to 2035
  • Figure 5: Global Market Attractiveness Analysis by Product
  • Figure 6: Global Market Value Share and BPS Analysis by Sample Type, 2025 and 2035
  • Figure 7: Global Market Y-o-Y Growth Comparison by Sample Type, 2025 to 2035
  • Figure 8: Global Market Attractiveness Analysis by Sample Type
  • Figure 9: Global Market Value Share and BPS Analysis by Technology, 2025 and 2035
  • Figure 10: Global Market Y-o-Y Growth Comparison by Technology, 2025 to 2035
  • Figure 11: Global Market Attractiveness Analysis by Technology
  • Figure 12: Global Market Value Share and BPS Analysis by End User, 2025 and 2035
  • Figure 13: Global Market Y-o-Y Growth Comparison by End User, 2025 to 2035
  • Figure 14: Global Market Attractiveness Analysis by End User
  • Figure 15: Global Market Value (USD Million) Share and BPS Analysis by Region, 2025 and 2035
  • Figure 16: Global Market Y-o-Y Growth Comparison by Region, 2025 to 2035
  • Figure 17: Global Market Attractiveness Analysis by Region
  • Figure 18: North America Market Incremental Dollar Opportunity, 2025 to 2035
  • Figure 19: Latin America Market Incremental Dollar Opportunity, 2025 to 2035
  • Figure 20: Western Europe Market Incremental Dollar Opportunity, 2025 to 2035
  • Figure 21: Eastern Europe Market Incremental Dollar Opportunity, 2025 to 2035
  • Figure 22: East Asia Market Incremental Dollar Opportunity, 2025 to 2035
  • Figure 23: South Asia and Pacific Market Incremental Dollar Opportunity, 2025 to 2035
  • Figure 24: Middle East & Africa Market Incremental Dollar Opportunity, 2025 to 2035
  • Figure 25: North America Market Value Share and BPS Analysis by Country, 2025 and 2035
  • Figure 26: North America Market Value Share and BPS Analysis by Product , 2025 and 2035
  • Figure 27: North America Market Y-o-Y Growth Comparison by Product , 2025 to 2035
  • Figure 28: North America Market Attractiveness Analysis by Product
  • Figure 29: North America Market Value Share and BPS Analysis by Sample Type, 2025 and 2035
  • Figure 30: North America Market Y-o-Y Growth Comparison by Sample Type, 2025 to 2035
  • Figure 31: North America Market Attractiveness Analysis by Sample Type
  • Figure 32: North America Market Value Share and BPS Analysis by Technology, 2025 and 2035
  • Figure 33: North America Market Y-o-Y Growth Comparison by Technology, 2025 to 2035
  • Figure 34: North America Market Attractiveness Analysis by Technology
  • Figure 35: North America Market Value Share and BPS Analysis by End User, 2025 and 2035
  • Figure 36: North America Market Y-o-Y Growth Comparison by End User, 2025 to 2035
  • Figure 37: North America Market Attractiveness Analysis by End User
  • Figure 38: Latin America Market Value Share and BPS Analysis by Country, 2025 and 2035
  • Figure 39: Latin America Market Value Share and BPS Analysis by Product , 2025 and 2035
  • Figure 40: Latin America Market Y-o-Y Growth Comparison by Product , 2025 to 2035
  • Figure 41: Latin America Market Attractiveness Analysis by Product
  • Figure 42: Latin America Market Value Share and BPS Analysis by Sample Type, 2025 and 2035
  • Figure 43: Latin America Market Y-o-Y Growth Comparison by Sample Type, 2025 to 2035
  • Figure 44: Latin America Market Attractiveness Analysis by Sample Type
  • Figure 45: Latin America Market Value Share and BPS Analysis by Technology, 2025 and 2035
  • Figure 46: Latin America Market Y-o-Y Growth Comparison by Technology, 2025 to 2035
  • Figure 47: Latin America Market Attractiveness Analysis by Technology
  • Figure 48: Latin America Market Value Share and BPS Analysis by End User, 2025 and 2035
  • Figure 49: Latin America Market Y-o-Y Growth Comparison by End User, 2025 to 2035
  • Figure 50: Latin America Market Attractiveness Analysis by End User
  • Figure 51: Western Europe Market Value Share and BPS Analysis by Country, 2025 and 2035
  • Figure 52: Western Europe Market Value Share and BPS Analysis by Product , 2025 and 2035
  • Figure 53: Western Europe Market Y-o-Y Growth Comparison by Product , 2025 to 2035
  • Figure 54: Western Europe Market Attractiveness Analysis by Product
  • Figure 55: Western Europe Market Value Share and BPS Analysis by Sample Type, 2025 and 2035
  • Figure 56: Western Europe Market Y-o-Y Growth Comparison by Sample Type, 2025 to 2035
  • Figure 57: Western Europe Market Attractiveness Analysis by Sample Type
  • Figure 58: Western Europe Market Value Share and BPS Analysis by Technology, 2025 and 2035
  • Figure 59: Western Europe Market Y-o-Y Growth Comparison by Technology, 2025 to 2035
  • Figure 60: Western Europe Market Attractiveness Analysis by Technology
  • Figure 61: Western Europe Market Value Share and BPS Analysis by End User, 2025 and 2035
  • Figure 62: Western Europe Market Y-o-Y Growth Comparison by End User, 2025 to 2035
  • Figure 63: Western Europe Market Attractiveness Analysis by End User
  • Figure 64: Eastern Europe Market Value Share and BPS Analysis by Country, 2025 and 2035
  • Figure 65: Eastern Europe Market Value Share and BPS Analysis by Product , 2025 and 2035
  • Figure 66: Eastern Europe Market Y-o-Y Growth Comparison by Product , 2025 to 2035
  • Figure 67: Eastern Europe Market Attractiveness Analysis by Product
  • Figure 68: Eastern Europe Market Value Share and BPS Analysis by Sample Type, 2025 and 2035
  • Figure 69: Eastern Europe Market Y-o-Y Growth Comparison by Sample Type, 2025 to 2035
  • Figure 70: Eastern Europe Market Attractiveness Analysis by Sample Type
  • Figure 71: Eastern Europe Market Value Share and BPS Analysis by Technology, 2025 and 2035
  • Figure 72: Eastern Europe Market Y-o-Y Growth Comparison by Technology, 2025 to 2035
  • Figure 73: Eastern Europe Market Attractiveness Analysis by Technology
  • Figure 74: Eastern Europe Market Value Share and BPS Analysis by End User, 2025 and 2035
  • Figure 75: Eastern Europe Market Y-o-Y Growth Comparison by End User, 2025 to 2035
  • Figure 76: Eastern Europe Market Attractiveness Analysis by End User
  • Figure 77: East Asia Market Value Share and BPS Analysis by Country, 2025 and 2035
  • Figure 78: East Asia Market Value Share and BPS Analysis by Product , 2025 and 2035
  • Figure 79: East Asia Market Y-o-Y Growth Comparison by Product , 2025 to 2035
  • Figure 80: East Asia Market Attractiveness Analysis by Product
  • Figure 81: East Asia Market Value Share and BPS Analysis by Sample Type, 2025 and 2035
  • Figure 82: East Asia Market Y-o-Y Growth Comparison by Sample Type, 2025 to 2035
  • Figure 83: East Asia Market Attractiveness Analysis by Sample Type
  • Figure 84: East Asia Market Value Share and BPS Analysis by Technology, 2025 and 2035
  • Figure 85: East Asia Market Y-o-Y Growth Comparison by Technology, 2025 to 2035
  • Figure 86: East Asia Market Attractiveness Analysis by Technology
  • Figure 87: East Asia Market Value Share and BPS Analysis by End User, 2025 and 2035
  • Figure 88: East Asia Market Y-o-Y Growth Comparison by End User, 2025 to 2035
  • Figure 89: East Asia Market Attractiveness Analysis by End User
  • Figure 90: South Asia and Pacific Market Value Share and BPS Analysis by Country, 2025 and 2035
  • Figure 91: South Asia and Pacific Market Value Share and BPS Analysis by Product , 2025 and 2035
  • Figure 92: South Asia and Pacific Market Y-o-Y Growth Comparison by Product , 2025 to 2035
  • Figure 93: South Asia and Pacific Market Attractiveness Analysis by Product
  • Figure 94: South Asia and Pacific Market Value Share and BPS Analysis by Sample Type, 2025 and 2035
  • Figure 95: South Asia and Pacific Market Y-o-Y Growth Comparison by Sample Type, 2025 to 2035
  • Figure 96: South Asia and Pacific Market Attractiveness Analysis by Sample Type
  • Figure 97: South Asia and Pacific Market Value Share and BPS Analysis by Technology, 2025 and 2035
  • Figure 98: South Asia and Pacific Market Y-o-Y Growth Comparison by Technology, 2025 to 2035
  • Figure 99: South Asia and Pacific Market Attractiveness Analysis by Technology
  • Figure 100: South Asia and Pacific Market Value Share and BPS Analysis by End User, 2025 and 2035
  • Figure 101: South Asia and Pacific Market Y-o-Y Growth Comparison by End User, 2025 to 2035
  • Figure 102: South Asia and Pacific Market Attractiveness Analysis by End User
  • Figure 103: Middle East & Africa Market Value Share and BPS Analysis by Country, 2025 and 2035
  • Figure 104: Middle East & Africa Market Value Share and BPS Analysis by Product , 2025 and 2035
  • Figure 105: Middle East & Africa Market Y-o-Y Growth Comparison by Product , 2025 to 2035
  • Figure 106: Middle East & Africa Market Attractiveness Analysis by Product
  • Figure 107: Middle East & Africa Market Value Share and BPS Analysis by Sample Type, 2025 and 2035
  • Figure 108: Middle East & Africa Market Y-o-Y Growth Comparison by Sample Type, 2025 to 2035
  • Figure 109: Middle East & Africa Market Attractiveness Analysis by Sample Type
  • Figure 110: Middle East & Africa Market Value Share and BPS Analysis by Technology, 2025 and 2035
  • Figure 111: Middle East & Africa Market Y-o-Y Growth Comparison by Technology, 2025 to 2035
  • Figure 112: Middle East & Africa Market Attractiveness Analysis by Technology
  • Figure 113: Middle East & Africa Market Value Share and BPS Analysis by End User, 2025 and 2035
  • Figure 114: Middle East & Africa Market Y-o-Y Growth Comparison by End User, 2025 to 2035
  • Figure 115: Middle East & Africa Market Attractiveness Analysis by End User
  • Figure 116: Global Market – Tier Structure Analysis
  • Figure 117: Global Market – Company Share Analysis
Dashboard
Dashboard
Dashboard
Dashboard
Dashboard
Dashboard

Full Research Suite comprises of:

Market outlook & trends analysis

Market outlook & trends analysis

Interviews & case studies

Interviews & case studies

Strategic recommendations

Strategic recommendations

Vendor profiles & capabilities analysis

Vendor profiles & capabilities analysis

5-year forecasts

5-year forecasts

8 regions and 60+ country-level data splits

8 regions and 60+ country-level data splits

Market segment data splits

Market segment data splits

12 months of continuous data updates

12 months of continuous data updates

DELIVERED AS:

PDF EXCEL ONLINE

Full Research Suite


$5000

$7500

$10000

Buy Report Now
Similar Industry Reports

Similar Industry Reports

Hip Kits Market
Hip Kits Market

Hip Kits Market Size and Share Forecast Outlook 2025 to 2035

Oiler Kits Market
Oiler Kits Market

Oiler Kits Market Size and Share Forecast Outlook 2025 to 2035

Audio Kits Market
Audio Kits Market

Audio Kits Market

RT-PCR Kits Market
RT-PCR Kits Market

RT-PCR Kits Market Growth - Trends & Forecast 2023 to 2035

Lavage Kits Market
Lavage Kits Market

Lavage Kits Market

Organoids Kits Market

Organoids Kits Market

Connector Kits Market

Connector Kits Market

Capacitor Kits Market

Capacitor Kits Market

Extraction Kits Market

Extraction Kits Market Analysis - Size, Share, and Forecast Outlook 2025 to 2035

DIY Haircut Kits Market

DIY Haircut Kits Market - Trends, Growth & Forecast 2025 to 2035

EMI, Filter Kits Market

EMI, Filter Kits Market

Nephelometry Kits Market

Nephelometry Kits Market Size and Share Forecast Outlook 2025 to 2035

Chilled Meal Kits Market

Analysis and Growth Projections for Chilled Meal Kits Market

1-Step RT-PCR Kits Market

1-Step RT-PCR Kits Market Size and Share Forecast Outlook 2025 to 2035

Demining Tool Kits Market

Demining Tool Kits Market Size and Share Forecast Outlook 2025 to 2035

Antibody Pair Kits Market

Antibody Pair Kits Market

Skin Traction Kits Market

Skin Traction Kits Market

Flu Protection Kits Market

Flu Protection Kits Market Size and Share Forecast Outlook 2025 to 2035

Guided Surgery Kits Market

Guided Surgery Kits Market Size, Growth, and Forecast for 2025 to 2035

Fungal Testing Kits Market

Fungal Testing Kits Market Analysis – Size, Trends & Forecast 2025 to 2035

Future Market Insights

Immunoturbidimetric Kits Market

Chat With MaRIA

Chat With

MaRIA

Hi There, I am MaRIA, Your Market Research Intelligence Assistant. How may I help you?