Guided Surgery Kits Market Size and Share Forecast Outlook 2025 to 2035

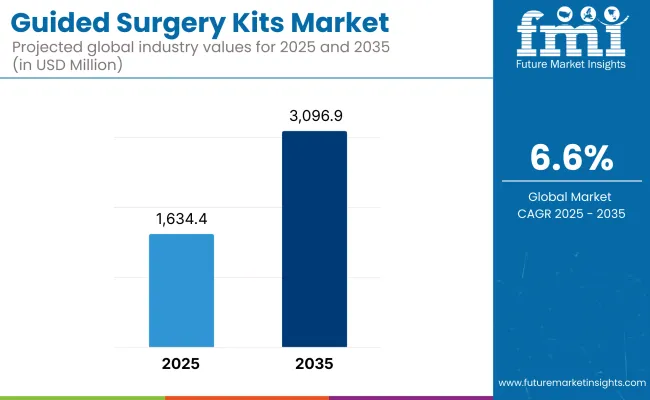
The global Guided Surgery Kits Market is projected to reach a valuation of USD 1,634.4 million by 2025 and USD 3,096.9 million by 2035. This indicates a decade-long increase of USD 1,462.5 million between 2025 and 2035. The market is expected to expand at a compound annual growth rate (CAGR) of 6.6%, representing a 1.90X increase over the ten-year period.
Quick Stats for Global Guided Surgery Kits Market

  • Industry Value (2025): USD 1,634.4 million
  • Forecast Value (2035): USD 3,096.9 million
  • Forecast CAGR: 6.6%
  • Leading Segment in 2025 (Product): Fully Guided Surgery Kits (35.4% market share)
  • Key Growth Region: Asia Pacific and North America
  • Top Key Players: Eko Health, Inc., Lapsi Health, Ai Health Highway India Pvt Ltd., Ayu Devices Pvt Ltd., Steth IO, M3DICINE Pty Ltd., AMD Global Telemedicine, Rudolf Riester GmbH, Minttihealth, NabzHooshmand Co., StethoMe sp. z o.o.

Guided Surgery Kits Market

Attributes Description
Estimated Market Size (2025E) USD 1,634.4 million
Projected Market Value (2035F) USD 3,096.9 million
Value-based CAGR (2025 to 2035) 6.6%

During the first five-year period from 2025 to 2030, the total market value is projected to expand from USD 1,634.4 million to USD 2,249.8 million, adding USD 615.4 million, which contributes to 42.1% of the total decade growth. The Fully Guided Surgery Kits segment will remain dominant, holding around 36.2% share of the category by 2030 due to dental clinics’ continued prioritization of precision implant placement and workflow efficiency,while Universal Guided Kits will maintain a moderate share at just above 12%.

The second half from 2030 to 2035 contributes USD 847.1 million, equal to 57.9% of the total growth, as the market advances from USD 2,249.8 million to USD 3,096.9 million. This acceleration is powered by the widespread adoption of guided surgery systems in both specialized dental service organizations and large multi-chair clinics.

Fully Guided Surgery Kits and System-Specific Kits together are expected to capture a large share exceeding 61% by the end of the decade. Pilot Drill Guided Kits are likely to maintain above 23% share, supported by cost-effective adoption in emerging markets.

From 2020 to 2024, the overall Guided Surgery Kits Market grew from USD 1,193.9 million to USD 1,551.0 million. Leading manufacturers such as Eko Health, Inc., Lapsi Health, Ai Health Highway India Pvt Ltd, and other innovators collectively account for a significant share of global revenue through procedure-specific kit solutions and digital integration with surgical navigation systems.

Key strategies deployed by these players include advancements in kit modularity, integration with guided surgery software platforms, and partnerships with dental clinics and service organizations to standardize precision implant workflows.

In 2025, the Guided Surgery Kits Market is expected to reach a value of approximately USD 1,634.4 million, driven by the shift from conventional implant placement methods to fully guided, system-specific surgical kits. Growth will be propelled by dental service providers’ investments in clinical precision, reduced surgical chair time, and improved patient outcomes.

End users particularly dental clinics are increasingly adopting kits with digitally pre-planned drilling protocols, single-use sterile components, and compatibility with intraoral scanning workflows, supporting both immediate and full-arch rehabilitation procedures. This trend aligns with the rising demand for minimally invasive and highly accurate dental implant placements across developed and emerging markets.

Analyzing Guided Surgery Kits Market by Top Investment Segments

The market is segmented by product type, application, end-user, and region. Product type includes Fully Guided Surgery Kits, Pilot Drill Guided Kits, Universal Guided Kits, System-Specific Kits, and Others, representing the core solutions driving procedural precision and adoption across dental practices. Application classification covers Single Implant Placement, Full-Arch Rehabilitation, Immediate Implant Placement, and Others, reflecting the range of surgical scenarios supported by guided kit technologies.

Based on end user, the segmentation includes Dental Clinics, Dental Service Organizations, Hospitals, and Academic & Research Institutes, each with distinct procurement drivers and procedural requirements. Regionally, the scope spans North America, Latin America, Western and Eastern Europe, East Asia, South Asia and Pacific, and the Middle East and Africa, with market growth influenced by variations in dental infrastructure, implant adoption rates, and regulatory landscapes.
Insights into the Product Segment with Fully Guided Surgery Kits Leading in Market Share

Guided Surgery Kits Market By Product

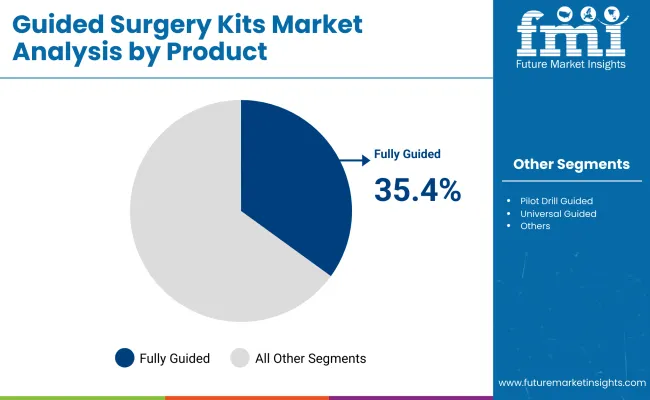
Fully Guided Surgery Kits are expected to retain a dominant position, contributing 35.4% to the market in 2025, owing to their ability to deliver highly accurate, pre-planned implant placement with minimal surgical deviation. Their adoption has been driven by the global shift toward precision dentistry and the growing integration of digital treatment planning software with guided surgery workflows.

These kits are increasingly preferred due to their capacity to reduce chair time, enhance surgical predictability, and improve patient recovery outcomes. Dental clinics and service organizations are investing in fully guided systems to standardize procedures, particularly for complex full-arch and immediate implant cases.

Industry adoption has also been supported by advancements in kit compatibility with CAD/CAM workflows, intraoral scanners, and 3D-printed surgical guides. Collectively, these factors have solidified the position of fully guided models over partial or pilot drill-only kits in high-volume, technology-driven dental practices worldwide.

Product Market Share (%)
Fully Guided Surgery Kits 35.4%
Pilot Drill Guided Kits 22.4%
Universal Guided Kits 12.4%
System-Specific Kits 24.3%
Others 5.5%

Insights into the Application Segment with Single Implant Placement Dominating the Demand

Guided Surgery Kits Market By Application

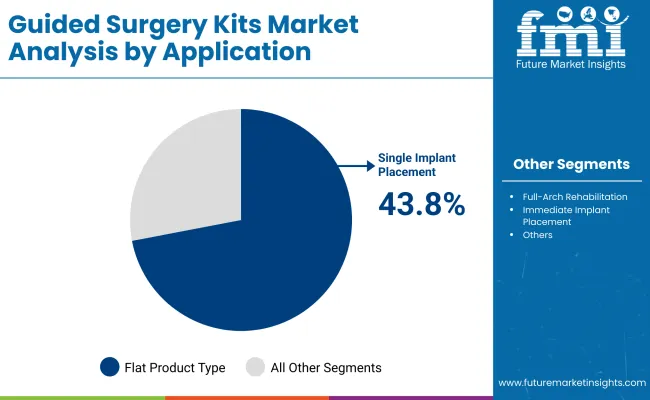
Single Implant Placement has emerged as the leading application area, projected to hold around 43.8% of the market in 2025, driven by the growing global demand for tooth replacement solutions that are minimally invasive and cost-effective. The increasing adoption of guided surgery in single implant cases stems from its ability to provide enhanced surgical accuracy, reduced chair time, and improved patient satisfaction.

Dental clinics are leveraging digital workflows from intraoral scanning to 3D-printed surgical guides to optimize single implant placement outcomes. Rising awareness among patients about the benefits of precise implant positioning, coupled with the expansion of dental implant insurance coverage in several regions, is further fueling demand.

Additionally, the growing elderly population and rising incidence of tooth loss are sustaining high procedural volumes, cementing the dominance of single implant placement over more complex, multi-unit rehabilitation cases in both developed and emerging markets.

Application Market Share (%)
Single Implant Placement 43.8%
Full-Arch Rehabilitation 27.8%
Immediate Implant Placement 20.0%
Others 8.4%

Insights into the End User Segment with Highest Adoption Among Dental Clinics

Dental Clinics are expected to remain the largest end user segment, contributing around 51.9% of the market in 2025, driven by their critical role in delivering routine and specialized implant procedures. The majority of single and multiple implant placements are performed in clinic settings, where efficiency, accuracy, and patient turnover are key operational priorities.

The adoption of guided surgery kits in dental clinics is reinforced by the growing integration of digital planning tools, chairside 3D printing for surgical guides, and minimally invasive workflows. Investments in clinic modernization particularly in high-volume practices are enabling the deployment of advanced, fully guided and system-specific kits to enhance procedural predictability.

Additionally, favorable patient financing options and expanding dental tourism markets are supporting higher procedural volumes, cementing the position of dental clinics as the primary growth engine for guided surgery kit adoption globally.

End User Market Share (%)
Dental Clinics 51.9%
Dental Service Organizations 24.6%
Hospitals 18.7%
Academic & Research Institutes 4.8%

Why Is This Market Growing?

The Guided Surgery Kits Market is experiencing strong growth as dental and oral surgery providers worldwide face increasing demand for precision implant placement, faster procedural workflows, and improved patient outcomes. Major growth drivers include the rising global incidence of tooth loss, expanding adoption of dental implants, and the integration of digital treatment planning with surgical execution.

Advancements such as fully guided, system-specific kits compatible with intraoral scanning and CAD/CAM workflows reduce surgical chair time, minimize procedural errors, and enhance postoperative recovery. The shift toward minimally invasive implant procedures and growing acceptance of immediate placement protocols are further accelerating uptake.

The pandemic heightened the importance of patient throughput and treatment predictability, driving clinics and dental service organizations to standardize guided surgery workflows. In regions with rapidly expanding dental infrastructure particularly in North America, Europe, and parts of Asia Pacific new clinics and technology upgrades are fueling demand for advanced guided surgery kits that combine accuracy, safety, and clinical efficiency.

What are the Drivers, Restraints, and Key Trends of the Global Guided Surgery Kits Market?

Digital Integration Driving Precision Implant Procedures

The most significant growth driver in the Guided Surgery Kits Market is the rapid integration of digital treatment planning and surgical execution workflows. Advances in intraoral scanning, CAD/CAM technology, and 3D printing enable clinicians to pre-plan implant positions with high accuracy and transfer these plans directly into fully guided or system-specific surgical kits.

Dental clinics and service organizations are increasingly compelled to adopt these kits to reduce surgical chair time, minimize errors, and improve long-term implant stability. Accreditation bodies and implant manufacturers are also promoting standardized guided protocols, reinforcing adoption. As global dental implant case volumes increase, the need for reproducible, precision-driven workflows is strengthening procurement of advanced guided surgery kits.

High System Cost and Technology Adoption Barriers

Despite the clinical benefits, the high cost of fully guided surgery systems-particularly those requiring proprietary surgical kit formats, compatible implant systems, and advanced imaging-remains a significant barrier in cost-sensitive markets.

Smaller dental clinics, especially in developing regions, often delay upgrades due to the combined expense of digital planning software, CBCT imaging, and surgical kit replenishment. Infrastructure readiness, including access to digital impression equipment and trained surgical teams, adds to adoption challenges. For many practices, retrofitting existing workflows to accommodate guided protocols requires operational adjustments and additional staff training.

Convergence of Guided Surgery Kits with Comprehensive Digital Dentistry Solutions

A rapidly emerging trend is the integration of guided surgery kits into end-to-end digital dentistry ecosystems. Rather than purchasing kits as standalone procedural tools, large dental networks and advanced clinics are incorporating them into comprehensive solutions that include intraoral scanners, CBCT imaging, CAD/CAM design, and in-house 3D printing. Leading implant manufacturers are aligning kit designs with proprietary implant lines, software platforms, and training modules to drive brand loyalty and procedural consistency.

This convergence is shifting procurement decisions toward platform compatibility and clinical workflow integration rather than kit cost alone. As new dental facilities are established and existing practices undergo technology upgrades, guided surgery kits are increasingly co-specified alongside diagnostic, planning, and manufacturing technologies, positioning them as core components of a fully digital, patient-centric implant treatment pathway.
Analysis of Global Guided Surgery Kits Market by Key Countries

Guided Surgery Kits Market Country Wise Analysis

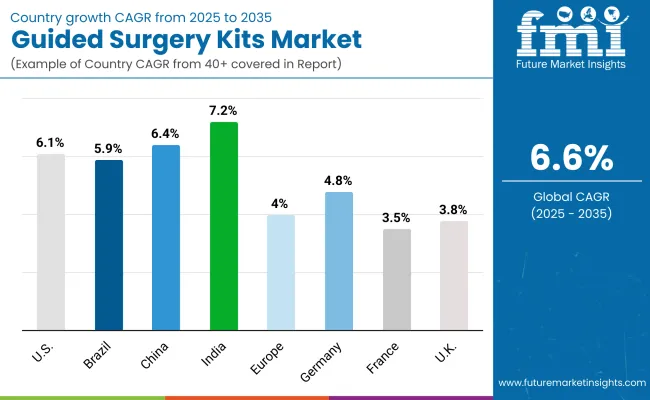
Country CAGR
USA 6.1%
Brazil 5.9%
China 6.4%
India 7.2 %
Europe 4.0%
Germany 4.8%
France 3.5%
UK 3.8%

Asia Pacific is emerging as the fastest-growing region in the Guided Surgery Kits Market, projected to grow at a 6.2% CAGR between 2025 and 2030. Among its key markets, India is forecast to expand at a 6.0% CAGR, driven by the rapid expansion of advanced dental care facilities, growing adoption of dental implants, and increasing training in guided surgery protocols among clinicians.

China is projected to grow at a 6.4% CAGR, supported by substantial investments in digital dentistry infrastructure, rising procedural volumes, and public-private partnerships for technology adoption in oral healthcare. The region’s growth is also fueled by expanding dental tourism hubs, particularly in Southeast Asia, and the integration of digital workflows with guided implant systems in newly built clinics.

Europe is expected to grow steadily at a 5.4% CAGR through 2035. Germany is projected to grow at 4.8% CAGR, benefiting from the integration of guided surgery kits into established implantology practices and the expansion of digital dentistry training programs. France is estimated to grow at 3.5% CAGR, driven by gradual adoption in both private clinics and public dental care facilities.

The UK will see growth of 3.8% CAGR, with market expansion linked to NHS-backed modernization projects aimed at improving access to advanced implant procedures. The European market is supported by harmonized regulatory frameworks, increasing demand for minimally invasive dental solutions, and continuous professional education in guided implantology.

North America remains a mature but innovation-led market, with the USA projected to grow at a 6.1% CAGR between 2025 to 2035. Growth in the USA is driven by the replacement of conventional implant placement workflows with digitally integrated guided systems in both private practices and dental service organizations.

Increasing case volumes in full-arch rehabilitation and immediate implant placement, combined with rising patient expectations for accuracy and faster recovery, are accelerating adoption. Furthermore, dental networks are investing in standardized guided protocols to ensure clinical consistency across multiple locations, while advances in kit modularity and compatibility are making adoption more attractive for large-scale operators.

Sales Outlook for Guided Surgery Kits in the United States

Year USA Berberine Market (USD Million)
2025 509.2
2026 539.2
2027 571.3
2028 605.8
2029 642.6
2030 681.9
2031 723.4
2032 767.9
2033 815.8
2034 866.7
2035 920.5

The Guided Surgery Kits Market in the USA is forecasted to grow at a 6.1% CAGR, primarily driven by the rapid shift from freehand implant placement to digitally integrated guided workflows. Dental clinics and large dental service organizations (DSOs) are replacing conventional surgical protocols with fully guided and system-specific kits that ensure high precision, reduced chair time, and predictable outcomes. Adoption is further accelerated by the integration of CAD/CAM workflows, intraoral scanning, and 3D-printed surgical guides.

  • Dental clinics are standardizing guided protocols to improve efficiency across high-volume implant practices.
  • DSOs are investing in proprietary kit systems compatible with preferred implant brands to streamline procurement and training.
  • Hospitals with dental surgery units are incorporating guided kits for complex full-arch and immediate placement cases to improve patient recovery and procedural success rates.

Growth and Expansion Outlook for Guided Surgery Kits Market in the United Kingdom

The Guided Surgery Kits Market in the United Kingdom is projected to grow at a 3.8% CAGR through 2035, supported by NHS modernization projects aimed at expanding access to advanced dental treatments. Private dental groups are also investing in digital dentistry ecosystems, integrating CBCT imaging, treatment planning software, and guided kits into a unified workflow. This trend is further reinforced by the rising number of trained implantologists and increased patient demand for minimally invasive solutions.

  • NHS dental units are incorporating guided kits in teaching hospitals to train future implant specialists.
  • Private clinics are focusing on full-arch rehabilitation cases to differentiate services and attract dental tourism patients.
  • Dental equipment suppliers are promoting guided kits with bundled imaging and scanning equipment to encourage comprehensive adoption.

In-depth Analysis of Guided Surgery Kits Market in Germany

The Guided Surgery Kits Market in Germany is forecast to grow at a 4.8% CAGR, driven by the country’s strong implant dentistry infrastructure and widespread clinician training programs. Germany’s high procedural volumes and focus on precision-based treatment are accelerating the transition from freehand techniques to guided approaches. Furthermore, professional associations and implant manufacturers are actively promoting workshops and digital workflow adoption.

  • University dental hospitals are integrating guided kits into research and postgraduate training programs to advance surgical accuracy.
  • Large private chains are standardizing kit usage across multiple clinics to ensure uniform treatment quality.
  • Dental technology integrators are bundling guided kits with imaging software and chairside 3D printing solutions to streamline the implant process.

Europe Guided Surgery Kits Market Value Analysis by Country

Europe Country 2025
Germany 26.8%
UK 17.2%
France 14.4%
Italy 11.5%
Spain 8.6%
BENELUX 9.6%
Nordic Countries 7.7%
Rest of Western Europe 4.2%
Europe Country 2035
Germany 25.8%
UK 18.4%
France 15.3%
Italy 12.3%
Spain 8.1%
BENELUX 9.0%
Nordic Countries 7.2%
Rest of Western Europe 3.8%

Market Expansion Outlook for Guided Surgery Kits Market in India

The Guided Surgery Kits Market in India is expected to grow at a 7.2% CAGR, positioning it among the faster-growing markets globally. Growth is supported by the rapid expansion of advanced dental care facilities, increased adoption of dental implants, and a surge in digital dentistry training programs.

Rising patient awareness, along with NABH accreditation standards for dental clinics, has driven the integration of guided surgical protocols in both urban and Tier 2 city practices. Indian dental service groups are increasingly deploying fully guided and system-specific kits to improve procedural precision and reduce chair time. Additionally, local distributors and global manufacturers are offering cost-effective, customizable kits compatible with domestic implant brands to suit regional budgets and preferences.

  • Private multi-chair dental clinics are standardizing guided kits for high-volume implant placement workflows.
  • Dental teaching institutions are incorporating guided surgery modules into postgraduate curricula to upskill implant specialists.
  • Chain clinics in Tier 2 cities are adopting modular guided kits to scale implant services within compact operatory layouts.

Sales Outlook for Guided Surgery Kits Market in China

The Guided Surgery Kits Market in China is projected to grow at a 6.4% CAGR through 2035, driven by substantial investment in digital dentistry infrastructure under the “Healthy China 2030” initiative. The National Health Commission’s focus on precision-driven oral health services is accelerating adoption of guided surgery kits in top-tier hospitals and large private clinics.

Urban dental centers are shifting toward fully integrated digital workflows, combining CBCT imaging, CAD/CAM design, and surgical guides. Domestic manufacturers are scaling kit production while enhancing product compatibility with locally preferred implant systems, ensuring affordability and faster market penetration.

  • Tier 1 city dental hospitals are integrating guided kits with digital planning platforms for complex full-arch rehabilitations.
  • Regional dental chains are adopting pilot drill guided kits as a cost-effective upgrade path for gradual digital integration.
  • Joint-venture clinics are importing premium guided kits from Europe and the USA to align with international quality benchmarks.

Growth Outlook of Guided Surgery Kits Market in Japan

The Guided Surgery Kits Market in Japan is projected to reach USD 63.7 million in 2025, with Fully Guided Surgery Kits accounting for 36.1% of product use, reflecting Japan’s preference for precision and predictable clinical outcomes. Adoption is supported by the country’s high standards in dental technology integration and compliance with Japan Prosthodontic Society implant protocols.

The Ministry of Health, Labour and Welfare’s emphasis on digital workflow implementation in dental care is a major driver, alongside an aging population increasing implant demand. Local suppliers are also developing Japan-specific guided kits optimized for compact clinic layouts and ergonomic handling.

  • Japan’s market share accounts for 3.9% of the global market in 2025.
  • Fully Guided Surgery Kits dominate due to high acceptance in premium implant clinics.
  • Growth is driven by advanced clinician training programs and the integration of CAD/CAM and 3D printing technologies.

Opportunity Analysis of South Korea in Guided Surgery Kits Market

The Guided Surgery Kits Market in South Korea is estimated at USD 45.8 million in 2025, with Single Implant Placement representing the largest application share at 46.1%. This dominance is due to a high frequency of single-tooth restorations and the country’s early adoption of digital dental workflows.

Government-backed healthcare modernization initiatives and the Korean Dental Association’s promotion of guided protocols are accelerating the market shift from freehand surgery to precision-based techniques. Hospitals and dental groups are also integrating guided kits with in-house CBCT imaging and 3D printing facilities to offer same-day implant solutions.
  • Market size for South Korea in 2025 is USD 45.8 million.
  • South Korea holds 2.8% of the Global Market.
  • Single Implant Placement leads at 46.1% due to its clinical efficiency and patient demand for minimally invasive procedures.

Competition Landscape

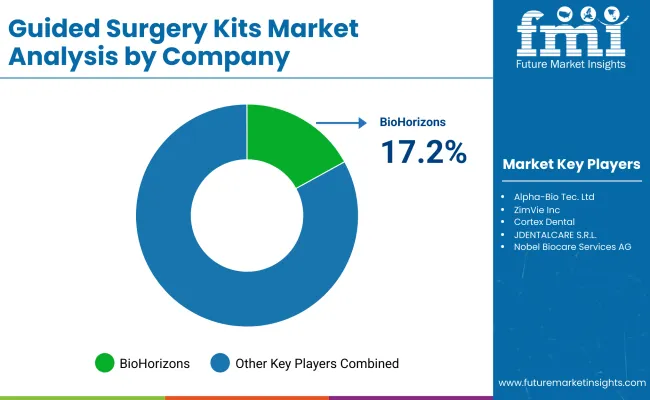
Guided Surgery Kits Market By Company

The Global Guided Surgery Kits Market is moderately competitive, with a mix of global leaders, established regional manufacturers, and emerging innovators competing across implant dentistry and oral surgery applications. Industry leaders such as BioHorizons, ZimVie Inc., Cortex Dental and Nobel Biocare Services AG hold notable market share, driven by their integration of guided kits with advanced digital dentistry platforms.

These companies are expanding their reach through strategic partnerships with dental service organizations (DSOs) and implant manufacturers, offering bundled solutions that combine guided kits with CAD/CAM treatment planning software, intraoral scanners, and 3D printing capabilities. Their strategies increasingly focus on surgical accuracy, procedural efficiency, and compatibility with multiple implant systems to maximize adoption across global clinic networks.

Established mid-sized players like Alpha-Bio Tec. Ltd, Ritter Implants and Osstem Implant cater to high-growth regional markets, offering scalable guided kit configurations tailored to the needs of multi-chair dental clinics and teaching institutions. These companies are innovating with modular kit designs, cross-brand implant compatibility, and ergonomic surgical workflows, making them attractive to practices undergoing phased digital upgrades.

Emerging participants such as ALLIANCE GLOBAL TECHNOLOGY LTD., Sweden & Martina S.p.A, Alpha-Bio Tec. Ltd and others focus on niche opportunities, including portable guided solutions, integration with teledentistry platforms, and rapid-deployment kits for mobile dental units. Their competitive edge lies in product customization, cost-effective pricing, and value-added services such as clinician training, workflow optimization, and software-assisted case planning.

As the market evolves, competitive differentiation is shifting from basic physical guide design toward fully integrated digital ecosystems leveraging AI-based treatment planning, IoT-enabled surgical tracking, and seamless interoperability with imaging, design, and manufacturing technologies in the modern dental clinic.

Top Player 2024 Share
BioHorizons 17.2%
Others 82.8%

Key Developments:

  • In 2025, At AEEDC Dubai 2025, Osstem Implant unveiled its fourth-generation SOI (Super Osseointegration) surface technology, reducing bone fusion time by over 35% compared to SA surfaces. The TS SOI implant offers superior protein attachment and blood clot formation, marking a breakthrough in dental implantology.
  • In 2024,Adin's guided surgery system, featured in the British Dental Journal, introduces a keyless procedure for implant placement, enhancing speed and precision. With ActiveFlow™ Irrigation Technology and self-centring drills, it ensures optimal cooling, accurate depth control, and reduced surgical complications-streamlining implantology for clinicians and patients alike.

Scope of the Report

Item Value
Market Value (2025) USD 1634.4 million
Product type Fully Guided Surgery Kits, Pilot Drill Guided Kits, Universal Guided Kits, System-Specific Kits, and Others
Application Single Implant Placement, Full-Arch Rehabilitation, Immediate Implant Placement, and Others,
End User Dental Clinics, Dental Service Organizations, Hospitals, and Academic & Research Institutes
Regions Covered North America, Latin America, Western & Eastern Europe, East Asia, South Asia & Pacific, Middle East & Africa
Countries Covered USA, Brazil, China, India, Europe, Germany, France, UK
Key Companies Profiled BioHorizons Alpha-Bio Tec. Ltd, ZimVie Inc., Cortex Dental, JDENTALCARE S.R.L. , Nobel Biocare Services AG, Ritter Implants, Osstem Implant, ALLIANCE GLOBAL TECHNOLOGY LTD., Sweden & Martina S.p.A, AB Dental Devices Ltd, B&B Dental Implant Company, Adin Dental Implant Systems Ltd. and Others
Additional Attributes Dollar sales by application and regions, adoption trends of digitally integrated Guided Surgery Kits, rising demand in complex full-arch rehabilitation and immediate implant placement, growing demand across dental clinics, DSOs, and hospital-based oral surgery units, increasing integration with CAD/CAM, CBCT imaging, and 3D printing for precision implant workflows.

Key Segments

By Product:

  • Fully Guided Surgery Kits
  • Pilot Drill Guided Kits
  • Universal Guided Kits
  • System-Specific Kits
  • Others

By Application:

  • Single Implant Placement
  • Full-Arch Rehabilitation
  • Immediate Implant Placement
  • Others

By End User:

  • Dental Clinics
  • Dental Service Organizations
  • Hospitals
  • Academic & Research Institutes

By Region:

  • North America
  • Latin America
  • East Asia
  • South Asia & Pacific
  • Western Europe
  • Eastern Europe
  • Middle East & Africa

Table of Content

  1. Executive Summary
    • Global Market Outlook
    • Demand-side Trends
    • Supply-side Trends
    • Technology Roadmap Analysis
    • Analysis and Recommendations
  2. Market Overview
    • Market Coverage / Taxonomy
    • Market Definition / Scope / Limitations
  3. Market Background
    • Market Dynamics
      • Drivers
      • Restraints
      • Opportunity
      • Trends
    • Scenario Forecast
      • Demand in Optimistic Scenario
      • Demand in Likely Scenario
      • Demand in Conservative Scenario
    • Opportunity Map Analysis
    • Product Life Cycle Analysis
    • Supply Chain Analysis
      • Supply Side Participants and their Roles
        • Producers
        • Mid-Level Participants (Traders/ Agents/ Brokers)
        • Wholesalers and Distributors
      • Value Added and Value Created at Node in the Supply Chain
      • List of Raw Material Suppliers
      • List of Existing and Potential Buyer’s
    • Investment Feasibility Matrix
    • Value Chain Analysis
      • Profit Margin Analysis
      • Wholesalers and Distributors
      • Retailers
    • PESTLE and Porter’s Analysis
    • Regulatory Landscape
      • By Key Regions
      • By Key Countries
    • Regional Parent Market Outlook
    • Production and Consumption Statistics
    • Import and Export Statistics
  4. Global Market Analysis 2020 to 2024 and Forecast, 2025 to 2035
    • Historical Market Size Value (USD Million) & Volume (Units) Analysis, 2020 to 2024
    • Current and Future Market Size Value (USD Million) & Volume (Units) Projections, 2025 to 2035
      • Y-o-Y Growth Trend Analysis
      • Absolute $ Opportunity Analysis
  5. Global Market Analysis 2020 to 2024 and Forecast 2025 to 2035, By Product
    • Introduction / Key Findings
    • Historical Market Size Value (USD Million) & Volume (Units) Analysis By Product, 2020 to 2024
    • Current and Future Market Size Value (USD Million) & Volume (Units) Analysis and Forecast By Product, 2025 to 2035
      • Fully Guided Surgery Kits
      • Pilot Drill Guided Kits
      • Universal Guided Kits
      • System-Specific Kits
      • Others
    • Y-o-Y Growth Trend Analysis By Product, 2020 to 2024
    • Absolute $ Opportunity Analysis By Product, 2025 to 2035
  6. Global Market Analysis 2020 to 2024 and Forecast 2025 to 2035, By Application
    • Introduction / Key Findings
    • Historical Market Size Value (USD Million) & Volume (Units) Analysis By Application, 2020 to 2024
    • Current and Future Market Size Value (USD Million) & Volume (Units) Analysis and Forecast By Application, 2025 to 2035
      • Single Implant Placement
      • Full-Arch Rehabilitation
      • Immediate Implant Placement
      • Others
    • Y-o-Y Growth Trend Analysis By Application, 2020 to 2024
    • Absolute $ Opportunity Analysis By Application, 2025 to 2035
  7. Global Market Analysis 2020 to 2024 and Forecast 2025 to 2035, By End User
    • Introduction / Key Findings
    • Historical Market Size Value (USD Million) & Volume (Units) Analysis By End User, 2020 to 2024
    • Current and Future Market Size Value (USD Million) & Volume (Units) Analysis and Forecast By End User, 2025 to 2035
      • Dental Clinics
      • Dental Service Organizations
      • Hospitals
      • Academic & Research Institutes
    • Y-o-Y Growth Trend Analysis By End User, 2020 to 2024
    • Absolute $ Opportunity Analysis By End User, 2025 to 2035
  8. Global Market Analysis 2020 to 2024 and Forecast 2025 to 2035, By Region
    • Introduction
    • Historical Market Size Value (USD Million) & Volume (Units) Analysis By Region, 2020 to 2024
    • Current Market Size Value (USD Million) & Volume (Units) Analysis and Forecast By Region, 2025 to 2035
      • North America
      • Latin America
      • East Asia
      • South Asia & Pacific
      • Western Europe
      • Eastern Europe
      • Middle East & Africa
    • Market Attractiveness Analysis By Region
  9. North America Market Analysis 2020 to 2024 and Forecast 2025 to 2035, By Country
    • Historical Market Size Value (USD Million) & Volume (Units) Trend Analysis By Market Taxonomy, 2020 to 2024
    • Market Size Value (USD Million) & Volume (Units) Forecast By Market Taxonomy, 2025 to 2035
      • By Country
        • USA
        • Canada
        • Mexico
      • By Product
      • By Application
      • By End User
    • Market Attractiveness Analysis
      • By Country
      • By Product
      • By Application
      • By End User
    • Key Takeaways
  10. Latin America Market Analysis 2020 to 2024 and Forecast 2025 to 2035, By Country
    • Historical Market Size Value (USD Million) & Volume (Units) Trend Analysis By Market Taxonomy, 2020 to 2024
    • Market Size Value (USD Million) & Volume (Units) Forecast By Market Taxonomy, 2025 to 2035
      • By Country
        • Brazil
        • Argentina
        • Rest of Latin America
      • By Product
      • By Application
      • By End User
    • Market Attractiveness Analysis
      • By Country
      • By Product
      • By Application
      • By End User
    • Key Takeaways
  11. East Asia Market Analysis 2020 to 2024 and Forecast 2025 to 2035, By Country
    • Historical Market Size Value (USD Million) & Volume (Units) Trend Analysis By Market Taxonomy, 2020 to 2024
    • Market Size Value (USD Million) & Volume (Units) Forecast By Market Taxonomy, 2025 to 2035
      • By Country
        • China
        • Japan
        • South Korea
      • By Product
      • By Application
      • By End User
    • Market Attractiveness Analysis
      • By Country
      • By Product
      • By Application
      • By End User
    • Key Takeaways
  12. South Asia & Pacific Market Analysis 2020 to 2024 and Forecast 2025 to 2035, By Country
    • Historical Market Size Value (USD Million) & Volume (Units) Trend Analysis By Market Taxonomy, 2020 to 2024
    • Market Size Value (USD Million) & Volume (Units) Forecast By Market Taxonomy, 2025 to 2035
      • By Country
        • India
        • ASEAN Countries
        • Australia& New Zealand
        • Rest of South Asia
      • By Product
      • By Application
      • By End User
    • Market Attractiveness Analysis
      • By Country
      • By Product
      • By Application
      • By End User
    • Key Takeaways
  13. Western Europe Market Analysis 2020 to 2024 and Forecast 2025 to 2035, By Country
    • Historical Market Size Value (USD Million) & Volume (Units) Trend Analysis By Market Taxonomy, 2020 to 2024
    • Market Size Value (USD Million) & Volume (Units) Forecast By Market Taxonomy, 2025 to 2035
      • By Country
        • Germany
        • UK
        • France
        • Italy
        • Spain
        • BENELUX
        • Nordic Countries
        • Rest of Western Europe
      • By Product
      • By Application
      • By End User
    • Market Attractiveness Analysis
      • By Country
      • By Product
      • By Application
      • By End User
    • Key Takeaways
  14. Eastern Europe Market Analysis 2020 to 2024 and Forecast 2025 to 2035, By Country
    • Historical Market Size Value (USD Million) & Volume (Units) Trend Analysis By Market Taxonomy, 2020 to 2024
    • Market Size Value (USD Million) & Volume (Units) Forecast By Market Taxonomy, 2025 to 2035
      • By Country
        • Russia
        • Hungary
        • Poland
        • Rest of Eastern Europe
      • By Product
      • By Application
      • By End User
    • Market Attractiveness Analysis
      • By Country
      • By Product
      • By Application
      • By End User
    • Key Takeaways
  15. Middle East & Africa Market Analysis 2020 to 2024 and Forecast 2025 to 2035, By Country
    • Historical Market Size Value (USD Million) & Volume (Units) Trend Analysis By Market Taxonomy, 2020 to 2024
    • Market Size Value (USD Million) & Volume (Units) Forecast By Market Taxonomy, 2025 to 2035
      • By Country
        • Saudi Arabia
        • Türkiye
        • South Africa
        • Other African Union
        • Rest of Middle East & Africa
      • By Product
      • By Application
      • By End User
    • Market Attractiveness Analysis
      • By Country
      • By Product
      • By Application
      • By End User
    • Key Takeaways
  16. Key Countries Market Analysis
    • USA
      • Pricing Analysis
      • Market Share Analysis, 2024
        • By Product
        • By Application
        • By End User
    • Brazil
      • Pricing Analysis
      • Market Share Analysis, 2024
        • By Product
        • By Application
        • By End User
    • China
      • Pricing Analysis
      • Market Share Analysis, 2024
        • By Product
        • By Application
        • By End User
    • India
      • Pricing Analysis
      • Market Share Analysis, 2024
        • By Product
        • By Application
        • By End User
    • Europe
      • Pricing Analysis
      • Market Share Analysis, 2024
        • By Product
        • By Application
        • By End User
    • Germany
      • Pricing Analysis
      • Market Share Analysis, 2024
        • By Product
        • By Application
        • By End User
    • France
      • Pricing Analysis
      • Market Share Analysis, 2024
        • By Product
        • By Application
        • By End User
    • UK
      • Pricing Analysis
      • Market Share Analysis, 2024
        • By Product
        • By Application
        • By End User
  17. Market Structure Analysis
    • Competition Dashboard
    • Competition Benchmarking
    • Market Share Analysis of Top Players
      • By Regional
      • By Product
      • By Application
      • By End User
  18. Competition Analysis
    • Competition Deep Dive
      • BioHorizons
        • Overview
        • Product Portfolio
        • Profitability by Market Segments (Product/Age /Sales Channel/Region)
        • Sales Footprint
        • Strategy Overview
          • Marketing Strategy
          • Product Strategy
          • Channel Strategy
      • Alpha-Bio Tec. Ltd.
        • Overview
        • Product Portfolio
        • Profitability by Market Segments (Product/Age /Sales Channel/Region)
        • Sales Footprint
        • Strategy Overview
          • Marketing Strategy
          • Product Strategy
          • Channel Strategy
      • ZimVie Inc.
        • Overview
        • Product Portfolio
        • Profitability by Market Segments (Product/Age /Sales Channel/Region)
        • Sales Footprint
        • Strategy Overview
          • Marketing Strategy
          • Product Strategy
          • Channel Strategy
      • Cortex Dental
        • Overview
        • Product Portfolio
        • Profitability by Market Segments (Product/Age /Sales Channel/Region)
        • Sales Footprint
        • Strategy Overview
          • Marketing Strategy
          • Product Strategy
          • Channel Strategy
      • Nobel Biocare Services AG
        • Overview
        • Product Portfolio
        • Profitability by Market Segments (Product/Age /Sales Channel/Region)
        • Sales Footprint
        • Strategy Overview
          • Marketing Strategy
          • Product Strategy
          • Channel Strategy
      • JDENTALCARE S.R.L.
        • Overview
        • Product Portfolio
        • Profitability by Market Segments (Product/Age /Sales Channel/Region)
        • Sales Footprint
        • Strategy Overview
          • Marketing Strategy
          • Product Strategy
          • Channel Strategy
      • Ritter Implants
        • Overview
        • Product Portfolio
        • Profitability by Market Segments (Product/Age /Sales Channel/Region)
        • Sales Footprint
        • Strategy Overview
          • Marketing Strategy
          • Product Strategy
          • Channel Strategy
      • Osstem Implant
        • Overview
        • Product Portfolio
        • Profitability by Market Segments (Product/Age /Sales Channel/Region)
        • Sales Footprint
        • Strategy Overview
          • Marketing Strategy
          • Product Strategy
          • Channel Strategy
      • Adin Dental Implant Systems Ltd.
        • Overview
        • Product Portfolio
        • Profitability by Market Segments (Product/Age /Sales Channel/Region)
        • Sales Footprint
        • Strategy Overview
          • Marketing Strategy
          • Product Strategy
          • Channel Strategy
      • Sweden & Martina S.p.A
        • Overview
        • Product Portfolio
        • Profitability by Market Segments (Product/Age /Sales Channel/Region)
        • Sales Footprint
        • Strategy Overview
          • Marketing Strategy
          • Product Strategy
          • Channel Strategy
      • ALLIANCE GLOBAL TECHNOLOGY LTD.
        • Overview
        • Product Portfolio
        • Profitability by Market Segments (Product/Age /Sales Channel/Region)
        • Sales Footprint
        • Strategy Overview
          • Marketing Strategy
          • Product Strategy
          • Channel Strategy
      • Others
        • Overview
        • Product Portfolio
        • Profitability by Market Segments (Product/Age /Sales Channel/Region)
        • Sales Footprint
        • Strategy Overview
          • Marketing Strategy
          • Product Strategy
          • Channel Strategy
  19. Assumptions & Acronyms Used
  20. Research Methodology

List of Tables

  • Table 1: Global Market Value (USD Million) Forecast by Region, 2020-2035
  • Table 2: Global Market Volume (Units) Forecast by Region, 2020-2035
  • Table 3: Global Market Value (USD Million) Forecast by Product, 2020-2035
  • Table 4: Global Market Volume (Units) Forecast by Product, 2020-2035
  • Table 5: Global Market Value (USD Million) Forecast by Application, 2020-2035
  • Table 6: Global Market Volume (Units) Forecast by Application, 2020-2035
  • Table 7: Global Market Value (USD Million) Forecast by End User, 2020-2035
  • Table 8: Global Market Volume (Units) Forecast by End User, 2020-2035
  • Table 9: North America Market Value (USD Million) Forecast by Country, 2020-2035
  • Table 10: North America Market Volume (Units) Forecast by Country, 2020-2035
  • Table 11: North America Market Value (USD Million) Forecast by Product, 2020-2035
  • Table 12: North America Market Volume (Units) Forecast by Product, 2020-2035
  • Table 13: North America Market Value (USD Million) Forecast by Application, 2020-2035
  • Table 14: North America Market Volume (Units) Forecast by Application, 2020-2035
  • Table 15: North America Market Value (USD Million) Forecast by End User, 2020-2035
  • Table 16: North America Market Volume (Units) Forecast by End User, 2020-2035
  • Table 17: Latin America Market Value (USD Million) Forecast by Country, 2020-2035
  • Table 18: Latin America Market Volume (Units) Forecast by Country, 2020-2035
  • Table 19: Latin America Market Value (USD Million) Forecast by Product, 2020-2035
  • Table 20: Latin America Market Volume (Units) Forecast by Product, 2020-2035
  • Table 21: Latin America Market Value (USD Million) Forecast by Application, 2020-2035
  • Table 22: Latin America Market Volume (Units) Forecast by Application, 2020-2035
  • Table 23: Latin America Market Value (USD Million) Forecast by End User, 2020-2035
  • Table 24: Latin America Market Volume (Units) Forecast by End User, 2020-2035
  • Table 25: East Asia Market Value (USD Million) Forecast by Country, 2020-2035
  • Table 26: East Asia Market Volume (Units) Forecast by Country, 2020-2035
  • Table 27: East Asia Market Value (USD Million) Forecast by Product, 2020-2035
  • Table 28: East Asia Market Volume (Units) Forecast by Product, 2020-2035
  • Table 29: East Asia Market Value (USD Million) Forecast by Application, 2020-2035
  • Table 30: East Asia Market Volume (Units) Forecast by Application, 2020-2035
  • Table 31: East Asia Market Value (USD Million) Forecast by End User, 2020-2035
  • Table 32: East Asia Market Volume (Units) Forecast by End User, 2020-2035
  • Table 33: South Asia & Pacific Market Value (USD Million) Forecast by Country, 2020-2035
  • Table 34: South Asia & Pacific Market Volume (Units) Forecast by Country, 2020-2035
  • Table 35: South Asia & Pacific Market Value (USD Million) Forecast by Product, 2020-2035
  • Table 36: South Asia & Pacific Market Volume (Units) Forecast by Product, 2020-2035
  • Table 37: South Asia & Pacific Market Value (USD Million) Forecast by Application, 2020-2035
  • Table 38: South Asia & Pacific Market Volume (Units) Forecast by Application, 2020-2035
  • Table 39: South Asia & Pacific Market Value (USD Million) Forecast by End User, 2020-2035
  • Table 40: South Asia & Pacific Market Volume (Units) Forecast by End User, 2020-2035
  • Table 41: Western Europe Market Value (USD Million) Forecast by Country, 2020-2035
  • Table 42: Western Europe Market Volume (Units) Forecast by Country, 2020-2035
  • Table 43: Western Europe Market Value (USD Million) Forecast by Product, 2020-2035
  • Table 44: Western Europe Market Volume (Units) Forecast by Product, 2020-2035
  • Table 45: Western Europe Market Value (USD Million) Forecast by Application, 2020-2035
  • Table 46: Western Europe Market Volume (Units) Forecast by Application, 2020-2035
  • Table 47: Western Europe Market Value (USD Million) Forecast by End User, 2020-2035
  • Table 48: Western Europe Market Volume (Units) Forecast by End User, 2020-2035
  • Table 49: Eastern Europe Market Value (USD Million) Forecast by Country, 2020-2035
  • Table 50: Eastern Europe Market Volume (Units) Forecast by Country, 2020-2035
  • Table 51: Eastern Europe Market Value (USD Million) Forecast by Product, 2020-2035
  • Table 52: Eastern Europe Market Volume (Units) Forecast by Product, 2020-2035
  • Table 53: Eastern Europe Market Value (USD Million) Forecast by Application, 2020-2035
  • Table 54: Eastern Europe Market Volume (Units) Forecast by Application, 2020-2035
  • Table 55: Eastern Europe Market Value (USD Million) Forecast by End User, 2020-2035
  • Table 56: Eastern Europe Market Volume (Units) Forecast by End User, 2020-2035
  • Table 57: Middle East & Africa Market Value (USD Million) Forecast by Country, 2020-2035
  • Table 58: Middle East & Africa Market Volume (Units) Forecast by Country, 2020-2035
  • Table 59: Middle East & Africa Market Value (USD Million) Forecast by Product, 2020-2035
  • Table 60: Middle East & Africa Market Volume (Units) Forecast by Product, 2020-2035
  • Table 61: Middle East & Africa Market Value (USD Million) Forecast by Application, 2020-2035
  • Table 62: Middle East & Africa Market Volume (Units) Forecast by Application, 2020-2035
  • Table 63: Middle East & Africa Market Value (USD Million) Forecast by End User, 2020-2035
  • Table 64: Middle East & Africa Market Volume (Units) Forecast by End User, 2020-2035

List of Figures

  • Figure 1: Global Market Value (USD Million) by Product, 2025-2035
  • Figure 2: Global Market Value (USD Million) by Application, 2025-2035
  • Figure 3: Global Market Value (USD Million) by End User, 2025-2035
  • Figure 4: Global Market Value (USD Million) by Region, 2025-2035
  • Figure 5: Global Market Value (USD Million) Analysis by Region, 2020-2035
  • Figure 6: Global Market Volume (Units) Analysis by Region, 2020-2035
  • Figure 7: Global Market Value Share (%) and BPS Analysis by Region, 2025-2035
  • Figure 8: Global Market Y-o-Y Growth (%) Projections by Region, 2025-2035
  • Figure 9: Global Market Value (USD Million) Analysis by Product, 2020-2035
  • Figure 10: Global Market Volume (Units) Analysis by Product, 2020-2035
  • Figure 11: Global Market Value Share (%) and BPS Analysis by Product, 2025-2035
  • Figure 12: Global Market Y-o-Y Growth (%) Projections by Product, 2025-2035
  • Figure 13: Global Market Value (USD Million) Analysis by Application, 2020-2035
  • Figure 14: Global Market Volume (Units) Analysis by Application, 2020-2035
  • Figure 15: Global Market Value Share (%) and BPS Analysis by Application, 2025-2035
  • Figure 16: Global Market Y-o-Y Growth (%) Projections by Application, 2025-2035
  • Figure 17: Global Market Value (USD Million) Analysis by End User, 2020-2035
  • Figure 18: Global Market Volume (Units) Analysis by End User, 2020-2035
  • Figure 19: Global Market Value Share (%) and BPS Analysis by End User, 2025-2035
  • Figure 20: Global Market Y-o-Y Growth (%) Projections by End User, 2025-2035
  • Figure 21: Global Market Attractiveness by Product, 2025-2035
  • Figure 22: Global Market Attractiveness by Application, 2025-2035
  • Figure 23: Global Market Attractiveness by End User, 2025-2035
  • Figure 24: Global Market Attractiveness by Region, 2025-2035
  • Figure 25: North America Market Value (USD Million) by Product, 2025-2035
  • Figure 26: North America Market Value (USD Million) by Application, 2025-2035
  • Figure 27: North America Market Value (USD Million) by End User, 2025-2035
  • Figure 28: North America Market Value (USD Million) by Country, 2025-2035
  • Figure 29: North America Market Value (USD Million) Analysis by Country, 2020-2035
  • Figure 30: North America Market Volume (Units) Analysis by Country, 2020-2035
  • Figure 31: North America Market Value Share (%) and BPS Analysis by Country, 2025-2035
  • Figure 32: North America Market Y-o-Y Growth (%) Projections by Country, 2025-2035
  • Figure 33: North America Market Value (USD Million) Analysis by Product, 2020-2035
  • Figure 34: North America Market Volume (Units) Analysis by Product, 2020-2035
  • Figure 35: North America Market Value Share (%) and BPS Analysis by Product, 2025-2035
  • Figure 36: North America Market Y-o-Y Growth (%) Projections by Product, 2025-2035
  • Figure 37: North America Market Value (USD Million) Analysis by Application, 2020-2035
  • Figure 38: North America Market Volume (Units) Analysis by Application, 2020-2035
  • Figure 39: North America Market Value Share (%) and BPS Analysis by Application, 2025-2035
  • Figure 40: North America Market Y-o-Y Growth (%) Projections by Application, 2025-2035
  • Figure 41: North America Market Value (USD Million) Analysis by End User, 2020-2035
  • Figure 42: North America Market Volume (Units) Analysis by End User, 2020-2035
  • Figure 43: North America Market Value Share (%) and BPS Analysis by End User, 2025-2035
  • Figure 44: North America Market Y-o-Y Growth (%) Projections by End User, 2025-2035
  • Figure 45: North America Market Attractiveness by Product, 2025-2035
  • Figure 46: North America Market Attractiveness by Application, 2025-2035
  • Figure 47: North America Market Attractiveness by End User, 2025-2035
  • Figure 48: North America Market Attractiveness by Country, 2025-2035
  • Figure 49: Latin America Market Value (USD Million) by Product, 2025-2035
  • Figure 50: Latin America Market Value (USD Million) by Application, 2025-2035
  • Figure 51: Latin America Market Value (USD Million) by End User, 2025-2035
  • Figure 52: Latin America Market Value (USD Million) by Country, 2025-2035
  • Figure 53: Latin America Market Value (USD Million) Analysis by Country, 2020-2035
  • Figure 54: Latin America Market Volume (Units) Analysis by Country, 2020-2035
  • Figure 55: Latin America Market Value Share (%) and BPS Analysis by Country, 2025-2035
  • Figure 56: Latin America Market Y-o-Y Growth (%) Projections by Country, 2025-2035
  • Figure 57: Latin America Market Value (USD Million) Analysis by Product, 2020-2035
  • Figure 58: Latin America Market Volume (Units) Analysis by Product, 2020-2035
  • Figure 59: Latin America Market Value Share (%) and BPS Analysis by Product, 2025-2035
  • Figure 60: Latin America Market Y-o-Y Growth (%) Projections by Product, 2025-2035
  • Figure 61: Latin America Market Value (USD Million) Analysis by Application, 2020-2035
  • Figure 62: Latin America Market Volume (Units) Analysis by Application, 2020-2035
  • Figure 63: Latin America Market Value Share (%) and BPS Analysis by Application, 2025-2035
  • Figure 64: Latin America Market Y-o-Y Growth (%) Projections by Application, 2025-2035
  • Figure 65: Latin America Market Value (USD Million) Analysis by End User, 2020-2035
  • Figure 66: Latin America Market Volume (Units) Analysis by End User, 2020-2035
  • Figure 67: Latin America Market Value Share (%) and BPS Analysis by End User, 2025-2035
  • Figure 68: Latin America Market Y-o-Y Growth (%) Projections by End User, 2025-2035
  • Figure 69: Latin America Market Attractiveness by Product, 2025-2035
  • Figure 70: Latin America Market Attractiveness by Application, 2025-2035
  • Figure 71: Latin America Market Attractiveness by End User, 2025-2035
  • Figure 72: Latin America Market Attractiveness by Country, 2025-2035
  • Figure 73: East Asia Market Value (USD Million) by Product, 2025-2035
  • Figure 74: East Asia Market Value (USD Million) by Application, 2025-2035
  • Figure 75: East Asia Market Value (USD Million) by End User, 2025-2035
  • Figure 76: East Asia Market Value (USD Million) by Country, 2025-2035
  • Figure 77: East Asia Market Value (USD Million) Analysis by Country, 2020-2035
  • Figure 78: East Asia Market Volume (Units) Analysis by Country, 2020-2035
  • Figure 79: East Asia Market Value Share (%) and BPS Analysis by Country, 2025-2035
  • Figure 80: East Asia Market Y-o-Y Growth (%) Projections by Country, 2025-2035
  • Figure 81: East Asia Market Value (USD Million) Analysis by Product, 2020-2035
  • Figure 82: East Asia Market Volume (Units) Analysis by Product, 2020-2035
  • Figure 83: East Asia Market Value Share (%) and BPS Analysis by Product, 2025-2035
  • Figure 84: East Asia Market Y-o-Y Growth (%) Projections by Product, 2025-2035
  • Figure 85: East Asia Market Value (USD Million) Analysis by Application, 2020-2035
  • Figure 86: East Asia Market Volume (Units) Analysis by Application, 2020-2035
  • Figure 87: East Asia Market Value Share (%) and BPS Analysis by Application, 2025-2035
  • Figure 88: East Asia Market Y-o-Y Growth (%) Projections by Application, 2025-2035
  • Figure 89: East Asia Market Value (USD Million) Analysis by End User, 2020-2035
  • Figure 90: East Asia Market Volume (Units) Analysis by End User, 2020-2035
  • Figure 91: East Asia Market Value Share (%) and BPS Analysis by End User, 2025-2035
  • Figure 92: East Asia Market Y-o-Y Growth (%) Projections by End User, 2025-2035
  • Figure 93: East Asia Market Attractiveness by Product, 2025-2035
  • Figure 94: East Asia Market Attractiveness by Application, 2025-2035
  • Figure 95: East Asia Market Attractiveness by End User, 2025-2035
  • Figure 96: East Asia Market Attractiveness by Country, 2025-2035
  • Figure 97: South Asia & Pacific Market Value (USD Million) by Product, 2025-2035
  • Figure 98: South Asia & Pacific Market Value (USD Million) by Application, 2025-2035
  • Figure 99: South Asia & Pacific Market Value (USD Million) by End User, 2025-2035
  • Figure 100: South Asia & Pacific Market Value (USD Million) by Country, 2025-2035
  • Figure 101: South Asia & Pacific Market Value (USD Million) Analysis by Country, 2020-2035
  • Figure 102: South Asia & Pacific Market Volume (Units) Analysis by Country, 2020-2035
  • Figure 103: South Asia & Pacific Market Value Share (%) and BPS Analysis by Country, 2025-2035
  • Figure 104: South Asia & Pacific Market Y-o-Y Growth (%) Projections by Country, 2025-2035
  • Figure 105: South Asia & Pacific Market Value (USD Million) Analysis by Product, 2020-2035
  • Figure 106: South Asia & Pacific Market Volume (Units) Analysis by Product, 2020-2035
  • Figure 107: South Asia & Pacific Market Value Share (%) and BPS Analysis by Product, 2025-2035
  • Figure 108: South Asia & Pacific Market Y-o-Y Growth (%) Projections by Product, 2025-2035
  • Figure 109: South Asia & Pacific Market Value (USD Million) Analysis by Application, 2020-2035
  • Figure 110: South Asia & Pacific Market Volume (Units) Analysis by Application, 2020-2035
  • Figure 111: South Asia & Pacific Market Value Share (%) and BPS Analysis by Application, 2025-2035
  • Figure 112: South Asia & Pacific Market Y-o-Y Growth (%) Projections by Application, 2025-2035
  • Figure 113: South Asia & Pacific Market Value (USD Million) Analysis by End User, 2020-2035
  • Figure 114: South Asia & Pacific Market Volume (Units) Analysis by End User, 2020-2035
  • Figure 115: South Asia & Pacific Market Value Share (%) and BPS Analysis by End User, 2025-2035
  • Figure 116: South Asia & Pacific Market Y-o-Y Growth (%) Projections by End User, 2025-2035
  • Figure 117: South Asia & Pacific Market Attractiveness by Product, 2025-2035
  • Figure 118: South Asia & Pacific Market Attractiveness by Application, 2025-2035
  • Figure 119: South Asia & Pacific Market Attractiveness by End User, 2025-2035
  • Figure 120: South Asia & Pacific Market Attractiveness by Country, 2025-2035
  • Figure 121: Western Europe Market Value (USD Million) by Product, 2025-2035
  • Figure 122: Western Europe Market Value (USD Million) by Application, 2025-2035
  • Figure 123: Western Europe Market Value (USD Million) by End User, 2025-2035
  • Figure 124: Western Europe Market Value (USD Million) by Country, 2025-2035
  • Figure 125: Western Europe Market Value (USD Million) Analysis by Country, 2020-2035
  • Figure 126: Western Europe Market Volume (Units) Analysis by Country, 2020-2035
  • Figure 127: Western Europe Market Value Share (%) and BPS Analysis by Country, 2025-2035
  • Figure 128: Western Europe Market Y-o-Y Growth (%) Projections by Country, 2025-2035
  • Figure 129: Western Europe Market Value (USD Million) Analysis by Product, 2020-2035
  • Figure 130: Western Europe Market Volume (Units) Analysis by Product, 2020-2035
  • Figure 131: Western Europe Market Value Share (%) and BPS Analysis by Product, 2025-2035
  • Figure 132: Western Europe Market Y-o-Y Growth (%) Projections by Product, 2025-2035
  • Figure 133: Western Europe Market Value (USD Million) Analysis by Application, 2020-2035
  • Figure 134: Western Europe Market Volume (Units) Analysis by Application, 2020-2035
  • Figure 135: Western Europe Market Value Share (%) and BPS Analysis by Application, 2025-2035
  • Figure 136: Western Europe Market Y-o-Y Growth (%) Projections by Application, 2025-2035
  • Figure 137: Western Europe Market Value (USD Million) Analysis by End User, 2020-2035
  • Figure 138: Western Europe Market Volume (Units) Analysis by End User, 2020-2035
  • Figure 139: Western Europe Market Value Share (%) and BPS Analysis by End User, 2025-2035
  • Figure 140: Western Europe Market Y-o-Y Growth (%) Projections by End User, 2025-2035
  • Figure 141: Western Europe Market Attractiveness by Product, 2025-2035
  • Figure 142: Western Europe Market Attractiveness by Application, 2025-2035
  • Figure 143: Western Europe Market Attractiveness by End User, 2025-2035
  • Figure 144: Western Europe Market Attractiveness by Country, 2025-2035
  • Figure 145: Eastern Europe Market Value (USD Million) by Product, 2025-2035
  • Figure 146: Eastern Europe Market Value (USD Million) by Application, 2025-2035
  • Figure 147: Eastern Europe Market Value (USD Million) by End User, 2025-2035
  • Figure 148: Eastern Europe Market Value (USD Million) by Country, 2025-2035
  • Figure 149: Eastern Europe Market Value (USD Million) Analysis by Country, 2020-2035
  • Figure 150: Eastern Europe Market Volume (Units) Analysis by Country, 2020-2035
  • Figure 151: Eastern Europe Market Value Share (%) and BPS Analysis by Country, 2025-2035
  • Figure 152: Eastern Europe Market Y-o-Y Growth (%) Projections by Country, 2025-2035
  • Figure 153: Eastern Europe Market Value (USD Million) Analysis by Product, 2020-2035
  • Figure 154: Eastern Europe Market Volume (Units) Analysis by Product, 2020-2035
  • Figure 155: Eastern Europe Market Value Share (%) and BPS Analysis by Product, 2025-2035
  • Figure 156: Eastern Europe Market Y-o-Y Growth (%) Projections by Product, 2025-2035
  • Figure 157: Eastern Europe Market Value (USD Million) Analysis by Application, 2020-2035
  • Figure 158: Eastern Europe Market Volume (Units) Analysis by Application, 2020-2035
  • Figure 159: Eastern Europe Market Value Share (%) and BPS Analysis by Application, 2025-2035
  • Figure 160: Eastern Europe Market Y-o-Y Growth (%) Projections by Application, 2025-2035
  • Figure 161: Eastern Europe Market Value (USD Million) Analysis by End User, 2020-2035
  • Figure 162: Eastern Europe Market Volume (Units) Analysis by End User, 2020-2035
  • Figure 163: Eastern Europe Market Value Share (%) and BPS Analysis by End User, 2025-2035
  • Figure 164: Eastern Europe Market Y-o-Y Growth (%) Projections by End User, 2025-2035
  • Figure 165: Eastern Europe Market Attractiveness by Product, 2025-2035
  • Figure 166: Eastern Europe Market Attractiveness by Application, 2025-2035
  • Figure 167: Eastern Europe Market Attractiveness by End User, 2025-2035
  • Figure 168: Eastern Europe Market Attractiveness by Country, 2025-2035
  • Figure 169: Middle East & Africa Market Value (USD Million) by Product, 2025-2035
  • Figure 170: Middle East & Africa Market Value (USD Million) by Application, 2025-2035
  • Figure 171: Middle East & Africa Market Value (USD Million) by End User, 2025-2035
  • Figure 172: Middle East & Africa Market Value (USD Million) by Country, 2025-2035
  • Figure 173: Middle East & Africa Market Value (USD Million) Analysis by Country, 2020-2035
  • Figure 174: Middle East & Africa Market Volume (Units) Analysis by Country, 2020-2035
  • Figure 175: Middle East & Africa Market Value Share (%) and BPS Analysis by Country, 2025-2035
  • Figure 176: Middle East & Africa Market Y-o-Y Growth (%) Projections by Country, 2025-2035
  • Figure 177: Middle East & Africa Market Value (USD Million) Analysis by Product, 2020-2035
  • Figure 178: Middle East & Africa Market Volume (Units) Analysis by Product, 2020-2035
  • Figure 179: Middle East & Africa Market Value Share (%) and BPS Analysis by Product, 2025-2035
  • Figure 180: Middle East & Africa Market Y-o-Y Growth (%) Projections by Product, 2025-2035
  • Figure 181: Middle East & Africa Market Value (USD Million) Analysis by Application, 2020-2035
  • Figure 182: Middle East & Africa Market Volume (Units) Analysis by Application, 2020-2035
  • Figure 183: Middle East & Africa Market Value Share (%) and BPS Analysis by Application, 2025-2035
  • Figure 184: Middle East & Africa Market Y-o-Y Growth (%) Projections by Application, 2025-2035
  • Figure 185: Middle East & Africa Market Value (USD Million) Analysis by End User, 2020-2035
  • Figure 186: Middle East & Africa Market Volume (Units) Analysis by End User, 2020-2035
  • Figure 187: Middle East & Africa Market Value Share (%) and BPS Analysis by End User, 2025-2035
  • Figure 188: Middle East & Africa Market Y-o-Y Growth (%) Projections by End User, 2025-2035
  • Figure 189: Middle East & Africa Market Attractiveness by Product, 2025-2035
  • Figure 190: Middle East & Africa Market Attractiveness by Application, 2025-2035
  • Figure 191: Middle East & Africa Market Attractiveness by End User, 2025-2035
  • Figure 192: Middle East & Africa Market Attractiveness by Country, 2025-2035

Frequently Asked Questions

How big is the Global Guided Surgery Kits Market in 2025?

The Global Guided Surgery Kits Market is estimated to be valued at USD 1,634.4 million in 2025.

What will be the size of the Global Guided Surgery Kits Market in 2035?

The market size for Guided Surgery Kits is projected to reach USD 3,096.9 million by 2035.

How much will the Global Guided Surgery Kits Market grow between 2025 and 2035?

The Global Guided Surgery Kits Market is expected to grow at a CAGR of 6.6% during this period.

What are the key product types in the Global Guided Surgery Kits Market?

Key product types include Fully Guided Surgery Kits, Pilot Drill Guided Kits, Universal Guided Kits, System-Specific Kits, and Others.

Which application segment will contribute a significant share in the Global Guided Surgery Kits Market in 2025?

The Single Implant Placement segment is projected to command 43.8% of the market in 2025.

Explore Similar Insights

Future Market Insights

Guided Surgery Kits Market