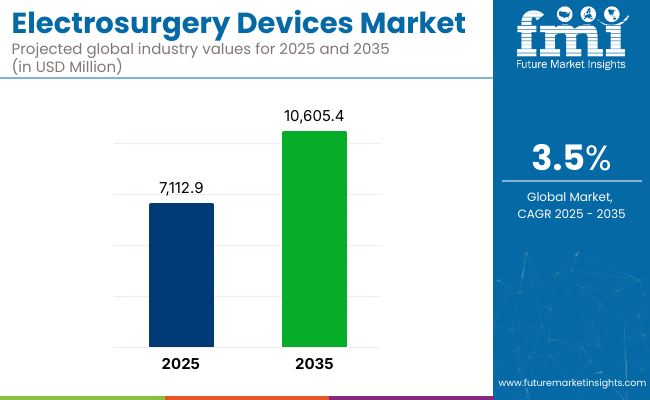
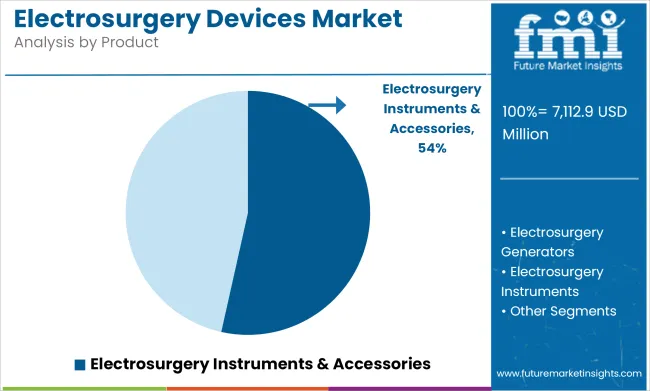
The global Electrosurgery Devices Market is estimated to be valued at USD 7,112.9 million in 2025 and is projected to reach USD 10,605.4 million by 2035, registering a compound annual growth rate (CAGR) of 3.5% over the forecast period. The electrosurgery devices market is experiencing steady expansion, driven by increasing surgical volumes across minimally invasive, outpatient, and robotic-assisted procedures.
Electrosurgical modalities remain critical for precision cutting, coagulation, ablation, and tissue sealing across multiple specialties, including general surgery, gynecology, urology, orthopedics, and oncology. Advancements in energy control, tissue sensing, and thermal management are improving surgical accuracy while minimizing collateral tissue damage.
The growing demand for hybrid ORs, coupled with the shift toward day-case surgeries, is increasing the need for multifunctional energy platforms that integrate seamlessly with imaging and robotic systems. Rising concerns over surgical smoke exposure and hospital-acquired infections are also driving interest in advanced electrosurgical smoke evacuation solutions. With surgical complexity increasing and healthcare systems emphasizing surgical efficiency, patient safety, and cost-effectiveness, electrosurgical devices are poised for robust global growth as cornerstone technologies in modern operating rooms.

| Metric | Value |
|---|---|
| Market Size (2025E) | USD 7,112.9 million |
| Market Value (2035F) | USD 10,605.4 million |
| CAGR (2025 to 2035) | 3.5% |
Leading manufacturers such as Medtronic, Olympus, Johnson & Johnson (Ethicon), B. Braun, ERBE Elektromedizin, and CONMED are actively driving growth through device innovation, portfolio diversification, and integration with robotic and advanced laparoscopic platforms. Companies are focusing on developing multifunctional devices capable of combining vessel sealing, tissue dissection, and coagulation to minimize instrument exchange.
In 2025, Johnson & Johnson MedTech has launched the Dualto Energy System, an “integrated” platform for both open and minimally invasive surgery. “The DUALTO Energy System represents a significant advancement in human-centric design, delivering a fully connected solution that simplifies surgical energy and enhances efficiencies in the OR,” said Hani Abouhalka, Company Group Chairman, Surgery, Johnson & Johnson MedTech.
North America remains the dominant market for electrosurgery devices, driven by high surgical procedure volumes, early adoption of advanced energy platforms, and robust regulatory approvals. Rising hospital mandates on surgical smoke evacuation and occupational safety standards are driving procurement of integrated electrosurgical systems with smoke management capabilities. Partnerships between device manufacturers and robotic surgical companies are enhancing adoption of multifunctional electrosurgery in hybrid OR.
Europe’s electrosurgery devices market is growing, supported by centralized public procurement, expanding surgical robotics adoption, and stringent EU MDR compliance driving safer electrosurgical device innovation. Germany, France, and the Nordics are leading adopters of hybrid energy systems, particularly in gynecologic oncology, hepatobiliary, and colorectal surgery. Europe’s strict MDR compliance continues to shape a highly quality-driven market poised for technology-intensive growth across multiple surgical disciplines.
In 2025, urology surgery is projected to hold 24.6% of the revenue share in the electrosurgery devices market. This leadership is driven by the increasing use of electrosurgical devices in urology procedures, where precision and minimal invasiveness are critical for optimal outcomes. Electrosurgery devices, such as bipolar and monopolar systems, are widely used in urology for prostate surgeries, kidney surgeries, and bladder resections due to their ability to effectively cut tissue while controlling bleeding.

The growth of this segment has been driven by advancements in minimally invasive techniques, which have become increasingly popular in urology due to shorter recovery times, reduced complications, and improved patient outcomes. The integration of electrosurgical devices with other urological instruments, such as endoscopes and robotic systems, has further enhanced their application in urology.
In 2025, hospitals are expected to capture 53.5% of the revenue share in the electrosurgery devices market. This dominance is attributed to the high volume of surgical procedures performed in hospitals, particularly those requiring precise cutting, coagulation, and tissue removal.
Electrosurgery devices are essential in a wide range of surgeries, including general, cardiovascular, and orthopedic procedures, due to their ability to minimize blood loss and improve surgical outcomes.

The growth of this segment has been fueled by advancements in electrosurgical technologies, including enhanced safety features, improved precision, and integration with other surgical tools. Additionally, hospitals often benefit from reimbursement policies that support the use of advanced electrosurgery devices, making them the leading end-user segment in the market.
Challenges
Risk of Thermal Tissue Damage and Regulatory Compliance Issues
One of the greatest challenges facing electrosurgery instruments is that there is a danger that they will cause thermal burns and other tissue damage. Because of the overheating of surgical instruments, nerve damage, wound-healing delay and surgical complications are rife. Therefore advanced safety systems must be added as well as training for surgeons.
Furthermore, strict regulatory requirements for receiving approvals in medical devices, the high costs of robotic-assisted surgery systems and concern about electromagnetic interference with pacemakers or other implants could have an adverse impact on adoption rates within particular markets. The challenge of continuously maintaining product quality, updating safety guidelines and following them increases the difficulties of developing and commercializing such products.
Opportunities
AI-Powered Electrosurgery, Smart ESUs, and Expansion in Emerging Markets
Despite some challenges, the electrosurgery devices market offers ample growth opportunities. A number of new technologies such as AI-assisted electrosurgery planning, with models that use machine learning techniques to analyze data from the surgical site and give the operating surgeon optimized energy settings, are raising both precision in surgery and ease or difficulty of surgery.
The development of intelligent electrosurgical units (ESUs) with automatic power adjustment, real-time feedback loops, and wireless connectivity for remote monitoring is improving surgical safety and efficiency. Moreover, the advent of plasma-based energy systems, radiofrequency ablation (RFA), and argon plasma coagulation (APC) in tumor removal and endoscopie procedures is broadening the market.
The growing use of electrosurgery in India, Brazil and other emerging markets is winning over customers in these countries with government-sponsored health care programs, expansion of medical device manufacturing, better access to minimally invasive surgical technique and new designs of medical product targeted at their particular needs. Portable battery-operated electrosurgical devices are becoming more common in ambulatory surgery centers (ASCs) and remote healthcare facilities.

In the United States, where clinical electrosurgical devices market development is in a stable phase, there is higher demand for minimally invasive operations that do not require patient overnight hospital stays. Furthermore, increased acceptance by physicians of advanced energy sources combined with growing incidents of diseases such as diabetes and cancer needing surgery, have also contributed to this trend. The Food and Drug Administration (FDA) and American College of Surgeons (ACS) regulate electrosurgery devices to ensure patient safety, and that they are effective.
Market demand is being propelled along by the latest technology, including AI-powered energy-based devices for robotic-assisted electrosurgery and fully disposable electrosurgical instrument packs. Moreover, the enthusiasm for outpatient surgical centers is now being strengthened by investments in these facilities without smell control system advances at their core.
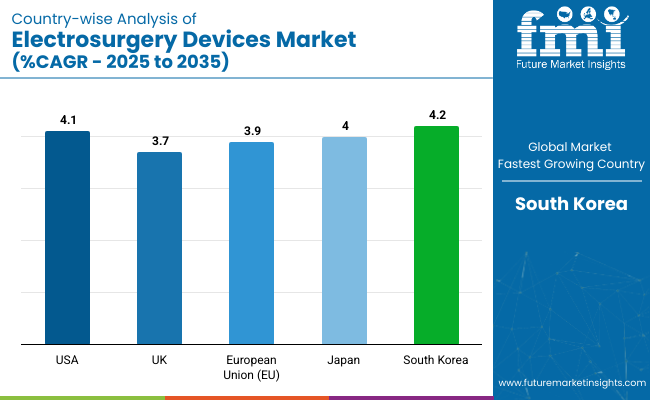
| Country | CAGR (2025 to 2035) |
|---|---|
| USA | 4.1% |
In the United Kingdom, the market for electrosurgery devices is increasing based on higher volumes of surgical procedures and investment in health care infrastructure. It is also driven by the spreading use of energy-based surgical tools. To ensure strict safety standards for electrosurgery equipment, the UK Medicines and Healthcare Products Regulatory Agency (MHRA) and National Health Service (NHS) have made provisions.
Intelligent optoelectric surgical instruments are increasingly being popular, while Energy Devices in Surgery is introduced into the AI. And, monopolar and bipolar electrosurgery in general surgery, gynecology, and dermatology alike is gaining use. Also, growing demand for reusable and economical electrosurgical instruments is taking an effect on the purchasing trends seen in hospitals and physician offices.
| Country | CAGR (2025 to 2035) |
|---|---|
| UK | 3.7% |
In the European Union electrosurgery devices market is going through steady development, as a result of tough EU laws medical equipment, the mount of request for precision surgical instruments and the fact more surgeons are now using electrosurgery in surgical ambulatory care.
European Medical Device Regulation (MDR) and the European Society of Surgical Oncology (ESSO) have as a standard adopted it themselves to exercise influence on the way instruments get treated before they finally hit market. Their goal is to ensure that all electrosurgical tools will be strictly assured of their safety requirements. Use of AI-assisted electrosurgery, smoke-free surgical technologies, and high-frequency electrosurgical generators is prevalent in Germany, France, and Italy. Furthermore, innovation nowadays is essentially happening in advanced radiofrequency and plasma-based electrosurgical instruments.
| Region | CAGR (2025 to 2035) |
|---|---|
| European Union (EU) | 3.9% |
Market expansion of electrosurgery devices in Japan is being driven by the advance in demand for high-precision surgical technology as well as an aging population which undergoes more and longer respective operations. The Japanese Ministry of Health and Welfare is encouraging minimally invasive electronic surgical methods to be taken up.
Japanese medical device manufacturers are developing next-generation bipolar and ultrasonic electrosurgical devices incorporating AI for precision cutting and coagulation. In addition, the introduction of robotic-assisted electrosurgery into orthopedic and oncologic procedures has stimulated sector innovation.
| Country | CAGR (2025 to 2035) |
|---|---|
| Japan | 4.0% |
As medical tourism continues to grow and utilize the most cutting-edge surgical solutions the market for surgical electrosurgery devices has also been on an upswing in South Korea already. This is in no small part down to increasing investments in advanced energy-based devices which has been an additional boon for local manufactures of them. The South Korean Ministry of Food and Drug Safety handles regulation of electrosurgery devices. This requires that they comply with international safety standards.
With the growth of outpatient surgery centers, utilization of laser and plasma-based electrosurgical systems, and development in technology for clearing away smoke from or around the work area, the market is experiencing further expansion. Another area which is showing growth is AI-assisted electrosurgical instruments for robotic surgery. These instruments are now being actively adopted in most major cities where they can be purchased by instruments dealers on behalf of hospitals harboring specialties.
| Country | CAGR (2025 to 2035) |
|---|---|
| South Korea | 4.2% |
The electrosurgery devices market is expanding due to increasing demand for minimally invasive surgical procedures, advancements in energy-based surgical instruments, and rising adoption of electrosurgical techniques in general, cosmetic, and robotic-assisted surgeries. The market is driven by technological innovations in radiofrequency (RF) and ultrasonic energy devices, growing outpatient surgeries, and increased investments in surgical robotics.
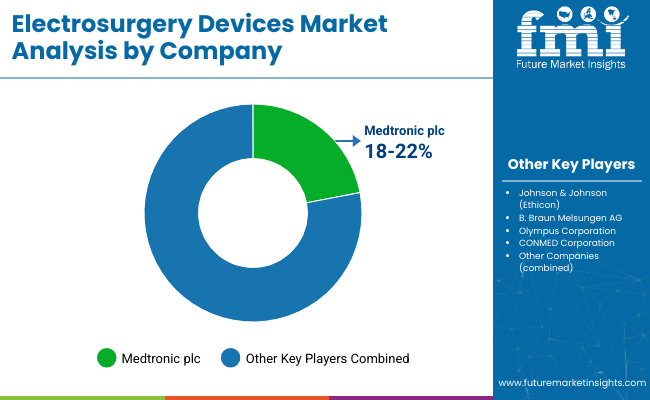
Companies focus on bipolar and monopolar electrosurgical instruments, plasma-based energy devices, and AI-powered surgical systems to enhance precision, safety, and procedural efficiency. The market includes leading medical device manufacturers, surgical instrument providers, and healthcare technology firms, each contributing to innovations in real-time energy control, smoke evacuation, and thermal injury prevention.

Medtronic plc (18-22%)
Medtronic leads the electrosurgery devices market, offering high-frequency energy systems for precision cutting, coagulation, and vessel sealing across multiple surgical applications.
Johnson & Johnson (Ethicon) (12-16%)
Ethicon specializes in ultrasonic and advanced bipolar energy devices, ensuring tissue-selective dissection and improved hemostasis in laparoscopic and open surgeries.
B. Braun Melsungen AG (10-14%)
B. Braun provides high-precision bipolar instruments, focusing on safety-enhanced electrosurgical systems for controlled energy delivery.
Olympus Corporation (8-12%)
Olympus is known for plasma energy-based electrosurgical solutions, catering to minimally invasive and endoscopic surgical applications.
CONMED Corporation (6-10%)
CONMED develops RF electrosurgery tools and smoke evacuation systems, prioritizing safety, efficiency, and reduced thermal spread.
Other Key Players (30-40% Combined)
Several medical device firms, electrosurgical equipment manufacturers, and robotic-assisted surgery technology providers contribute to advancements in precision energy delivery, automated surgical workflows, and AI-driven tissue response systems. These include:
The overall market size for the electrosurgery devices market was USD 7,112.9 million in 2025.
The electrosurgery devices market is expected to reach USD 10,605.4 million in 2035.
Increasing demand for minimally invasive procedures, advancements in electrosurgical technology, and rising prevalence of chronic diseases requiring surgical intervention will drive market growth.
The USA, Germany, China, Japan, and India are key contributors.
Radiofrequency electrosurgical devices are expected to dominate due to their precision, reduced thermal damage, and widespread use in general and cosmetic surgeries.


Our Research Products

The "Full Research Suite" delivers actionable market intel, deep dives on markets or technologies, so clients act faster, cut risk, and unlock growth.

The Leaderboard benchmarks and ranks top vendors, classifying them as Established Leaders, Leading Challengers, or Disruptors & Challengers.

Locates where complements amplify value and substitutes erode it, forecasting net impact by horizon

We deliver granular, decision-grade intel: market sizing, 5-year forecasts, pricing, adoption, usage, revenue, and operational KPIs—plus competitor tracking, regulation, and value chains—across 60 countries broadly.

Spot the shifts before they hit your P&L. We track inflection points, adoption curves, pricing moves, and ecosystem plays to show where demand is heading, why it is changing, and what to do next across high-growth markets and disruptive tech

Real-time reads of user behavior. We track shifting priorities, perceptions of today’s and next-gen services, and provider experience, then pace how fast tech moves from trial to adoption, blending buyer, consumer, and channel inputs with social signals (#WhySwitch, #UX).

Partner with our analyst team to build a custom report designed around your business priorities. From analysing market trends to assessing competitors or crafting bespoke datasets, we tailor insights to your needs.
Supplier Intelligence
Discovery & Profiling
Capacity & Footprint
Performance & Risk
Compliance & Governance
Commercial Readiness
Who Supplies Whom
Scorecards & Shortlists
Playbooks & Docs
Category Intelligence
Definition & Scope
Demand & Use Cases
Cost Drivers
Market Structure
Supply Chain Map
Trade & Policy
Operating Norms
Deliverables
Buyer Intelligence
Account Basics
Spend & Scope
Procurement Model
Vendor Requirements
Terms & Policies
Entry Strategy
Pain Points & Triggers
Outputs
Pricing Analysis
Benchmarks
Trends
Should-Cost
Indexation
Landed Cost
Commercial Terms
Deliverables
Brand Analysis
Positioning & Value Prop
Share & Presence
Customer Evidence
Go-to-Market
Digital & Reputation
Compliance & Trust
KPIs & Gaps
Outputs
Full Research Suite comprises of:
Market outlook & trends analysis
Interviews & case studies
Strategic recommendations
Vendor profiles & capabilities analysis
5-year forecasts
8 regions and 60+ country-level data splits
Market segment data splits
12 months of continuous data updates
DELIVERED AS:
PDF EXCEL ONLINE
Electrosurgery Accessories Market Size and Share Forecast Outlook 2025 to 2035
Electrosurgery Generators Market Analysis - Size, Share, and Forecast 2025 to 2035
FBAR Devices Market
Snare devices Market
C-Arms Devices Market Size and Share Forecast Outlook 2025 to 2035
Timing Devices Market Analysis - Size, Growth, & Forecast Outlook 2025 to 2035
Spinal Devices Market Size and Share Forecast Outlook 2025 to 2035
Hearing Devices 3D Printing Market Size and Share Forecast Outlook 2025 to 2035
Medical Devices Market Size and Share Forecast Outlook 2025 to 2035
Network Devices Market Size and Share Forecast Outlook 2025 to 2035
Medical Devices Secondary Packaging Market Analysis by Material and Application Through 2035
Hearable Devices Market Size and Share Forecast Outlook 2025 to 2035
Lab Chip Devices Market Size and Share Forecast Outlook 2025 to 2035
Orthotic Devices, Casts and Splints Market Size and Share Forecast Outlook 2025 to 2035
Lacrimal Devices Market Size, Trends, and Forecast 2025 to 2035
Global Ablation Devices Market Trends - Growth, Innovations & Forecast 2025 to 2035
Orthotic Devices, Splints & Orthopedic Braces Market Analysis - Trends & Forecast 2024 to 2034
Ear Tube Devices Market
Pathology Devices Market Size and Share Forecast Outlook 2025 to 2035
Neurotech Devices Market Size and Share Forecast Outlook 2025 to 2035

Thank you!
You will receive an email from our Business Development Manager. Please be sure to check your SPAM/JUNK folder too.
Chat With
MaRIA