CT Guided Intervention Market Size, Share & Forecast Outlook 2025 to 2035

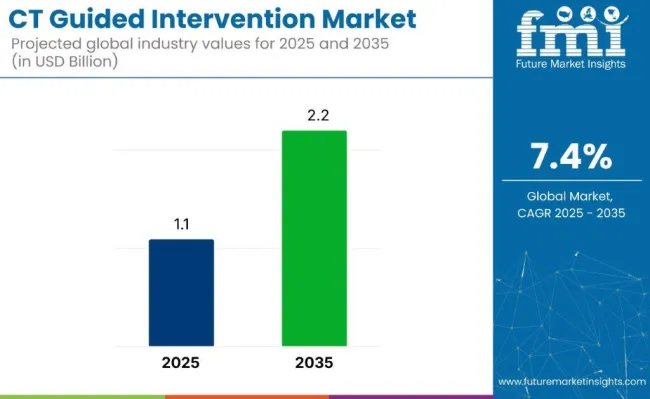
The CT guided intervention market is expected to record a valuation of USD 1.1 billion in 2025and USD 2.2 billion by 2035, at a CAGR of 7.4% during the forecast period. The growth is being driven by the increasing demand for minimally invasive procedures and advancements in CT technology, which allow for precise diagnostics and real-time guidance during interventions. The rise in the aging population, combined with a higher incidence of chronic diseases such as cancer, cardiovascular diseases, and neurological disorders, is contributing to market expansion.
Quick Stats of CT Guided Intervention Market

  • Market Value (2025): USD 1.1 billion
  • Forecast Value (2035): USD 2.2 billion
  • Forecast CAGR: 7.4%
  • Key Growth Region: Asia (India)
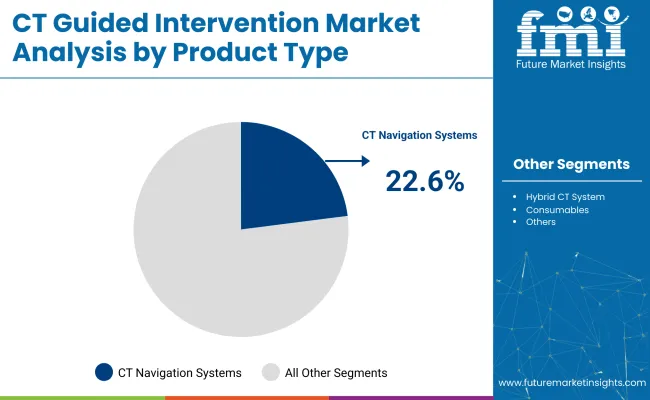
  • Leading Segment: CT Navigation Systems ( 22.6% share)
  • Top Key Players: Siemens Healthineers AG, CANON MEDICAL SYSTEMS USA, INC., Koninklijke Philips N.V., GE Healthcare, BVM Medical Limited

Ct Guided Intervention Market

In the official press release on January 9, 2023, it was stated by Jan Makela, President and CEO of Imaging at GE HealthCare, that: “We’re thrilled to take this step in strengthening our interventional guidance offering for patients and customers. The Imactis CT-Navigation system is designed to improve workflow for interventional radiologists and hospitals by increasing procedural accuracy, while helping to reduce procedure time and radiation dose for both patients and physicians.

It is an innovative navigation solution for image-guided percutaneous procedures that aims to achieve better patient outcomes by reducing variability in both simple and complex procedures and improving reproducibility.” This statement underscores GE HealthCare’s commitment to enhancing interventional guidance solutions, particularly through the acquisition of Imactis, a company specializing in CT interventional guidance systems.

The industry is being influenced by ongoing innovations in CT navigation systems. Procedural accuracy is expected to be enhanced, radiation exposure is expected to be minimized, and patient outcomes are expected to improve as a result of these advancements. The integration of advanced imaging technologies and navigation systems is anticipated to play a critical role in driving industrial growth through 2035, with further developments expected to improve efficiency and reduce risks during procedures.

Analyzed CT Guided Intervention Market by Top Investment Segments

The CT guided intervention market is witnessing substantial growth, driven by innovations in CT navigation systems, increasing demand for tumor biopsy applications, and the dominance of hospitals in end-use sectors.

CT Navigation Systems to Lead Product Type Segment

CT navigation systems are expected to hold 22.6% of the market share in 2025.
  • CT navigation systems are valued for their ability to guide precise and minimally invasive interventions, particularly in tumor biopsies and other diagnostic procedures. The increasing adoption of these systems is driven by their ability to improve surgical outcomes, reduce complications, and enhance the efficiency of procedures.
  • Companies like Siemens Healthineers and GE Healthcare are continuously advancing CT navigation technologies, enabling surgeons to conduct complex procedures with greater accuracy. These systems are being integrated into more healthcare facilities, particularly hospitals, for their superior functionality in clinical settings.

Ct Guided Intervention Market Analysis By Product Type

Tumor Biopsy will dominate the Application Segment.

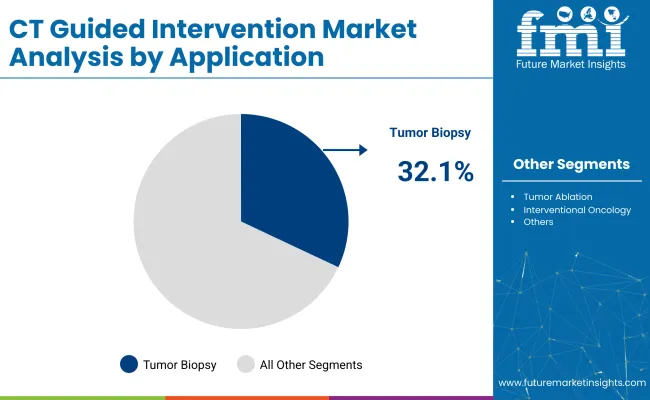
Tumor biopsy is projected to account for 32.1% of the market share in 2025. It is widely used to diagnose various types of cancer by obtaining tissue samples for further examination. Tumor biopsy procedures are increasingly being performed with the help of CT-guided intervention systems, which ensure accurate targeting of lesions.
  • The growing demand for early-stage cancer detection and personalized treatment options is fueling this trend.
  • Major healthcare providers such as Hologic and Philips are developing advanced biopsy systems, enhancing the speed and accuracy of tumor diagnosis. The integration of robotic and automated technologies further strengthens the growth prospects of this application.

Ct Guided Intervention Market Analysis By Application

Hospitals Expected to Dominate End-User Segment

Hospitals are projected to dominate the end-user segment, holding an estimated 48.5% market share in 2025. Most CT-guided interventions have been performed in hospitals where access to specialized staff and infrastructure remains highest.

  • Hospitals are preferred for these treatments due to their comprehensive resources, skilled medical staff, and advanced imaging technologies. The growth in hospital investments, especially in developed countries, contributes to the rising adoption of CT navigation systems.
  • Companies like Medtronic and Varian are partnering with hospitals to integrate their technologies into the clinical workflow, improving patient outcomes through more accurate procedures and reducing overall treatment times.

Top CT-Guided Intervention Market Dynamics

The CT-guided intervention market is being driven by advancements in imaging technology and increasing demand for minimally invasive procedures. However, high equipment costs and limited accessibility in certain regions are limiting industrial growth.

Advancements in Imaging Technology Driving Market Growth

The CT-guided intervention industry is being significantly driven by advancements in imaging systems and the rising demand for minimally invasive procedures. High-resolution CT scanners are being used to enable precise localization of lesions, facilitating accurate needle placement during interventions.

These advancements are being applied to enhance the safety and efficacy of procedures such as biopsies, ablations, and drainage, leading to improved patient outcomes. The growing preference for minimally invasive treatments, which are associated with reduced recovery times and lower complication rates, is further driving the adoption of CT-guided interventions in clinical settings.

High Equipment Costs Limiting Market Growth Potential

Despite the benefits, challenges related to high equipment costs and limited accessibility in certain regions are being faced by the CT-guided intervention industry. The acquisition and maintenance of advanced CT imaging systems are requiring substantial financial investment, which is being considered prohibitive for healthcare facilities in resource-constrained settings.

Additionally, the availability of trained personnel to operate these sophisticated systems is being restricted in some areas, impacting the widespread implementation of CT-guided interventions. These barriers are limiting the growth potential of the industry, particularly in developing regions where healthcare infrastructure may be underdeveloped.

Analyzing Top Countries Manufacturing and Distributing CT Guided Intervention Solutions

The CT guided intervention market is expected to grow steadily through 2035, driven by advancements in imaging technology and the increasing demand for minimally invasive procedures. Rapid expansion is being seen in emerging economies, while innovation and healthcare accessibility are being prioritized in mature landscape.

Countries CAGR (2025 to 2035)
United States 4.9%
Germany 5.4%
China 8.2%
Japan 4.2%
India 9.1%

In-depth Analysis of the United States CT Guided Intervention Market

The United States CT Guided Intervention Market is expected to grow at a CAGR of 4.9% through 2035.

  • Advances in imaging technology and increased demand for minimally invasive procedures are being driven by companies like Siemens Healthineers, GE Healthcare, and Philips.
  • Government regulations supporting the development of high-precision diagnostic technologies and improvements in healthcare accessibility are fostering industrial growth.
  • The adoption of CT-guided biopsies, drainage, and ablation procedures is being accelerated by hospitals and outpatient centers.
  • With a robust healthcare infrastructure and a growing focus on patient-centric healthcare, the industry is expected to see steady growth, driven by technological innovation.

Opportunity Analysis for Germany CT Guided Intervention Market

The Germany CT guided intervention market is projected to grow at a CAGR of 5.4% through 2035.

  • Technological advancements in diagnostic imaging are being promoted by companies like Siemens Healthineers, Philips, and GE Healthcare.
  • Government policies supporting research in advanced imaging technologies and healthcare access are contributing to industrial growth.
  • The increasing demand for high-precision diagnostic tools and the growing preference for minimally invasive procedures are driving adoption.
  • Germany’s highly regulated healthcare system ensures the safe use of advanced technologies, further accelerating the adoption of CT-guided intervention systems across various medical specialties.

Demand Forecast for China CT Guided Intervention Market

The China CT guided intervention market is expected to grow at a CAGR of 8.2% through 2035.

  • The industry is being driven by rapid industrialization, increased healthcare awareness, and government initiatives to improve medical infrastructure.
  • Companies like Siemens Healthineers, GE Healthcare, and Mindray are investing in the development of advanced imaging technologies for CT-guided interventions.
  • The rising demand for precision diagnostics, particularly in oncology and cardiology, is accelerating the industrial expansion.
  • Government policies supporting the integration of AI and machine learning in medical diagnostics are further enhancing the adoption of CT-guided interventions in China.

Trend Analysis for Japan CT Guided Intervention Market

The Japan CT Guided Intervention Market is projected to grow at a CAGR of 4.2% through 2035.

  • Growth is supported by the country’s aging population and the increasing need for non-invasive diagnostic and therapeutic procedures.
  • Companies like Toshiba Medical Systems, Hitachi, and GE Healthcare are leading advancements in CT imaging technologies.
  • Japan is a highly developed healthcare system and regulatory policies ensuring the safety and efficacy of diagnostic technologies are contributing to industry growth.
  • The increasing adoption of CT-guided biopsies, drainage, and ablation procedures is being fueled by the country’s focus on early diagnosis and treatment precision.

India CT Guided Intervention Market Growth Analysis

The India CT Guided Intervention Market is expected to grow at a CAGR of 9.1% through 2035.

  • Growth is being driven by expanding healthcare infrastructure, government initiatives to promote medical technology, and the increasing prevalence of chronic diseases.
  • Leading companies such as GE Healthcare, Siemens Healthineers, and Philips are strengthening their industry presence with advanced CT technologies.
  • The rising demand for minimally invasive diagnostic procedures and the increasing adoption of AI-driven technologies are supporting industry expansion.
  • India’s growing middle class, increasing pet ownership, and improving healthcare access are further contributing to the industry's growth.

Leading Players in the CT Guided Intervention Market

The CT-guided intervention industry is led by prominent players such as GE HealthCare, Siemens Healthineers, and Philips Healthcare, which dominate the industry with their advanced CT imaging systems and interventional solutions. These companies offer AI-powered needle guidance systems and laser-assisted technologies, which significantly enhance the precision and efficiency of CT-guided procedures.

Other key players include Canon Medical Systems, Fujifilm Holdings Corporation, and NeuroLogica Corporation, which provide specialized CT imaging solutions for interventional applications. Emerging companies such as CurveBeam AI, Koning Health, and Shenzhen Anke High-Tech Co., Ltd. are innovating with advanced CT technologies to address specific industry needs and expand their industry presence.

Recent CT Guided Intervention Industry News

  • On December 1, 2024, Philips launched the CT 5300 scanner at the Radiological Society of North America (RSNA) conference, featuring AI-enabled "Precise" software solutions to enhance CT workflows.
  • On December 1, 2024, Siemens Healthineers expanded its photon-counting CT portfolio by introducing the Naeotom Alpha class, which includes a second dual-source scanner, Naeotom Alpha. Pro, and the world’s first single-source scanner with photon-counting technology, Naeotom Alpha.Prime.

Research Coverage and Scope Summary

Report Attributes Details
Market Size (2025) USD 1.1 billion
Projected Market Size (2035) USD 2.2 billion
CAGR (2025 to 2035) 7.4%
Base Year for Estimation 2024
Historical Period 2020 to 2024
Projections Period 2025 to 2035
Quantitative Units USD billion for value and Thousand units for volume
Product Types Analyzed (Segment 1) CT Navigation Systems, Needle Guidance Systems, Needle Positioning Systems, Fluoroscopy Systems, Hybrid CT Systems, Consumables
Applications Analyzed (Segment 2) Tumor Biopsy, Tumor Ablation, Percutaneous Drainage Procedures, Vertebroplasty/Kyphoplasty, Pain Management/Nerve Blocks, Interventional Oncology
End Users Analyzed (Segment 3) Hospitals, Ambulatory Surgical Centers (ASCs), Cancer Research Institutes, Academic & Research Institutes, Others
Regions Covered North America, Western Europe, East Asia, South Asia
Countries Covered United States, Canada, Germany, United Kingdom, France, Italy, Spain, China, India, Japan, South Korea, Australia, Brazil, Mexico, Argentina, Saudi Arabia, UAE, South Africa
Key Players Siemens Healthineers AG, CANON MEDICAL SYSTEMS USA, INC., Koninklijke Philips N.V., GE Healthcare, BVM Medical Limited, Hologic, Becton, Dickinson and Company, Cook Medical, Boston Scientific Corporation
Additional Attributes Dollar sales, share by product type and application, rising demand for tumor ablation systems, regional adoption of hybrid CT systems, growth in academic research institutes for interventional procedures

Key Players in the CT-Guided Intervention Market

  • Siemens Healthineers AG
  • CANON MEDICAL SYSTEMS USA, INC.
  • Koninklijke Philips N.V.
  • GE Healthcare
  • BVM Medical Limited
  • Hologic
  • Becton, Dickinson and Company
  • Cook Medical
  • Boston Scientific Corporation

CT Guided Intervention Market Analyzed by Key Investment Segments

By Product Type:

The industry is segmented into CT navigation systems, needle guidance systems, needle positioning systems, fluoroscopy systems, hybrid CT systems, and consumables.

By Application:

The industry includes tumor biopsy, tumor ablation, percutaneous drainage procedures, vertebroplasty/kyphoplasty, pain management/nerve blocks, and interventional oncology.

By End User:

The industry is categorized into hospitals, ambulatory surgical centers (ASCs), cancer research institutes, academic & research institutes, and others.

By Region:

The industry spans North America, Western Europe, East Asia, and South Asia.

Table of Content

  1. Executive Summary
    • Global Market Outlook
    • Demand-side Trends
    • Supply-side Trends
    • Technology Roadmap Analysis
    • Analysis and Recommendations
  2. Market Overview
    • Market Coverage / Taxonomy
    • Market Definition / Scope / Limitations
  3. Market Background
    • Market Dynamics
      • Drivers
      • Restraints
      • Opportunity
      • Trends
    • Scenario Forecast
      • Demand in Optimistic Scenario
      • Demand in Likely Scenario
      • Demand in Conservative Scenario
    • Opportunity Map Analysis
    • Product Life Cycle Analysis
    • Supply Chain Analysis
      • Supply Side Participants and their Roles
        • Producers
        • Mid-Level Participants (Traders/ Agents/ Brokers)
        • Wholesalers and Distributors
      • Value Added and Value Created at Node in the Supply Chain
      • List of Raw Material Suppliers
      • List of Existing and Potential Buyer’s
    • Investment Feasibility Matrix
    • Value Chain Analysis
      • Profit Margin Analysis
      • Wholesalers and Distributors
      • Retailers
    • PESTLE and Porter’s Analysis
    • Regulatory Landscape
      • By Key Regions
      • By Key Countries
    • Regional Parent Market Outlook
    • Production and Consumption Statistics
    • Import and Export Statistics
  4. Global Market Analysis 2020 to 2024 and Forecast, 2025 to 2035
    • Historical Market Size Value (USD Billion) & Volume (Thousand Unit) Analysis, 2020 to 2024
    • Current and Future Market Size Value (USD Billion) & Volume (Thousand Unit) Projections, 2025 to 2035
      • Y-o-Y Growth Trend Analysis
      • Absolute $ Opportunity Analysis
  5. Global Market Pricing Analysis 2020 to 2024 and Forecast 2025 to 2035
  6. Global Market Analysis 2020 to 2024 and Forecast 2025 to 2035, By Product Type
    • Introduction / Key Findings
    • Historical Market Size Value (USD Billion) & Volume (Thousand Unit) Analysis By Product Type, 2020 to 2024
    • Current and Future Market Size Value (USD Billion) & Volume (Thousand Unit) Analysis and Forecast By Product Type, 2025 to 2035
      • CT Navigation Systems
      • Needle Guidance System
      • Needle Positioning System
      • Fluoroscopy Systems
      • Hybrid CT Systems
      • Consumables
    • Y-o-Y Growth Trend Analysis By Product Type, 2020 to 2024
    • Absolute $ Opportunity Analysis By Product Type, 2025 to 2035
  7. Global Market Analysis 2020 to 2024 and Forecast 2025 to 2035, By Application
    • Introduction / Key Findings
    • Historical Market Size Value (USD Billion) & Volume (Thousand Unit) Analysis By Application, 2020 to 2024
    • Current and Future Market Size Value (USD Billion) & Volume (Thousand Unit) Analysis and Forecast By Application, 2025 to 2035
      • Tumor Biopsy
      • Tumor Ablation
      • Percutaneous Drainage Procedures
      • Vertebroplasty/Kyphoplasty
      • Pain Management/Nerve Blocks
      • Interventional Oncology
    • Y-o-Y Growth Trend Analysis By Application, 2020 to 2024
    • Absolute $ Opportunity Analysis By Application, 2025 to 2035
  8. Global Market Analysis 2020 to 2024 and Forecast 2025 to 2035, By End User
    • Introduction / Key Findings
    • Historical Market Size Value (USD Billion) & Volume (Thousand Unit) Analysis By End User, 2020 to 2024
    • Current and Future Market Size Value (USD Billion) & Volume (Thousand Unit) Analysis and Forecast By End User, 2025 to 2035
      • Hospitals
      • Ambulatory Surgical Centers (ASCs)
      • Cancer Research Institutes
      • Academic & Research Institutes
      • Energy & Power
      • Others
    • Y-o-Y Growth Trend Analysis By End User, 2020 to 2024
    • Absolute $ Opportunity Analysis By End User, 2025 to 2035
  9. Global Market Analysis 2020 to 2024 and Forecast 2025 to 2035, By Region
    • Introduction
    • Historical Market Size Value (USD Billion) & Volume (Thousand Unit) Analysis By Region, 2020 to 2024
    • Current Market Size Value (USD Billion) & Volume (Thousand Unit) Analysis and Forecast By Region, 2025 to 2035
      • North America
      • Latin America
      • Western Europe
      • Eastern Europe
      • East Asia
      • South Asia & Pacific
      • Middle East and Africa
    • Market Attractiveness Analysis By Region
  10. North America Market Analysis 2020 to 2024 and Forecast 2025 to 2035, By Country
    • Historical Market Size Value (USD Billion) & Volume (Thousand Unit) Trend Analysis By Market Taxonomy, 2020 to 2024
    • Market Size Value (USD Billion) & Volume (Thousand Unit) Forecast By Market Taxonomy, 2025 to 2035
      • By Country
        • USA
        • Canada
        • Mexico
      • By Product Type
      • By Application
      • By End User
    • Market Attractiveness Analysis
      • By Country
      • By Product Type
      • By Application
      • By End User
    • Key Takeaways
  11. Latin America Market Analysis 2020 to 2024 and Forecast 2025 to 2035, By Country
    • Historical Market Size Value (USD Billion) & Volume (Thousand Unit) Trend Analysis By Market Taxonomy, 2020 to 2024
    • Market Size Value (USD Billion) & Volume (Thousand Unit) Forecast By Market Taxonomy, 2025 to 2035
      • By Country
        • Brazil
        • Argentina
        • Rest of LATAM
      • By Product Type
      • By Application
      • By End User
    • Market Attractiveness Analysis
      • By Country
      • By Product Type
      • By Application
      • By End User
    • Key Takeaways
  12. Western Europe Market Analysis 2020 to 2024 and Forecast 2025 to 2035, By Country
    • Historical Market Size Value (USD Billion) & Volume (Thousand Unit) Trend Analysis By Market Taxonomy, 2020 to 2024
    • Market Size Value (USD Billion) & Volume (Thousand Unit) Forecast By Market Taxonomy, 2025 to 2035
      • By Country
        • Germany
        • Italy
        • France
        • UK
        • Spain
        • BENELUX
        • Nordic
        • Rest of W.Europe
      • By Product Type
      • By Application
      • By End User
    • Market Attractiveness Analysis
      • By Country
      • By Product Type
      • By Application
      • By End User
    • Key Takeaways
  13. Eastern Europe Market Analysis 2020 to 2024 and Forecast 2025 to 2035, By Country
    • Historical Market Size Value (USD Billion) & Volume (Thousand Unit) Trend Analysis By Market Taxonomy, 2020 to 2024
    • Market Size Value (USD Billion) & Volume (Thousand Unit) Forecast By Market Taxonomy, 2025 to 2035
      • By Country
        • Russia
        • Hungary
        • Poland
        • Balkan & Baltics
        • Rest of E. Europe
      • By Product Type
      • By Application
      • By End User
    • Market Attractiveness Analysis
      • By Country
      • By Product Type
      • By Application
      • By End User
    • Key Takeaways
  14. East Asia Market Analysis 2020 to 2024 and Forecast 2025 to 2035, By Country
    • Historical Market Size Value (USD Billion) & Volume (Thousand Unit) Trend Analysis By Market Taxonomy, 2020 to 2024
    • Market Size Value (USD Billion) & Volume (Thousand Unit) Forecast By Market Taxonomy, 2025 to 2035
      • By Country
        • China
        • Japan
        • South Korea
      • By Product Type
      • By Application
      • By End User
    • Market Attractiveness Analysis
      • By Country
      • By Product Type
      • By Application
      • By End User
    • Key Takeaways
  15. South Asia & Pacific Market Analysis 2020 to 2024 and Forecast 2025 to 2035, By Country
    • Historical Market Size Value (USD Billion) & Volume (Thousand Unit) Trend Analysis By Market Taxonomy, 2020 to 2024
    • Market Size Value (USD Billion) & Volume (Thousand Unit) Forecast By Market Taxonomy, 2025 to 2035
      • By Country
        • India
        • Australia & New Zealand
        • ASEAN
        • Rest of SAP
      • By Product Type
      • By Application
      • By End User
    • Market Attractiveness Analysis
      • By Country
      • By Product Type
      • By Application
      • By End User
    • Key Takeaways
  16. Middle East and Africa Market Analysis 2020 to 2024 and Forecast 2025 to 2035, By Country
    • Historical Market Size Value (USD Billion) & Volume (Thousand Unit) Trend Analysis By Market Taxonomy, 2020 to 2024
    • Market Size Value (USD Billion) & Volume (Thousand Unit) Forecast By Market Taxonomy, 2025 to 2035
      • By Country
        • GCC Countries
        • Northern Africa
        • South Africa
        • Turkiye
        • Rest of MEA
      • By Product Type
      • By Application
      • By End User
    • Market Attractiveness Analysis
      • By Country
      • By Product Type
      • By Application
      • By End User
    • Key Takeaways
  17. Key Countries Market Analysis
    • USA
      • Pricing Analysis
      • Market Share Analysis, 2024
        • By Product Type
        • By Application
        • By End User
    • Canada
      • Pricing Analysis
      • Market Share Analysis, 2024
        • By Product Type
        • By Application
        • By End User
    • Brazil
      • Pricing Analysis
      • Market Share Analysis, 2024
        • By Product Type
        • By Application
        • By End User
    • Mexico
      • Pricing Analysis
      • Market Share Analysis, 2024
        • By Product Type
        • By Application
        • By End User
    • Argentina
      • Pricing Analysis
      • Market Share Analysis, 2024
        • By Product Type
        • By Application
        • By End User
  18. Market Structure Analysis
    • Competition Dashboard
    • Competition Benchmarking
    • Market Share Analysis of Top Players
      • By Regional
      • By Product Type
      • By Application
      • By End User
  19. Competition Analysis
    • Competition Deep Dive
      • Siemens Healthineers AG
        • Overview
        • Product Portfolio
        • Profitability by Market Segments (Product/Age /Sales Channel/Region)
        • Sales Footprint
        • Strategy Overview
          • Marketing Strategy
          • Product Strategy
          • Channel Strategy
      • CANON MEDICAL SYSTEMS USA, INC.
        • Overview
        • Product Portfolio
        • Profitability by Market Segments (Product/Age /Sales Channel/Region)
        • Sales Footprint
        • Strategy Overview
          • Marketing Strategy
          • Product Strategy
          • Channel Strategy
      • Koninklijke Philips N.V
        • Overview
        • Product Portfolio
        • Profitability by Market Segments (Product/Age /Sales Channel/Region)
        • Sales Footprint
        • Strategy Overview
          • Marketing Strategy
          • Product Strategy
          • Channel Strategy
      • BVM Medical Limited
        • Overview
        • Product Portfolio
        • Profitability by Market Segments (Product/Age /Sales Channel/Region)
        • Sales Footprint
        • Strategy Overview
          • Marketing Strategy
          • Product Strategy
          • Channel Strategy
      • Ge Healthcare
        • Overview
        • Product Portfolio
        • Profitability by Market Segments (Product/Age /Sales Channel/Region)
        • Sales Footprint
        • Strategy Overview
          • Marketing Strategy
          • Product Strategy
          • Channel Strategy
      • Hologic
        • Overview
        • Product Portfolio
        • Profitability by Market Segments (Product/Age /Sales Channel/Region)
        • Sales Footprint
        • Strategy Overview
          • Marketing Strategy
          • Product Strategy
          • Channel Strategy
      • Becton, Dickinson and Company
        • Overview
        • Product Portfolio
        • Profitability by Market Segments (Product/Age /Sales Channel/Region)
        • Sales Footprint
        • Strategy Overview
          • Marketing Strategy
          • Product Strategy
          • Channel Strategy
      • Cook Medical
        • Overview
        • Product Portfolio
        • Profitability by Market Segments (Product/Age /Sales Channel/Region)
        • Sales Footprint
        • Strategy Overview
          • Marketing Strategy
          • Product Strategy
          • Channel Strategy
      • Boston Scientific Corporation
        • Overview
        • Product Portfolio
        • Profitability by Market Segments (Product/Age /Sales Channel/Region)
        • Sales Footprint
        • Strategy Overview
          • Marketing Strategy
          • Product Strategy
          • Channel Strategy
  20. Assumptions & Acronyms Used
  21. Research Methodology

List of Tables

  • Table 1: Global Market Value (USD Billion) Forecast by Region, 2020 to 2035
  • Table 2: Global Market Volume (Thousand Unit) Forecast by Region, 2020 to 2035
  • Table 3: Global Market Value (USD Billion) Forecast by Product Type, 2020 to 2035
  • Table 4: Global Market Volume (Thousand Unit) Forecast by Product Type, 2020 to 2035
  • Table 5: Global Market Value (USD Billion) Forecast by Application, 2020 to 2035
  • Table 6: Global Market Volume (Thousand Unit) Forecast by Application, 2020 to 2035
  • Table 7: Global Market Value (USD Billion) Forecast by End User, 2020 to 2035
  • Table 8: Global Market Volume (Thousand Unit) Forecast by End User, 2020 to 2035
  • Table 9: North America Market Value (USD Billion) Forecast by Country, 2020 to 2035
  • Table 10: North America Market Volume (Thousand Unit) Forecast by Country, 2020 to 2035
  • Table 11: North America Market Value (USD Billion) Forecast by Product Type, 2020 to 2035
  • Table 12: North America Market Volume (Thousand Unit) Forecast by Product Type, 2020 to 2035
  • Table 13: North America Market Value (USD Billion) Forecast by Application, 2020 to 2035
  • Table 14: North America Market Volume (Thousand Unit) Forecast by Application, 2020 to 2035
  • Table 15: North America Market Value (USD Billion) Forecast by End User, 2020 to 2035
  • Table 16: North America Market Volume (Thousand Unit) Forecast by End User, 2020 to 2035
  • Table 17: Latin America Market Value (USD Billion) Forecast by Country, 2020 to 2035
  • Table 18: Latin America Market Volume (Thousand Unit) Forecast by Country, 2020 to 2035
  • Table 19: Latin America Market Value (USD Billion) Forecast by Product Type, 2020 to 2035
  • Table 20: Latin America Market Volume (Thousand Unit) Forecast by Product Type, 2020 to 2035
  • Table 21: Latin America Market Value (USD Billion) Forecast by Application, 2020 to 2035
  • Table 22: Latin America Market Volume (Thousand Unit) Forecast by Application, 2020 to 2035
  • Table 23: Latin America Market Value (USD Billion) Forecast by End User, 2020 to 2035
  • Table 24: Latin America Market Volume (Thousand Unit) Forecast by End User, 2020 to 2035
  • Table 25: Western Europe Market Value (USD Billion) Forecast by Country, 2020 to 2035
  • Table 26: Western Europe Market Volume (Thousand Unit) Forecast by Country, 2020 to 2035
  • Table 27: Western Europe Market Value (USD Billion) Forecast by Product Type, 2020 to 2035
  • Table 28: Western Europe Market Volume (Thousand Unit) Forecast by Product Type, 2020 to 2035
  • Table 29: Western Europe Market Value (USD Billion) Forecast by Application, 2020 to 2035
  • Table 30: Western Europe Market Volume (Thousand Unit) Forecast by Application, 2020 to 2035
  • Table 31: Western Europe Market Value (USD Billion) Forecast by End User, 2020 to 2035
  • Table 32: Western Europe Market Volume (Thousand Unit) Forecast by End User, 2020 to 2035
  • Table 33: Eastern Europe Market Value (USD Billion) Forecast by Country, 2020 to 2035
  • Table 34: Eastern Europe Market Volume (Thousand Unit) Forecast by Country, 2020 to 2035
  • Table 35: Eastern Europe Market Value (USD Billion) Forecast by Product Type, 2020 to 2035
  • Table 36: Eastern Europe Market Volume (Thousand Unit) Forecast by Product Type, 2020 to 2035
  • Table 37: Eastern Europe Market Value (USD Billion) Forecast by Application, 2020 to 2035
  • Table 38: Eastern Europe Market Volume (Thousand Unit) Forecast by Application, 2020 to 2035
  • Table 39: Eastern Europe Market Value (USD Billion) Forecast by End User, 2020 to 2035
  • Table 40: Eastern Europe Market Volume (Thousand Unit) Forecast by End User, 2020 to 2035
  • Table 41: East Asia Market Value (USD Billion) Forecast by Country, 2020 to 2035
  • Table 42: East Asia Market Volume (Thousand Unit) Forecast by Country, 2020 to 2035
  • Table 43: East Asia Market Value (USD Billion) Forecast by Product Type, 2020 to 2035
  • Table 44: East Asia Market Volume (Thousand Unit) Forecast by Product Type, 2020 to 2035
  • Table 45: East Asia Market Value (USD Billion) Forecast by Application, 2020 to 2035
  • Table 46: East Asia Market Volume (Thousand Unit) Forecast by Application, 2020 to 2035
  • Table 47: East Asia Market Value (USD Billion) Forecast by End User, 2020 to 2035
  • Table 48: East Asia Market Volume (Thousand Unit) Forecast by End User, 2020 to 2035
  • Table 49: South Asia & Pacific Market Value (USD Billion) Forecast by Country, 2020 to 2035
  • Table 50: South Asia & Pacific Market Volume (Thousand Unit) Forecast by Country, 2020 to 2035
  • Table 51: South Asia & Pacific Market Value (USD Billion) Forecast by Product Type, 2020 to 2035
  • Table 52: South Asia & Pacific Market Volume (Thousand Unit) Forecast by Product Type, 2020 to 2035
  • Table 53: South Asia & Pacific Market Value (USD Billion) Forecast by Application, 2020 to 2035
  • Table 54: South Asia & Pacific Market Volume (Thousand Unit) Forecast by Application, 2020 to 2035
  • Table 55: South Asia & Pacific Market Value (USD Billion) Forecast by End User, 2020 to 2035
  • Table 56: South Asia & Pacific Market Volume (Thousand Unit) Forecast by End User, 2020 to 2035
  • Table 57: Middle East and Africa Market Value (USD Billion) Forecast by Country, 2020 to 2035
  • Table 58: Middle East and Africa Market Volume (Thousand Unit) Forecast by Country, 2020 to 2035
  • Table 59: Middle East and Africa Market Value (USD Billion) Forecast by Product Type, 2020 to 2035
  • Table 60: Middle East and Africa Market Volume (Thousand Unit) Forecast by Product Type, 2020 to 2035
  • Table 61: Middle East and Africa Market Value (USD Billion) Forecast by Application, 2020 to 2035
  • Table 62: Middle East and Africa Market Volume (Thousand Unit) Forecast by Application, 2020 to 2035
  • Table 63: Middle East and Africa Market Value (USD Billion) Forecast by End User, 2020 to 2035
  • Table 64: Middle East and Africa Market Volume (Thousand Unit) Forecast by End User, 2020 to 2035

List of Figures

  • Figure 1: Global Market Volume (Thousand Unit) Forecast 2020 to 2035
  • Figure 2: Global Market Pricing Analysis
  • Figure 3: Global Market Value (USD Billion) Forecast 2020 to 2035
  • Figure 4: Global Market Value Share and BPS Analysis by Product Type, 2025 and 2035
  • Figure 5: Global Market Y-o-Y Growth Comparison by Product Type, 2025 to 2035
  • Figure 6: Global Market Attractiveness Analysis by Product Type
  • Figure 7: Global Market Value Share and BPS Analysis by Application, 2025 and 2035
  • Figure 8: Global Market Y-o-Y Growth Comparison by Application, 2025 to 2035
  • Figure 9: Global Market Attractiveness Analysis by Application
  • Figure 10: Global Market Value Share and BPS Analysis by End User, 2025 and 2035
  • Figure 11: Global Market Y-o-Y Growth Comparison by End User, 2025 to 2035
  • Figure 12: Global Market Attractiveness Analysis by End User
  • Figure 13: Global Market Value (USD Billion) Share and BPS Analysis by Region, 2025 and 2035
  • Figure 14: Global Market Y-o-Y Growth Comparison by Region, 2025 to 2035
  • Figure 15: Global Market Attractiveness Analysis by Region
  • Figure 16: North America Market Incremental $ Opportunity, 2025 to 2035
  • Figure 17: Latin America Market Incremental $ Opportunity, 2025 to 2035
  • Figure 18: Western Europe Market Incremental $ Opportunity, 2025 to 2035
  • Figure 19: Eastern Europe Market Incremental $ Opportunity, 2025 to 2035
  • Figure 20: East Asia Market Incremental $ Opportunity, 2025 to 2035
  • Figure 21: South Asia & Pacific Market Incremental $ Opportunity, 2025 to 2035
  • Figure 22: Middle East and Africa Market Incremental $ Opportunity, 2025 to 2035
  • Figure 23: North America Market Value Share and BPS Analysis by Country, 2025 and 2035
  • Figure 24: North America Market Value Share and BPS Analysis by Product Type, 2025 and 2035
  • Figure 25: North America Market Y-o-Y Growth Comparison by Product Type, 2025 to 2035
  • Figure 26: North America Market Attractiveness Analysis by Product Type
  • Figure 27: North America Market Value Share and BPS Analysis by Application, 2025 and 2035
  • Figure 28: North America Market Y-o-Y Growth Comparison by Application, 2025 to 2035
  • Figure 29: North America Market Attractiveness Analysis by Application
  • Figure 30: North America Market Value Share and BPS Analysis by End User, 2025 and 2035
  • Figure 31: North America Market Y-o-Y Growth Comparison by End User, 2025 to 2035
  • Figure 32: North America Market Attractiveness Analysis by End User
  • Figure 33: Latin America Market Value Share and BPS Analysis by Country, 2025 and 2035
  • Figure 34: Latin America Market Value Share and BPS Analysis by Product Type, 2025 and 2035
  • Figure 35: Latin America Market Y-o-Y Growth Comparison by Product Type, 2025 to 2035
  • Figure 36: Latin America Market Attractiveness Analysis by Product Type
  • Figure 37: Latin America Market Value Share and BPS Analysis by Application, 2025 and 2035
  • Figure 38: Latin America Market Y-o-Y Growth Comparison by Application, 2025 to 2035
  • Figure 39: Latin America Market Attractiveness Analysis by Application
  • Figure 40: Latin America Market Value Share and BPS Analysis by End User, 2025 and 2035
  • Figure 41: Latin America Market Y-o-Y Growth Comparison by End User, 2025 to 2035
  • Figure 42: Latin America Market Attractiveness Analysis by End User
  • Figure 43: Western Europe Market Value Share and BPS Analysis by Country, 2025 and 2035
  • Figure 44: Western Europe Market Value Share and BPS Analysis by Product Type, 2025 and 2035
  • Figure 45: Western Europe Market Y-o-Y Growth Comparison by Product Type, 2025 to 2035
  • Figure 46: Western Europe Market Attractiveness Analysis by Product Type
  • Figure 47: Western Europe Market Value Share and BPS Analysis by Application, 2025 and 2035
  • Figure 48: Western Europe Market Y-o-Y Growth Comparison by Application, 2025 to 2035
  • Figure 49: Western Europe Market Attractiveness Analysis by Application
  • Figure 50: Western Europe Market Value Share and BPS Analysis by End User, 2025 and 2035
  • Figure 51: Western Europe Market Y-o-Y Growth Comparison by End User, 2025 to 2035
  • Figure 52: Western Europe Market Attractiveness Analysis by End User
  • Figure 53: Eastern Europe Market Value Share and BPS Analysis by Country, 2025 and 2035
  • Figure 54: Eastern Europe Market Value Share and BPS Analysis by Product Type, 2025 and 2035
  • Figure 55: Eastern Europe Market Y-o-Y Growth Comparison by Product Type, 2025 to 2035
  • Figure 56: Eastern Europe Market Attractiveness Analysis by Product Type
  • Figure 57: Eastern Europe Market Value Share and BPS Analysis by Application, 2025 and 2035
  • Figure 58: Eastern Europe Market Y-o-Y Growth Comparison by Application, 2025 to 2035
  • Figure 59: Eastern Europe Market Attractiveness Analysis by Application
  • Figure 60: Eastern Europe Market Value Share and BPS Analysis by End User, 2025 and 2035
  • Figure 61: Eastern Europe Market Y-o-Y Growth Comparison by End User, 2025 to 2035
  • Figure 62: Eastern Europe Market Attractiveness Analysis by End User
  • Figure 63: East Asia Market Value Share and BPS Analysis by Country, 2025 and 2035
  • Figure 64: East Asia Market Value Share and BPS Analysis by Product Type, 2025 and 2035
  • Figure 65: East Asia Market Y-o-Y Growth Comparison by Product Type, 2025 to 2035
  • Figure 66: East Asia Market Attractiveness Analysis by Product Type
  • Figure 67: East Asia Market Value Share and BPS Analysis by Application, 2025 and 2035
  • Figure 68: East Asia Market Y-o-Y Growth Comparison by Application, 2025 to 2035
  • Figure 69: East Asia Market Attractiveness Analysis by Application
  • Figure 70: East Asia Market Value Share and BPS Analysis by End User, 2025 and 2035
  • Figure 71: East Asia Market Y-o-Y Growth Comparison by End User, 2025 to 2035
  • Figure 72: East Asia Market Attractiveness Analysis by End User
  • Figure 73: South Asia & Pacific Market Value Share and BPS Analysis by Country, 2025 and 2035
  • Figure 74: South Asia & Pacific Market Value Share and BPS Analysis by Product Type, 2025 and 2035
  • Figure 75: South Asia & Pacific Market Y-o-Y Growth Comparison by Product Type, 2025 to 2035
  • Figure 76: South Asia & Pacific Market Attractiveness Analysis by Product Type
  • Figure 77: South Asia & Pacific Market Value Share and BPS Analysis by Application, 2025 and 2035
  • Figure 78: South Asia & Pacific Market Y-o-Y Growth Comparison by Application, 2025 to 2035
  • Figure 79: South Asia & Pacific Market Attractiveness Analysis by Application
  • Figure 80: South Asia & Pacific Market Value Share and BPS Analysis by End User, 2025 and 2035
  • Figure 81: South Asia & Pacific Market Y-o-Y Growth Comparison by End User, 2025 to 2035
  • Figure 82: South Asia & Pacific Market Attractiveness Analysis by End User
  • Figure 83: Middle East and Africa Market Value Share and BPS Analysis by Country, 2025 and 2035
  • Figure 84: Middle East and Africa Market Value Share and BPS Analysis by Product Type, 2025 and 2035
  • Figure 85: Middle East and Africa Market Y-o-Y Growth Comparison by Product Type, 2025 to 2035
  • Figure 86: Middle East and Africa Market Attractiveness Analysis by Product Type
  • Figure 87: Middle East and Africa Market Value Share and BPS Analysis by Application, 2025 and 2035
  • Figure 88: Middle East and Africa Market Y-o-Y Growth Comparison by Application, 2025 to 2035
  • Figure 89: Middle East and Africa Market Attractiveness Analysis by Application
  • Figure 90: Middle East and Africa Market Value Share and BPS Analysis by End User, 2025 and 2035
  • Figure 91: Middle East and Africa Market Y-o-Y Growth Comparison by End User, 2025 to 2035
  • Figure 92: Middle East and Africa Market Attractiveness Analysis by End User
  • Figure 93: Global Market - Tier Structure Analysis
  • Figure 94: Global Market - Company Share Analysis

Frequently Asked Questions

What is the projected size of the CT-guided intervention industry by 2035?

It is expected to reach USD 2.2 billion by 2035.

What is the estimated size of the CT-guided intervention industry in 2025?

It is projected to be USD 1.1 billion in 2025.

What is the CAGR of the CT-guided intervention industry from 2025 to 2035?

The industry is expected to grow at a CAGR of 7.4% from 2025 to 2035.

What is the industry share of CT navigation systems in 2025?

CT navigation systems are projected to hold a 22.6% share in 2025.

What percentage of the CT-guided intervention industry is attributed to tumor biopsy applications in 2025?

Tumor biopsy applications are expected to account for 32.1% in 2025.

Explore Diagnostic Devices Insights

Future Market Insights

CT Guided Intervention Market