Ectoin-Infused Skincare Market Size and Share Forecast Outlook 2025 to 2035

A total valuation of USD 105.0 million has been forecasted for the global Ectoin-infused skincare market by 2025, with expectations that the figure will reach USD 185.9 million by 2035. This trajectory reflects a 5.9% compound annual growth rate (CAGR), fueled by rising demand for skin-barrier protection, microbiome-safe actives, and clinically validated ingredients.
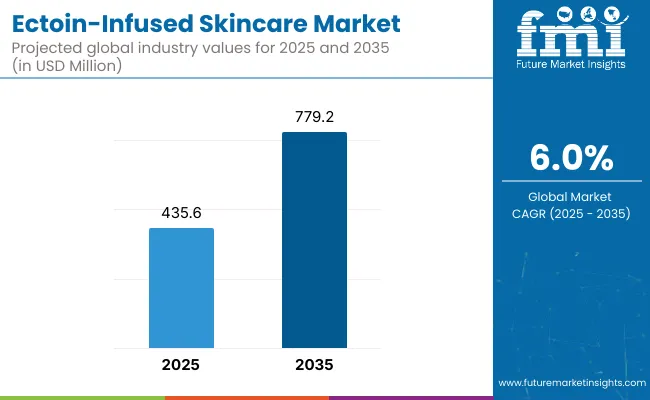
Quick Stats for Ectoin-Infused Skincare Market

  • Ectoin-Infused Skincare Market Value (2025): USD 435.6 million
  • Ectoin-Infused Skincare Market Forecast Value (2035): USD 779.2 million
  • Ectoin-Infused Skincare Market Forecast CAGR (2025 to 2035): 6.0%
  • Leading Segment in 2025: Face Creams & Moisturizers (20%) and Body Lotions & Creams (20%)
  • Key Growth Regions: Asia-Pacific, North America, Europe
  • Top Key Players: Symrise AG, Bloomage Biotech, Dr. Spiller, Babor, Mibelle Biochemistry, Dermasence, Annemarie Börlind, Biodroga, Charlotte Meentzen, Eucerin (Beiersdorf), NorevaLaboratoires

Ectoin Infused Skincare Market

Ectoin-Infused Skincare Market Key Takeaways

Metric Value
Estimated Value in (2025E) USD 435.6 million
Forecast Value in (2035F) USD 779.2 million
Forecast CAGR (2025 to 2035) 6.0%

The decade-long expansion represents an absolute growth of USD 80.9 million, signaling a structural shift toward biotech-infused skincare innovation. The increasing alignment of Ectoin formulations with clean beauty, anti-pollution defense, and cellular protection trends has been observed to intensify adoption across both mass-market and dermocosmetic channels.

The first five-year phase from 2025 to 2030 has been projected to record a rise from USD 105.0 million to USD 141.0 million, reflecting an incremental addition of USD 36.0 million equivalent to 44.5% of the decade’s total market expansion. This period is expected to be defined by early-stage brand integrations, dermatologist-endorsed rollouts, and performance-based positioning in moisturizers, serums, and anti-aging segments. Strong traction has been anticipated in North America and Europe, supported by ingredient transparency and microbiome research maturity.

The second half of the forecast period from 2030 to 2035 has been forecasted to add another USD 44.9 million, or 55.5% of the total decade growth, as adoption scales further through East Asia and South Asia & Pacific. Accelerated penetration is likely to be driven by cosmeceutical branding, digital-first product discovery, and the widening influence of biotech-based skincare narratives. By 2035, serums and ampoules are expected to dominate, backed by consumer preference for concentrated, multifunctional formats with visible efficacy.

From 2020 to 2024, the Ectoin-Infused Skincare Market expanded steadily due to rising formulation demand in hydration, anti-aging, and barrier-repair applications. Clinical backing and safety validation enabled strong product integration across pharmacy and derma-cosmetic channels. During this period, European manufacturers with cosmeceutical expertise dominated with over 45% of market value, while Asian ingredient suppliers led raw material supply.

By 2025, global demand is expected to reach USD 435.6 million, with a visible shift in revenue concentration toward microbiome-friendly, evidence-based formulations. The market is being redefined not just by product efficacy, but by regulatory trust, ingredient transparency, and sustainability narratives.

Traditional derma brands are now facing increasing competition from biotech-led clean beauty innovators offering multi-functional, minimal-ingredient solutions with strong digital outreach. Value creation is being driven by ecosystem strength, including dermatologist partnerships, clinical trial data, and subscription-based skincare platforms. As ingredient authenticity and skin compatibility become non-negotiable, the competitive edge is moving from marketing claims to science-backed credibility and consumer trust.

Why the Ectoin-Infused Skincare Market is growing?

Growth in the Ectoin-infused skincare market has been strongly supported by rising consumer awareness of skin barrier health, environmental stressors, and anti-aging efficacy. Ectoin’s unique role as a natural extremolyte has been increasingly recognized for its ability to stabilize cell membranes, reduce inflammation, and offer long-lasting hydration traits that have aligned well with the evolving demand for microbiome-friendly and dermatologically safe products. This has led to its integration into premium skincare formats, especially serums, moisturizers, and eye treatments.

The expansion of dermo-cosmetic formulations and physician-recommended skincare routines has also been observed to create new growth pathways. In parallel, clean-label positioning and minimal-ingredient trends have favored Ectoin due to its well-documented safety and multifunctionality.

Additionally, product innovation by niche biotechnology firms and major skincare brands has continued to diversify applications across both facial and body care segments. As urban pollution and blue light exposure intensify, the protective function of Ectoin-based skincare is projected to gain mainstream consumer traction.

Segmental Analysis

The Ectoin-infused skincare market has been segmented based on Product Type, Functionality, and Formulation Type each revealing distinctive consumer behaviors, efficacy preferences, and brand positioning strategies. Product type segmentation captures diverse topical delivery systems such as serums, creams, gels, and lotions, all tailored to specific application needs, skin conditions, and age groups.

Functionality segmentation highlights the primary benefits sought by consumers ranging from anti-aging and hydration to environmental defense and calming effects showcasing the breadth of Ectoin's biological activity. Meanwhile, formulation type segmentation addresses the texture, delivery, and consumer sensory experience preferences, impacting product absorption, layering compatibility, and application convenience. Together, these three pillars help map the strategic direction of the market and inform how Ectoin’s dermatological performance is being tailored across consumer segments, skin types, and environmental contexts.
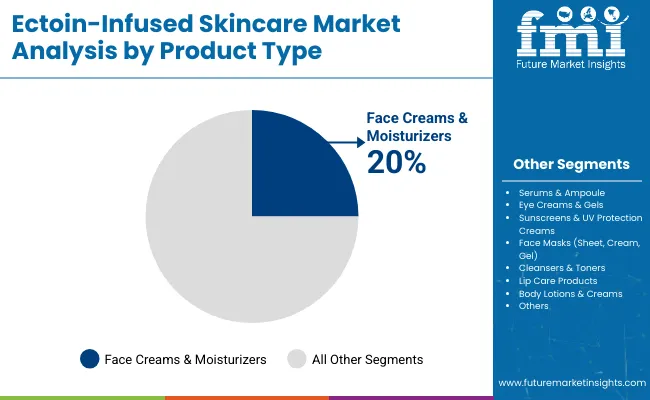
Insights into the Product Type Segment with Creams & Body Lotions Leading

Ectoin Infused Skincare Market By Product

Product Type 2025 Share %
Face Creams & Moisturizers 20%
Serums & Ampoules 15%
Eye Creams & Gels 8%
Sunscreens & UV Protection Creams 10%
Face Masks (Sheet, Cream, Gel) 10%
Cleansers & Toners 12%
Lip Care Products 5%
Body Lotions & Creams 20%

In 2025, face creams and moisturizers, along with body lotions and creams, are anticipated to collectively lead the product type segment with a combined market share of 40%. This dominance has been driven by their familiarity among consumers, ease of integration into daily skincare routines, and broad dermatological applicability.

Ectoin’s water-binding, anti-inflammatory, and anti-aging properties have been effectively harnessed in these emollient-rich formulations, which offer both preventive and reparative skincare benefits. Increased demand for barrier-strengthening products in polluted and urban environments has further reinforced the appeal of creams and lotions.

While creams have been preferred for facial hydration and overnight repair, body lotions have increasingly gained traction for full-body moisturization, particularly in regions with arid climates. As multifunctional products continue to gain favor, these formats are expected to remain foundational in the Ectoin-based skincare segment throughout the forecast period.
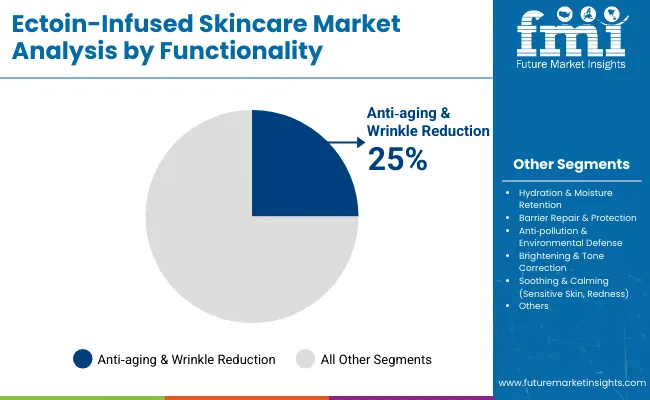
Insights into the Functionality Segment with Anti-Aging & Hydration Leading

Ectoin Infused Skincare Market By Functionality

Functionality 2025 Share %
Anti aging & Wrinkle Reduction 25%
Hydration & Moisture Retention 20%
Barrier Repair & Protection 15%
Anti pollution & Environmental Defense 10%
Brightening & Tone Correction 15%
Soothing & Calming (Sensitive Skin, Redness) 15%

The anti-aging and wrinkle reduction segment is forecasted to hold the largest share at 25% in 2025, followed by hydration and moisture retention at 20%. The market’s growth has been accelerated by the rising demand for preventive skincare and bioactive ingredients that mitigate visible signs of aging.

Ectoin has emerged as a preferred compound due to its ability to reduce oxidative stress, protect against UV-induced damage, and improve skin elasticity. Simultaneously, hydration-related formulations have gained traction, driven by consumer awareness around skin barrier health, particularly in response to environmental stress and frequent cleansing routines.

With Ectoin’s proven humectant and anti-inflammatory properties, hydration-focused products have been positioned as everyday essentials for sensitive and dry skin types. These functionality segments are likely to retain leadership due to their wide appeal across demographics and geographies, especially as aging populations and pollution-related skin concerns continue to rise.
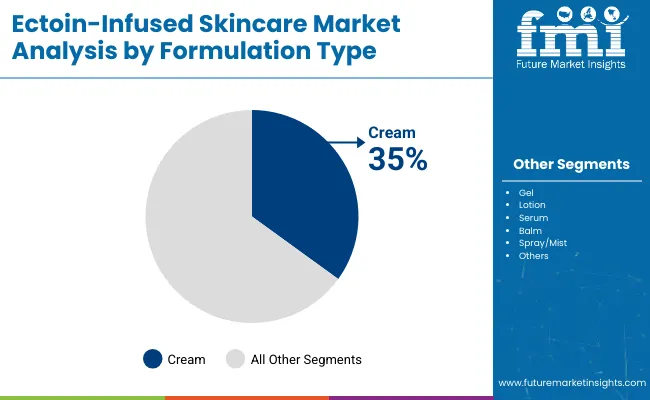
Insights into the Formulation Type Segment with Creams Leading

Ectoin Infused Skincare Market By Formulation

Formulation Type 2025 Share %
Cream 35%
Gel 15%
Lotion 20%
Serum 15%
Balm 8%
Spray/Mist 7%

Creams are projected to dominate the formulation type segment with a 35% share in 2025, maintaining their role as the most preferred vehicle for Ectoin delivery. Their thick, occlusive nature has enabled superior retention of Ectoin’s protective and hydrating functions, especially in overnight repair and anti-aging treatments.

Lotions, holding a 20% share, have been widely accepted for their light texture and full-body application, particularly in hot and humid regions. Meanwhile, serums, capturing 15% of the segment, have emerged as high-efficacy solutions targeting specific concerns like fine lines and barrier dysfunction.

The rise of multi-step skincare routines in developed markets and minimalist regimens in emerging economies has driven balanced demand across these formulations. As clean beauty trends and ingredient transparency further influence buyer preferences, formulation types offering both sensorial appeal and functional performance are expected to shape the market’s future.

What are the Drivers, Restraints, and Key Trends of the Ectoin-Infused Skincare Market?

High-performance demands and dermatological validation continue to redefine the Ectoin-infused skincare space, even as formulation cost constraints and clinical substantiation hurdles temper widespread integration across value-tier offerings.

Therapeutic Dermatology Convergence in Functional Skincare

A convergence between therapeutic dermatology and premium skincare has been observed to significantly influence the commercial trajectory of Ectoin-based formulations. Dermatologists and clinical institutions have increasingly endorsed Ectoin for its cytoprotective and anti-inflammatory mechanisms, especially in treating atopic dermatitis, eczema, and photoaged skin.

These endorsements have accelerated cross-industry collaborations, allowing cosmeceutical brands to co-develop skin-barrier-centric products under medical supervision. As functional skincare increasingly overlaps with therapeutic claims, demand for Ectoin formulations has been propelled beyond traditional cosmetic positioning. This convergence has also unlocked entry into insurance-covered derma-cosmetic programs in select European markets, supporting deeper institutional penetration.

Regulatory-Backed Ingredient Storytelling in Clean Beauty Positioning

A strategic pivot toward regulatory-backed ingredient storytelling has been identified as a critical trend within clean beauty portfolios. Ectoin’s INCI-approved status and clinical documentation have enabled brands to structure transparent narratives backed by evidence rather than marketing rhetoric.

As consumers become increasingly skeptical of exaggerated “natural” claims, actives like Ectoin supported by peer-reviewed studies and EU compliance are being positioned as scientifically clean. This alignment of regulatory trust and emotional engagement has positioned Ectoin-infused products at the forefront of next-generation clean beauty, particularly within premium skincare lines targeting barrier repair, urban defense, and inflammation control.
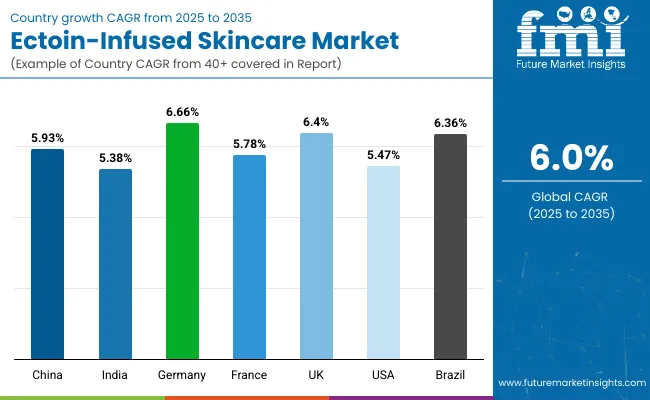
Analysis of Ectoin-Infused Skincare Market By Key Countries

Ectoin Infused Skincare Market By Country

Countries CAGR
China 5.93%
India 5.38%
Germany 6.66%
France 5.78%
UK 6.40%
USA 5.47%
Brazil 6.36%

Marked variations in product adoption and innovation pace have been observed across global markets for Ectoin-infused skincare, shaped by cultural skincare routines, regulatory support for active ingredients, and the maturity of dermo-cosmetic ecosystems. Asia-Pacific is poised to evolve as a high-potential growth hub, with China expanding at a CAGR of 5.93% and India closely following at 5.38%.

In China, consumer preference for multifunctional actives and science-backed claims has driven early adoption through TCM-integrated cosmeceuticals and premium DTC platforms. Governmental encouragement of biotech-based skincare ingredients and a thriving e-commerce ecosystem have further enhanced product visibility. India’s growth trajectory has been linked to a rising focus on dermatological skin health, increased influence of K-beauty and J-beauty regimens, and dermatologist-led prescription skin routines within urban segments.

Europe remains a center for formulation innovation, with Germany (6.66%), UK (6.40%), and France (5.78%) leading growth due to their established cosmeceutical supply chains and demand for clinically tested actives. Regulatory alignment with REACH and emphasis on allergen-free, microbiome-safe ingredients have favored the uptake of Ectoin in derma-backed offerings.

In North America, the USA market (5.47%) continues to reflect strong interest in ingredient transparency and barrier-repair science, although broader penetration into mass-market segments remains gradual. Growth in the Brazilian market (6.36%) has been supported by increasing dermatological awareness and rising investments in biotech-based actives tailored to tropical climates.

Sales Outlook for Ectoin-Infused Skincare in the United States

Years 2025 2026 2027 2028 2029 2030 2031 2032 2033 2034 2035
USA 25.2 26.9 28.3 30.2 32.1 34.3 36.3 38.4 40.3 42.6 45.5

The Ectoin-infused skincare market in the United States is projected to expand at a CAGR of 5.47% from 2025 to 2035, supported by clinical dermatology collaborations, heightened awareness of skin barrier protection, and the mainstreaming of microbiome-safe skincare. Increasing demand has been observed across the anti-aging and hydration segments, particularly among aging millennials and health-conscious Gen Z consumers. The formulation of Ectoin into prescription-strength skincare often co-developed with dermatologists is gaining momentum as cosmeceuticals become integrated into personalized skin treatment plans.

A marked rise in formulation bundling strategies has also been observed, with Ectoin often combined with ceramides, niacinamide, or peptides to target multiple concerns in single-use regimens. This approach has aligned well with consumer preferences for high-efficacy minimalist routines.

  • Clinical-strength anti-aging regimens featuring Ectoin are being adopted in dermatology-led skin protocols.
  • DTC brands are bundling Ectoin-based serums with probiotic moisturizers for microbiome support.
  • Pharmacy chains have begun increasing shelf space for dermatologist-endorsed Ectoin products.
  • Retailers are leveraging ingredient transparency, using Ectoin’s scientific profile as a differentiator in clean beauty segment

Growth and Expansion Outlook for Ectoin-Infused Skincare Market in the United Kingdom

The Ectoin-infused skincare market in the United Kingdom is projected to grow at a CAGR of 6.40%, driven by strong alignment with clinical dermatology protocols, NHS-backed skin health initiatives, and rising demand for sensitive-skin formulations. Growth has been supported by Ectoin’s increasing inclusion in barrier-repair and rosacea-control regimens, particularly among adults with reactive or hypersensitive skin.

Widespread consumer trust in evidence-backed actives has elevated Ectoin’s positioning, with premium pharmacy brands leveraging its documented efficacy in anti-inflammatory and hydration support. Formulators have also begun integrating Ectoin into multi-functional, fragrance-free skincare, aligning with minimalist routines and dermatologist recommendations.

  • Barrier-repair serums and moisturizers featuring Ectoin are being preferred by dermatologists in sensitive skin protocols.
  • Health & beauty retailers have expanded clean-label product shelves to include EU-compliant Ectoin offerings.
  • British cosmeceutical startups are leveraging Ectoin to build credibility around skin science and efficacy.
  • Sustainability alignment is being enabled through biotech-sourced Ectoin, supporting UK’s clean beauty mandates.

Growth and Expansion Outlook for Ectoin-Infused Skincare Market in India

India’s Ectoin-infused skincare market is expected to grow at a CAGR of 5.38%, supported by increased dermatologist outreach, rising skincare literacy in urban centers, and growing demand for multi-tasking actives in compact formulations. Ectoin’s compatibility with Indian skin types and humid climates has positioned it favorably in hydration, pigmentation, and pollution defense products.

Adoption has been further enhanced through prescriptive dermatology channels, with dermatologists increasingly recommending Ectoin-based creams for barrier repair and anti-inflammatory benefits. As Indian consumers gravitate toward minimalist, skin-first routines, Ectoin’s clean-label appeal and multifunctional performance are being recognized across pharmacy chains and digital-first beauty platforms.

  • Dermo-cosmetic clinics have introduced Ectoin-led formulations in skin-recovery treatments.
  • Urban consumers are showing increasing demand for fragrance-free, clinically aligned actives for sensitive skin.
  • E-commerce brands are promoting Ectoin through transparent ingredient storytelling and visual skin science.
  • Product bundling with niacinamide and ceramides is enhancing trust in barrier-repair efficacy.

Sales Outlook for Ectoin-Infused Skincare in China

The Chinese Ectoin-infused skincare market is forecasted to grow at a CAGR of 5.93%, underpinned by accelerated consumer shift toward biotech-enhanced functional skincare. Rising demand for microbiome-safe, barrier-strengthening actives especially among urban women aged 25-45 has elevated the adoption of Ectoin in daily-use creams, facial serums, and sunscreen formats.

Domestic brands have actively positioned Ectoin as a next-gen clean active, supported by regulatory recognition under China's evolving Ingredient Whitelist System. Integration into TCM-meets-biotech skin treatments is being explored by niche DTC players, fueling visibility across Tier 1 and Tier 2 cities.

  • Local brands are embedding Ectoin into multifunctional solutions targeting “maskne,” oxidative stress, and dehydration.
  • Tmall and Douyin platforms are being used to educate consumers on science-backed actives through influencer-dermatologist collaborations.
  • Cross-border brands are using Ectoin as a hero ingredient to differentiate within China’s saturated anti-aging category.
  • Skin sensitivity and pollution resilience remain core narratives enabling sustained growth in Ectoin skincare offerings.

In-depth Analysis of Ectoin-Infused Skincare in Germany

Countries 2025 2035
UK 20.44% 19.50%
Germany 20.99% 20.00%
Italy 11.11% 11.27%
France 13.41% 12.27%
Spain 9.56% 9.85%
BENELUX 6.74% 5.22%
Nordic 5.69% 5.54%
Rest of Europe 12% 16%

Germany is projected to record the highest growth rate among European markets, with a CAGR of 6.66% between 2025 and 2035. Deep-rooted consumer preference for science-validated, allergy-safe formulations has led to widespread trust in Ectoin-based derma products, especially those targeting inflammation, UV-induced aging, and barrier dysfunction.

Formulations containing Ectoin have been increasingly recommended by German dermatologists for atopic dermatitis, post-procedure care, and pollution-induced redness. Pharmacy-led retail channels and cosmeceutical brands have responded by expanding their Ectoin product lines across creams, emulsions, and gels for both adult and pediatric use.

  • Apotheken (pharmacy) channels dominate distribution of Ectoin-infused creams in clinical skincare aisles.
  • Bio-cosmetic labels are co-formulating Ectoin with natural emollients to meet COSMOS/ECOCERT standards.
  • High-performance hydration and skin repair are core value propositions in German product labeling.
  • Allergy-free, fragrance-neutral marketing continues to elevate Ectoin’s appeal among sensitive skin consumers.

Growth Outlook for Ectoin-Infused Skincare Market in Japan

Product Type 2025 Share %
Face Creams & Moisturizers 22%
Serums & Ampoules 16%
Eye Creams & Gels 8%
Sunscreens & UV Protection Creams 9%
Face Masks (Sheet, Cream, Gel) 11%
Cleansers & Toners 12%
Lip Care Products 5%
Body Lotions & Creams 17%

The Ectoin-infused skincare market in Japan is projected to reach USD 9.98 million in 2025, with face creams & moisturizers contributing the highest share at 22%, followed by body lotions & creams (17%) and serums & ampoules (16%). This product mix reflects Japan’s cultural preference for hydration-centric, lightweight formulations that support skin clarity, resilience, and long-term health.

Consumer adoption has been shaped by Japan’s deep-rooted skincare philosophy of layered treatment systems, in which each product type serves a distinct therapeutic function. Ectoin’s compatibility with sensitive skin and its ability to support barrier integrity and cellular hydration have been particularly aligned with local skincare expectations.

Advanced formulation science is being prioritized by Japanese manufacturers, with a growing shift toward multifunctional, biotech-derived actives. These trends are supported by strong dermatological research networks and consumer demand for clean-label, clinically validated ingredients. As Japan continues to lead in ingredient safety, efficacy regulation, and sensorial excellence, the market is poised for stable long-term expansion.

  • Japan holds 9.5% of global market share in 2025, valued at USD 9.98 million.
  • Face creams & moisturizers lead the category, followed closely by body lotions and serums.
  • Growth is supported by layered skincare routines, ingredient transparency, and clinical credibility.
  • Formulation innovation is being amplified by biotech sourcing, minimalist skincare, andderma-channel penetration.

Opportunity Analysis of South Korea Ectoin-Infused Skincare Market

Functionality 2025 Share %
Anti aging & Wrinkle Reduction 28%
Hydration & Moisture Retention 20%
Barrier Repair & Protection 14%
Anti pollution & Environmental Defense 10%
Brightening & Tone Correction 15%
Soothing & Calming (Sensitive Skin, Redness) 13%

The Ectoin-infused skincare market in South Korea is projected to reach USD 7.88 million in 2025, with the anti-aging & wrinkle reduction segment leading at 28%, followed by hydration & moisture retention (20%) and brightening & tone correction (15%). These segments have been prioritized due to South Korea’s advanced skincare culture, where performance-led, clinically aligned actives are deeply embedded in multi-step routines.

Consumer preferences have been observed to shift toward functional cosmetics offering real, visible skin improvement, especially in the areas of barrier repair, inflammation control, and age prevention. Ectoin’s ability to offer anti-inflammatory, antioxidant, and moisture-retention benefits without disrupting skin microbiota has positioned it as a hero active in both prescription skincare and premium K-beauty lines.

Local formulators have increasingly focused on biotech-derived ingredients that support product claims around environmental protection, post-exfoliation recovery, and skin sensitivity. South Korea’s cosmetic innovation ecosystem bolstered by regulatory clarity, R&D collaboration, and ingredient traceability has been instrumental in accelerating Ectoin’s inclusion across functional skincare formats.
  • South Korea holds 7.5% of global market share in 2025, valued at USD 7.88 million.
  • Anti-aging and hydration are projected to be the highest-performing functionality segments.
  • Ectoin is being adopted in K-beauty innovation for multi-step routines targeting skin longevity.
  • Growth is supported by dermatologist-backed development, sensitive-skin targeting, and eco-functional ingredient sourcing.

Competitive Landscape of Ectoin-Infused Skincare Market

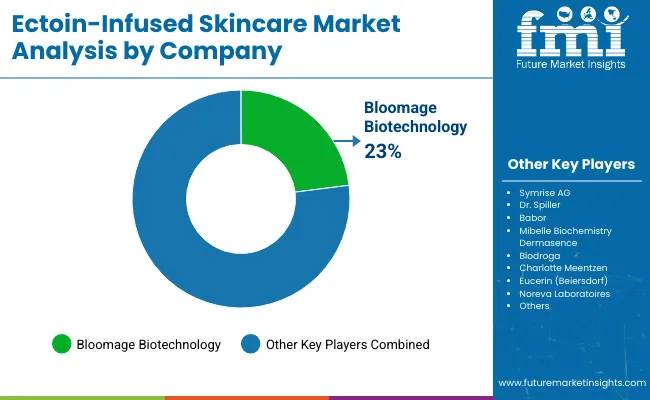
Ectoin Infused Skincare Market By Company

Players Global Value Share 2025
Bloomage Biotechnology 23%
Others 77%

The Ectoin-infused skincare market has been observed to be moderately fragmented, with global ingredient suppliers, mid-sized derma-cosmetic brands, and specialized clinical skincare labels competing across varied consumer and therapeutic use cases. Global players such as Symrise AG have maintained a dominant upstream presence through the supply of biotech-derived hydrating Ectoin actives, often integrated via long-term partnerships with formulation houses and premium cosmetic brands. Their strategic advantage has been reinforced by clinical validation pipelines, INCI-compliant positioning, and extensive cross-category application potential.

Established derma-cosmetic manufacturers including Dr. Spiller, Babor, Dermasence, and Mibelle Biochemistry have been observed to focus on science-led skincare, targeting sensitive skin, barrier repair, and inflammation control. These brands have integrated Ectoin into serums, creams, and ampoules, particularly within anti-aging and hydration portfolios. Market penetration has been enhanced through dermatologist-backed marketing and pharmacy channel distribution in Europe and Asia.

Specialist skincare brands such as Biodroga, Annemarie Börlind, Charlotte Meentzen, and NorevaLaboratoires have captured niche segments by emphasizing clean-label, fragrance-free, and vegan formulations, supported by targeted ingredient transparency.

The competitive focus has gradually shifted from mere product efficacy to regulatory-backed claims, microbiome compatibility, and multifunctional formulation strategies. As regulatory compliance and therapeutic skincare overlap, brand credibility is increasingly being built around Ectoin’s clinical data, sustainability sourcing, and sensitivity safety, signaling a continued shift toward evidence-based product ecosystems.

Key Developments in Ectoin-Infused Skincare Market

  • In March 2025, Bloomage Biotech was honored with a prestigious Allē Award for breakthrough skincare innovation, recognizing its recombinant collagen and sustainable bioactive ingredient advancements. This accolade reinforced Ectoin’s value narrative as a science-backed, sustainable active boosting industry trust and accelerating integration into premium derma and pharmacy-led product lines.
  • At the 12th CITE Japan exhibition in May 2025, Bloomage Biotech unveiled a suite of four cutting‑edge bioskincare ingredients Bioyouth™-SPG Schizophyllan Gel, Hymagic™-VCHA, and others with a strong emphasis on cell biology and glycobiology innovation. Ectoin’s market positioning was significantly enhanced through rising consumer interest in scientifically validated, barrier‑repair actives, fueling broader ingredient adoption.

Scope of the Report

Item Value
Quantitative Units USD 435.6 Million
Component Ectoin Active Ingredient, Finished Skincare Products (Creams, Serums, Lotions, Masks, Sunscreens)
Functionality Anti-aging & Wrinkle Reduction, Hydration & Moisture Retention, Barrier Repair, Brightening, Anti-pollution, Soothing
Formulation Type Cream, Gel, Lotion, Serum, Balm, Spray/Mist
Product Type Face Creams & Moisturizers, Serums & Ampoules, Eye Creams & Gels, Sunscreens, Face Masks, Cleansers & Toners, Lip Care, Body Lotions
End-use Application Dermatologist-Recommended Skincare, OTC Retail Skincare, Pharmacy-based Cosmeceuticals, Online DTC Brands
Regions Covered North America, Europe, Asia-Pacific, Latin America, Middle East & Africa
Countries Covered United States, Canada, Germany, France, United Kingdom, China, Japan, India, Brazil, South Korea
Key Companies Profiled Symrise AG, Bloomage Biotech, Dr. Spiller, Babor, Mibelle Biochemistry, Dermasence, Biodroga, Charlotte Meentzen, Eucerin (Beiersdorf), Noreva Laboratoires
Additional Attributes Market segmentation by functionality and formulation; CAGR by region and format; Ectoin demand in derma vs. OTC segments; Clean-label and biotech-derived ingredient growth; Integration into post-procedure skin recovery routines; Region-specific product development; Dermatologist endorsements and regulatory-approved positioning

Key Segments

By Product Type:

  • Face Creams & Moisturizers
  • Serums & Ampoules
  • Eye Creams & Gels
  • Sunscreens & UV Protection Creams
  • Face Masks (Sheet, Cream, Gel)
  • Cleansers & Toners
  • Lip Care Products
  • Body Lotions & Creams

By Functionality:

  • Anti aging & Wrinkle Reduction
  • Hydration & Moisture Retention
  • Barrier Repair & Protection
  • Anti pollution & Environmental Defense
  • Brightening & Tone Correction
  • Soothing & Calming (Sensitive Skin, Redness)

By Formulation Type:

  • Cream
  • Gel
  • Lotion
  • Serum
  • Balm
  • Spray/Mist

By Skin Type:

  • Sensitive Skin
  • Dry Skin
  • Combination Skin
  • Oily Skin
  • Mature Skin

By Sales Channel:

  • Pharmacies & Drugstores
  • Specialty Beauty Stores
  • Department Stores
  • Online Retail
  • Direct to Consumer (D2C)
  • Dermatology Clinics & Spas

By End User:

  • Women
  • Men
  • Unisex

By Region:

  • North America
  • Latin America
  • Europe
  • East Asia
  • South Asia & Pacific
  • MEA

Table of Content

  1. Executive Summary
    • Global Market Outlook
    • Demand-side Trends
    • Supply-side Trends
    • Technology Roadmap Analysis
    • Analysis and Recommendations
  2. Market Overview
    • Market Coverage / Taxonomy
    • Market Definition / Scope / Limitations
  3. Market Background
    • Market Dynamics
      • Drivers
      • Restraints
      • Opportunity
      • Trends
    • Scenario Forecast
      • Demand in Optimistic Scenario
      • Demand in Likely Scenario
      • Demand in Conservative Scenario
    • Opportunity Map Analysis
    • Product Life Cycle Analysis
    • Supply Chain Analysis
      • Supply Side Participants and their Roles
        • Producers
        • Mid-Level Participants (Traders/ Agents/ Brokers)
        • Wholesalers and Distributors
      • Value Added and Value Created at Node in the Supply Chain
      • List of Raw Material Suppliers
      • List of Existing and Potential Buyer’s
    • Investment Feasibility Matrix
    • Value Chain Analysis
      • Profit Margin Analysis
      • Wholesalers and Distributors
      • Retailers
    • PESTLE and Porter’s Analysis
    • Regulatory Landscape
      • By Key Regions
      • By Key Countries
    • Regional Parent Market Outlook
    • Production and Consumption Statistics
    • Import and Export Statistics
  4. Global Market Analysis 2020 to 2024 and Forecast, 2025 to 2035
    • Historical Market Size Value (USD Million) & Volume (Units) Analysis, 2020 to 2024
    • Current and Future Market Size Value (USD Million) & Volume (Units) Projections, 2025 to 2035
      • Y-o-Y Growth Trend Analysis
      • Absolute $ Opportunity Analysis
  5. Global Market Analysis 2020 to 2024 and Forecast 2025 to 2035, By Product Type
    • Introduction / Key Findings
    • Historical Market Size Value (USD Million) & Volume (Units) Analysis By Product Type, 2020 to 2024
    • Current and Future Market Size Value (USD Million) & Volume (Units) Analysis and Forecast By Product Type, 2025 to 2035
      • Face Creams & Moisturizers
      • Serums & Ampoules
      • Eye Creams & Gels
      • Sunscreens & UV Protection Creams
      • Face Masks (Sheet, Cream, Gel)
      • Cleansers & Toners
      • Lip Care Products
      • Body Lotions & Creams
    • Y-o-Y Growth Trend Analysis By Product Type, 2020 to 2024
    • Absolute $ Opportunity Analysis By Product Type, 2025 to 2035
  6. Global Market Analysis 2020 to 2024 and Forecast 2025 to 2035, By Functionality
    • Introduction / Key Findings
    • Historical Market Size Value (USD Million) & Volume (Units) Analysis By Functionality, 2020 to 2024
    • Current and Future Market Size Value (USD Million) & Volume (Units) Analysis and Forecast By Functionality, 2025 to 2035
      • Anti aging & Wrinkle Reduction
      • Hydration & Moisture Retention
      • Barrier Repair & Protection
      • Anti pollution & Environmental Defense
      • Brightening & Tone Correction
      • Soothing & Calming (Sensitive Skin, Redness)
    • Y-o-Y Growth Trend Analysis By Functionality, 2020 to 2024
    • Absolute $ Opportunity Analysis By Functionality, 2025 to 2035
  7. Global Market Analysis 2020 to 2024 and Forecast 2025 to 2035, By Formulation Type
    • Introduction / Key Findings
    • Historical Market Size Value (USD Million) & Volume (Units) Analysis By Formulation Type, 2020 to 2024
    • Current and Future Market Size Value (USD Million) & Volume (Units) Analysis and Forecast By Formulation Type, 2025 to 2035
      • Cream
      • Gel
      • Lotion
      • Serum
      • Balm
      • Spray/Mist
    • Y-o-Y Growth Trend Analysis By Formulation Type, 2020 to 2024
    • Absolute $ Opportunity Analysis By Formulation Type, 2025 to 2035
  8. Global Market Analysis 2020 to 2024 and Forecast 2025 to 2035, By Skin Type
    • Introduction / Key Findings
    • Historical Market Size Value (USD Million) & Volume (Units) Analysis By Skin Type, 2020 to 2024
    • Current and Future Market Size Value (USD Million) & Volume (Units) Analysis and Forecast By Skin Type, 2025 to 2035
      • Sensitive Skin
      • Dry Skin
      • Combination Skin
      • Oily Skin
      • Mature Skin
    • Y-o-Y Growth Trend Analysis By Skin Type, 2020 to 2024
    • Absolute $ Opportunity Analysis By Skin Type, 2025 to 2035
  9. Global Market Analysis 2020 to 2024 and Forecast 2025 to 2035, By Sales Channel
    • Introduction / Key Findings
    • Historical Market Size Value (USD Million) & Volume (Units) Analysis By Sales Channel, 2020 to 2024
    • Current and Future Market Size Value (USD Million) & Volume (Units) Analysis and Forecast By Sales Channel, 2025 to 2035
      • Pharmacies & Drugstores
      • Specialty Beauty Stores
      • Department Stores
      • Online Retail
      • Direct to Consumer (D2C)
      • Dermatology Clinics & Spas
    • Y-o-Y Growth Trend Analysis By Sales Channel, 2020 to 2024
    • Absolute $ Opportunity Analysis By Sales Channel, 2025 to 2035
  10. Global Market Analysis 2020 to 2024 and Forecast 2025 to 2035, By End User
    • Introduction / Key Findings
    • Historical Market Size Value (USD Million) & Volume (Units) Analysis By End User, 2020 to 2024
    • Current and Future Market Size Value (USD Million) & Volume (Units) Analysis and Forecast By End User, 2025 to 2035
      • Women
      • Men
      • Unisex
    • Y-o-Y Growth Trend Analysis By End User, 2020 to 2024
    • Absolute $ Opportunity Analysis By End User, 2025 to 2035
  11. Global Market Analysis 2020 to 2024 and Forecast 2025 to 2035, By Region
    • Introduction
    • Historical Market Size Value (USD Million) & Volume (Units) Analysis By Region, 2020 to 2024
    • Current Market Size Value (USD Million) & Volume (Units) Analysis and Forecast By Region, 2025 to 2035
      • North America
      • Latin America
      • Europe
      • East Asia
      • South Asia & Pacific
      • MEA
    • Market Attractiveness Analysis By Region
  12. North America Market Analysis 2020 to 2024 and Forecast 2025 to 2035, By Country
    • Historical Market Size Value (USD Million) & Volume (Units) Trend Analysis By Market Taxonomy, 2020 to 2024
    • Market Size Value (USD Million) & Volume (Units) Forecast By Market Taxonomy, 2025 to 2035
      • By Country
        • USA
        • Canada
      • By Product Type
      • By Functionality
      • By Formulation Type
      • By Skin Type
      • By Sales Channel
      • By End User
    • Market Attractiveness Analysis
      • By Country
      • By Product Type
      • By Functionality
      • By Formulation Type
      • By Skin Type
      • By Sales Channel
      • By End User
    • Key Takeaways
  13. Latin America Market Analysis 2020 to 2024 and Forecast 2025 to 2035, By Country
    • Historical Market Size Value (USD Million) & Volume (Units) Trend Analysis By Market Taxonomy, 2020 to 2024
    • Market Size Value (USD Million) & Volume (Units) Forecast By Market Taxonomy, 2025 to 2035
      • By Country
        • Brazil
        • Mexico
        • Colombia
        • Rest of Latin America
      • By Product Type
      • By Functionality
      • By Formulation Type
      • By Skin Type
      • By Sales Channel
      • By End User
    • Market Attractiveness Analysis
      • By Country
      • By Product Type
      • By Functionality
      • By Formulation Type
      • By Skin Type
      • By Sales Channel
      • By End User
    • Key Takeaways
  14. Europe Market Analysis 2020 to 2024 and Forecast 2025 to 2035, By Country
    • Historical Market Size Value (USD Million) & Volume (Units) Trend Analysis By Market Taxonomy, 2020 to 2024
    • Market Size Value (USD Million) & Volume (Units) Forecast By Market Taxonomy, 2025 to 2035
      • By Country
        • Germany
        • UK
        • France
        • Italy
        • Spain
        • Belgium
        • Netherlands
        • Nordic
        • Switzerland
        • Russia
        • Poland
        • Rest of Europe
      • By Product Type
      • By Functionality
      • By Formulation Type
      • By Skin Type
      • By Sales Channel
      • By End User
    • Market Attractiveness Analysis
      • By Country
      • By Product Type
      • By Functionality
      • By Formulation Type
      • By Skin Type
      • By Sales Channel
      • By End User
    • Key Takeaways
  15. East Asia Market Analysis 2020 to 2024 and Forecast 2025 to 2035, By Country
    • Historical Market Size Value (USD Million) & Volume (Units) Trend Analysis By Market Taxonomy, 2020 to 2024
    • Market Size Value (USD Million) & Volume (Units) Forecast By Market Taxonomy, 2025 to 2035
      • By Country
        • China
        • Japan
        • South Korea
      • By Product Type
      • By Functionality
      • By Formulation Type
      • By Skin Type
      • By Sales Channel
      • By End User
    • Market Attractiveness Analysis
      • By Country
      • By Product Type
      • By Functionality
      • By Formulation Type
      • By Skin Type
      • By Sales Channel
      • By End User
    • Key Takeaways
  16. South Asia & Pacific Market Analysis 2020 to 2024 and Forecast 2025 to 2035, By Country
    • Historical Market Size Value (USD Million) & Volume (Units) Trend Analysis By Market Taxonomy, 2020 to 2024
    • Market Size Value (USD Million) & Volume (Units) Forecast By Market Taxonomy, 2025 to 2035
      • By Country
        • India
        • Thailand
        • Malaysia
        • Indonesia
        • Singapore
        • Vietnam
        • Australia
        • New Zealand
        • Rest of South Asia
      • By Product Type
      • By Functionality
      • By Formulation Type
      • By Skin Type
      • By Sales Channel
      • By End User
    • Market Attractiveness Analysis
      • By Country
      • By Product Type
      • By Functionality
      • By Formulation Type
      • By Skin Type
      • By Sales Channel
      • By End User
    • Key Takeaways
  17. MEA Market Analysis 2020 to 2024 and Forecast 2025 to 2035, By Country
    • Historical Market Size Value (USD Million) & Volume (Units) Trend Analysis By Market Taxonomy, 2020 to 2024
    • Market Size Value (USD Million) & Volume (Units) Forecast By Market Taxonomy, 2025 to 2035
      • By Country
        • Turkey
        • UAE
        • Saudi Arabia
        • Israel
        • Other GCC Countries
        • North Africa
        • South Africa
        • Central Africa
        • Rest of MEA
      • By Product Type
      • By Functionality
      • By Formulation Type
      • By Skin Type
      • By Sales Channel
      • By End User
    • Market Attractiveness Analysis
      • By Country
      • By Product Type
      • By Functionality
      • By Formulation Type
      • By Skin Type
      • By Sales Channel
      • By End User
    • Key Takeaways
  18. Key Countries Market Analysis
    • USA
      • Pricing Analysis
      • Market Share Analysis, 2024
        • By Product Type
        • By Functionality
        • By Formulation Type
        • By Skin Type
        • By Sales Channel
        • By End User
    • Canada
      • Pricing Analysis
      • Market Share Analysis, 2024
        • By Product Type
        • By Functionality
        • By Formulation Type
        • By Skin Type
        • By Sales Channel
        • By End User
    • Brazil
      • Pricing Analysis
      • Market Share Analysis, 2024
        • By Product Type
        • By Functionality
        • By Formulation Type
        • By Skin Type
        • By Sales Channel
        • By End User
    • Mexico
      • Pricing Analysis
      • Market Share Analysis, 2024
        • By Product Type
        • By Functionality
        • By Formulation Type
        • By Skin Type
        • By Sales Channel
        • By End User
    • Colombia
      • Pricing Analysis
      • Market Share Analysis, 2024
        • By Product Type
        • By Functionality
        • By Formulation Type
        • By Skin Type
        • By Sales Channel
        • By End User
    • Germany
      • Pricing Analysis
      • Market Share Analysis, 2024
        • By Product Type
        • By Functionality
        • By Formulation Type
        • By Skin Type
        • By Sales Channel
        • By End User
    • UK
      • Pricing Analysis
      • Market Share Analysis, 2024
        • By Product Type
        • By Functionality
        • By Formulation Type
        • By Skin Type
        • By Sales Channel
        • By End User
    • France
      • Pricing Analysis
      • Market Share Analysis, 2024
        • By Product Type
        • By Functionality
        • By Formulation Type
        • By Skin Type
        • By Sales Channel
        • By End User
    • Italy
      • Pricing Analysis
      • Market Share Analysis, 2024
        • By Product Type
        • By Functionality
        • By Formulation Type
        • By Skin Type
        • By Sales Channel
        • By End User
    • Spain
      • Pricing Analysis
      • Market Share Analysis, 2024
        • By Product Type
        • By Functionality
        • By Formulation Type
        • By Skin Type
        • By Sales Channel
        • By End User
    • Belgium
      • Pricing Analysis
      • Market Share Analysis, 2024
        • By Product Type
        • By Functionality
        • By Formulation Type
        • By Skin Type
        • By Sales Channel
        • By End User
    • Netherlands
      • Pricing Analysis
      • Market Share Analysis, 2024
        • By Product Type
        • By Functionality
        • By Formulation Type
        • By Skin Type
        • By Sales Channel
        • By End User
    • Nordic
      • Pricing Analysis
      • Market Share Analysis, 2024
        • By Product Type
        • By Functionality
        • By Formulation Type
        • By Skin Type
        • By Sales Channel
        • By End User
    • Switzerland
      • Pricing Analysis
      • Market Share Analysis, 2024
        • By Product Type
        • By Functionality
        • By Formulation Type
        • By Skin Type
        • By Sales Channel
        • By End User
    • Russia
      • Pricing Analysis
      • Market Share Analysis, 2024
        • By Product Type
        • By Functionality
        • By Formulation Type
        • By Skin Type
        • By Sales Channel
        • By End User
    • Poland
      • Pricing Analysis
      • Market Share Analysis, 2024
        • By Product Type
        • By Functionality
        • By Formulation Type
        • By Skin Type
        • By Sales Channel
        • By End User
    • China
      • Pricing Analysis
      • Market Share Analysis, 2024
        • By Product Type
        • By Functionality
        • By Formulation Type
        • By Skin Type
        • By Sales Channel
        • By End User
    • Japan
      • Pricing Analysis
      • Market Share Analysis, 2024
        • By Product Type
        • By Functionality
        • By Formulation Type
        • By Skin Type
        • By Sales Channel
        • By End User
    • South Korea
      • Pricing Analysis
      • Market Share Analysis, 2024
        • By Product Type
        • By Functionality
        • By Formulation Type
        • By Skin Type
        • By Sales Channel
        • By End User
    • India
      • Pricing Analysis
      • Market Share Analysis, 2024
        • By Product Type
        • By Functionality
        • By Formulation Type
        • By Skin Type
        • By Sales Channel
        • By End User
    • Thailand
      • Pricing Analysis
      • Market Share Analysis, 2024
        • By Product Type
        • By Functionality
        • By Formulation Type
        • By Skin Type
        • By Sales Channel
        • By End User
    • Indonesia
      • Pricing Analysis
      • Market Share Analysis, 2024
        • By Product Type
        • By Functionality
        • By Formulation Type
        • By Skin Type
        • By Sales Channel
        • By End User
    • Australia
      • Pricing Analysis
      • Market Share Analysis, 2024
        • By Product Type
        • By Functionality
        • By Formulation Type
        • By Skin Type
        • By Sales Channel
        • By End User
    • New Zealand
      • Pricing Analysis
      • Market Share Analysis, 2024
        • By Product Type
        • By Functionality
        • By Formulation Type
        • By Skin Type
        • By Sales Channel
        • By End User
    • Turkey
      • Pricing Analysis
      • Market Share Analysis, 2024
        • By Product Type
        • By Functionality
        • By Formulation Type
        • By Skin Type
        • By Sales Channel
        • By End User
    • UAE
      • Pricing Analysis
      • Market Share Analysis, 2024
        • By Product Type
        • By Functionality
        • By Formulation Type
        • By Skin Type
        • By Sales Channel
        • By End User
    • Saudi Arabia
      • Pricing Analysis
      • Market Share Analysis, 2024
        • By Product Type
        • By Functionality
        • By Formulation Type
        • By Skin Type
        • By Sales Channel
        • By End User
    • Israel
      • Pricing Analysis
      • Market Share Analysis, 2024
        • By Product Type
        • By Functionality
        • By Formulation Type
        • By Skin Type
        • By Sales Channel
        • By End User
    • North Africa
      • Pricing Analysis
      • Market Share Analysis, 2024
        • By Product Type
        • By Functionality
        • By Formulation Type
        • By Skin Type
        • By Sales Channel
        • By End User
    • South Africa
      • Pricing Analysis
      • Market Share Analysis, 2024
        • By Product Type
        • By Functionality
        • By Formulation Type
        • By Skin Type
        • By Sales Channel
        • By End User
  19. Market Structure Analysis
    • Competition Dashboard
    • Competition Benchmarking
    • Market Share Analysis of Top Players
      • By Regional
      • By Product Type
      • By Functionality
      • By Formulation Type
      • By Skin Type
      • By Sales Channel
      • By End User
  20. Competition Analysis
    • Competition Deep Dive
      • Symrise AG (Hydrating Ectoin Actives Supplier & Brands Partnerships)
        • Overview
        • Product Portfolio
        • Profitability by Market Segments (Product/Age /Sales Channel/Region)
        • Sales Footprint
        • Strategy Overview
          • Marketing Strategy
          • Product Strategy
          • Channel Strategy
      • Dr. Spiller Pure SkinCare Solutions
        • Overview
        • Product Portfolio
        • Profitability by Market Segments (Product/Age /Sales Channel/Region)
        • Sales Footprint
        • Strategy Overview
          • Marketing Strategy
          • Product Strategy
          • Channel Strategy
      • Babor
        • Overview
        • Product Portfolio
        • Profitability by Market Segments (Product/Age /Sales Channel/Region)
        • Sales Footprint
        • Strategy Overview
          • Marketing Strategy
          • Product Strategy
          • Channel Strategy
      • Mibelle Biochemistry
        • Overview
        • Product Portfolio
        • Profitability by Market Segments (Product/Age /Sales Channel/Region)
        • Sales Footprint
        • Strategy Overview
          • Marketing Strategy
          • Product Strategy
          • Channel Strategy
      • Dermasence
        • Overview
        • Product Portfolio
        • Profitability by Market Segments (Product/Age /Sales Channel/Region)
        • Sales Footprint
        • Strategy Overview
          • Marketing Strategy
          • Product Strategy
          • Channel Strategy
      • Annemarie Börlind
        • Overview
        • Product Portfolio
        • Profitability by Market Segments (Product/Age /Sales Channel/Region)
        • Sales Footprint
        • Strategy Overview
          • Marketing Strategy
          • Product Strategy
          • Channel Strategy
      • Biodroga
        • Overview
        • Product Portfolio
        • Profitability by Market Segments (Product/Age /Sales Channel/Region)
        • Sales Footprint
        • Strategy Overview
          • Marketing Strategy
          • Product Strategy
          • Channel Strategy
      • Charlotte Meentzen
        • Overview
        • Product Portfolio
        • Profitability by Market Segments (Product/Age /Sales Channel/Region)
        • Sales Footprint
        • Strategy Overview
          • Marketing Strategy
          • Product Strategy
          • Channel Strategy
      • Eucerin (Beiersdorf)
        • Overview
        • Product Portfolio
        • Profitability by Market Segments (Product/Age /Sales Channel/Region)
        • Sales Footprint
        • Strategy Overview
          • Marketing Strategy
          • Product Strategy
          • Channel Strategy
      • Noreva Laboratoires
        • Overview
        • Product Portfolio
        • Profitability by Market Segments (Product/Age /Sales Channel/Region)
        • Sales Footprint
        • Strategy Overview
          • Marketing Strategy
          • Product Strategy
          • Channel Strategy
      • Others
        • Overview
        • Product Portfolio
        • Profitability by Market Segments (Product/Age /Sales Channel/Region)
        • Sales Footprint
        • Strategy Overview
          • Marketing Strategy
          • Product Strategy
          • Channel Strategy
  21. Assumptions & Acronyms Used
  22. Research Methodology

List of Tables

  • Table 1: Global Market Value (USD Million) Forecast by Region, 2020-2035
  • Table 2: Global Market Volume (Units) Forecast by Region, 2020-2035
  • Table 3: Global Market Value (USD Million) Forecast by Product Type, 2020-2035
  • Table 4: Global Market Volume (Units) Forecast by Product Type, 2020-2035
  • Table 5: Global Market Value (USD Million) Forecast by Functionality, 2020-2035
  • Table 6: Global Market Volume (Units) Forecast by Functionality, 2020-2035
  • Table 7: Global Market Value (USD Million) Forecast by Formulation Type, 2020-2035
  • Table 8: Global Market Volume (Units) Forecast by Formulation Type, 2020-2035
  • Table 9: Global Market Value (USD Million) Forecast by Skin Type, 2020-2035
  • Table 10: Global Market Volume (Units) Forecast by Skin Type, 2020-2035
  • Table 11: Global Market Value (USD Million) Forecast by Sales Channel, 2020-2035
  • Table 12: Global Market Volume (Units) Forecast by Sales Channel, 2020-2035
  • Table 13: Global Market Value (USD Million) Forecast by End User, 2020-2035
  • Table 14: Global Market Volume (Units) Forecast by End User, 2020-2035
  • Table 15: North America Market Value (USD Million) Forecast by Country, 2020-2035
  • Table 16: North America Market Volume (Units) Forecast by Country, 2020-2035
  • Table 17: North America Market Value (USD Million) Forecast by Product Type, 2020-2035
  • Table 18: North America Market Volume (Units) Forecast by Product Type, 2020-2035
  • Table 19: North America Market Value (USD Million) Forecast by Functionality, 2020-2035
  • Table 20: North America Market Volume (Units) Forecast by Functionality, 2020-2035
  • Table 21: North America Market Value (USD Million) Forecast by Formulation Type, 2020-2035
  • Table 22: North America Market Volume (Units) Forecast by Formulation Type, 2020-2035
  • Table 23: North America Market Value (USD Million) Forecast by Skin Type, 2020-2035
  • Table 24: North America Market Volume (Units) Forecast by Skin Type, 2020-2035
  • Table 25: North America Market Value (USD Million) Forecast by Sales Channel, 2020-2035
  • Table 26: North America Market Volume (Units) Forecast by Sales Channel, 2020-2035
  • Table 27: North America Market Value (USD Million) Forecast by End User, 2020-2035
  • Table 28: North America Market Volume (Units) Forecast by End User, 2020-2035
  • Table 29: Latin America Market Value (USD Million) Forecast by Country, 2020-2035
  • Table 30: Latin America Market Volume (Units) Forecast by Country, 2020-2035
  • Table 31: Latin America Market Value (USD Million) Forecast by Product Type, 2020-2035
  • Table 32: Latin America Market Volume (Units) Forecast by Product Type, 2020-2035
  • Table 33: Latin America Market Value (USD Million) Forecast by Functionality, 2020-2035
  • Table 34: Latin America Market Volume (Units) Forecast by Functionality, 2020-2035
  • Table 35: Latin America Market Value (USD Million) Forecast by Formulation Type, 2020-2035
  • Table 36: Latin America Market Volume (Units) Forecast by Formulation Type, 2020-2035
  • Table 37: Latin America Market Value (USD Million) Forecast by Skin Type, 2020-2035
  • Table 38: Latin America Market Volume (Units) Forecast by Skin Type, 2020-2035
  • Table 39: Latin America Market Value (USD Million) Forecast by Sales Channel, 2020-2035
  • Table 40: Latin America Market Volume (Units) Forecast by Sales Channel, 2020-2035
  • Table 41: Latin America Market Value (USD Million) Forecast by End User, 2020-2035
  • Table 42: Latin America Market Volume (Units) Forecast by End User, 2020-2035
  • Table 43: Europe Market Value (USD Million) Forecast by Country, 2020-2035
  • Table 44: Europe Market Volume (Units) Forecast by Country, 2020-2035
  • Table 45: Europe Market Value (USD Million) Forecast by Product Type, 2020-2035
  • Table 46: Europe Market Volume (Units) Forecast by Product Type, 2020-2035
  • Table 47: Europe Market Value (USD Million) Forecast by Functionality, 2020-2035
  • Table 48: Europe Market Volume (Units) Forecast by Functionality, 2020-2035
  • Table 49: Europe Market Value (USD Million) Forecast by Formulation Type, 2020-2035
  • Table 50: Europe Market Volume (Units) Forecast by Formulation Type, 2020-2035
  • Table 51: Europe Market Value (USD Million) Forecast by Skin Type, 2020-2035
  • Table 52: Europe Market Volume (Units) Forecast by Skin Type, 2020-2035
  • Table 53: Europe Market Value (USD Million) Forecast by Sales Channel, 2020-2035
  • Table 54: Europe Market Volume (Units) Forecast by Sales Channel, 2020-2035
  • Table 55: Europe Market Value (USD Million) Forecast by End User, 2020-2035
  • Table 56: Europe Market Volume (Units) Forecast by End User, 2020-2035
  • Table 57: East Asia Market Value (USD Million) Forecast by Country, 2020-2035
  • Table 58: East Asia Market Volume (Units) Forecast by Country, 2020-2035
  • Table 59: East Asia Market Value (USD Million) Forecast by Product Type, 2020-2035
  • Table 60: East Asia Market Volume (Units) Forecast by Product Type, 2020-2035
  • Table 61: East Asia Market Value (USD Million) Forecast by Functionality, 2020-2035
  • Table 62: East Asia Market Volume (Units) Forecast by Functionality, 2020-2035
  • Table 63: East Asia Market Value (USD Million) Forecast by Formulation Type, 2020-2035
  • Table 64: East Asia Market Volume (Units) Forecast by Formulation Type, 2020-2035
  • Table 65: East Asia Market Value (USD Million) Forecast by Skin Type, 2020-2035
  • Table 66: East Asia Market Volume (Units) Forecast by Skin Type, 2020-2035
  • Table 67: East Asia Market Value (USD Million) Forecast by Sales Channel, 2020-2035
  • Table 68: East Asia Market Volume (Units) Forecast by Sales Channel, 2020-2035
  • Table 69: East Asia Market Value (USD Million) Forecast by End User, 2020-2035
  • Table 70: East Asia Market Volume (Units) Forecast by End User, 2020-2035
  • Table 71: South Asia & Pacific Market Value (USD Million) Forecast by Country, 2020-2035
  • Table 72: South Asia & Pacific Market Volume (Units) Forecast by Country, 2020-2035
  • Table 73: South Asia & Pacific Market Value (USD Million) Forecast by Product Type, 2020-2035
  • Table 74: South Asia & Pacific Market Volume (Units) Forecast by Product Type, 2020-2035
  • Table 75: South Asia & Pacific Market Value (USD Million) Forecast by Functionality, 2020-2035
  • Table 76: South Asia & Pacific Market Volume (Units) Forecast by Functionality, 2020-2035
  • Table 77: South Asia & Pacific Market Value (USD Million) Forecast by Formulation Type, 2020-2035
  • Table 78: South Asia & Pacific Market Volume (Units) Forecast by Formulation Type, 2020-2035
  • Table 79: South Asia & Pacific Market Value (USD Million) Forecast by Skin Type, 2020-2035
  • Table 80: South Asia & Pacific Market Volume (Units) Forecast by Skin Type, 2020-2035
  • Table 81: South Asia & Pacific Market Value (USD Million) Forecast by Sales Channel, 2020-2035
  • Table 82: South Asia & Pacific Market Volume (Units) Forecast by Sales Channel, 2020-2035
  • Table 83: South Asia & Pacific Market Value (USD Million) Forecast by End User, 2020-2035
  • Table 84: South Asia & Pacific Market Volume (Units) Forecast by End User, 2020-2035
  • Table 85: MEA Market Value (USD Million) Forecast by Country, 2020-2035
  • Table 86: MEA Market Volume (Units) Forecast by Country, 2020-2035
  • Table 87: MEA Market Value (USD Million) Forecast by Product Type, 2020-2035
  • Table 88: MEA Market Volume (Units) Forecast by Product Type, 2020-2035
  • Table 89: MEA Market Value (USD Million) Forecast by Functionality, 2020-2035
  • Table 90: MEA Market Volume (Units) Forecast by Functionality, 2020-2035
  • Table 91: MEA Market Value (USD Million) Forecast by Formulation Type, 2020-2035
  • Table 92: MEA Market Volume (Units) Forecast by Formulation Type, 2020-2035
  • Table 93: MEA Market Value (USD Million) Forecast by Skin Type, 2020-2035
  • Table 94: MEA Market Volume (Units) Forecast by Skin Type, 2020-2035
  • Table 95: MEA Market Value (USD Million) Forecast by Sales Channel, 2020-2035
  • Table 96: MEA Market Volume (Units) Forecast by Sales Channel, 2020-2035
  • Table 97: MEA Market Value (USD Million) Forecast by End User, 2020-2035
  • Table 98: MEA Market Volume (Units) Forecast by End User, 2020-2035

List of Figures

  • Figure 1: Global Market Value (USD Million) by Product Type, 2025-2035
  • Figure 2: Global Market Value (USD Million) by Functionality, 2025-2035
  • Figure 3: Global Market Value (USD Million) by Formulation Type, 2025-2035
  • Figure 4: Global Market Value (USD Million) by Skin Type, 2025-2035
  • Figure 5: Global Market Value (USD Million) by Sales Channel, 2025-2035
  • Figure 6: Global Market Value (USD Million) by End User, 2025-2035
  • Figure 7: Global Market Value (USD Million) by Region, 2025-2035
  • Figure 8: Global Market Value (USD Million) Analysis by Region, 2020-2035
  • Figure 9: Global Market Volume (Units) Analysis by Region, 2020-2035
  • Figure 10: Global Market Value Share (%) and BPS Analysis by Region, 2025-2035
  • Figure 11: Global Market Y-o-Y Growth (%) Projections by Region, 2025-2035
  • Figure 12: Global Market Value (USD Million) Analysis by Product Type, 2020-2035
  • Figure 13: Global Market Volume (Units) Analysis by Product Type, 2020-2035
  • Figure 14: Global Market Value Share (%) and BPS Analysis by Product Type, 2025-2035
  • Figure 15: Global Market Y-o-Y Growth (%) Projections by Product Type, 2025-2035
  • Figure 16: Global Market Value (USD Million) Analysis by Functionality, 2020-2035
  • Figure 17: Global Market Volume (Units) Analysis by Functionality, 2020-2035
  • Figure 18: Global Market Value Share (%) and BPS Analysis by Functionality, 2025-2035
  • Figure 19: Global Market Y-o-Y Growth (%) Projections by Functionality, 2025-2035
  • Figure 20: Global Market Value (USD Million) Analysis by Formulation Type, 2020-2035
  • Figure 21: Global Market Volume (Units) Analysis by Formulation Type, 2020-2035
  • Figure 22: Global Market Value Share (%) and BPS Analysis by Formulation Type, 2025-2035
  • Figure 23: Global Market Y-o-Y Growth (%) Projections by Formulation Type, 2025-2035
  • Figure 24: Global Market Value (USD Million) Analysis by Skin Type, 2020-2035
  • Figure 25: Global Market Volume (Units) Analysis by Skin Type, 2020-2035
  • Figure 26: Global Market Value Share (%) and BPS Analysis by Skin Type, 2025-2035
  • Figure 27: Global Market Y-o-Y Growth (%) Projections by Skin Type, 2025-2035
  • Figure 28: Global Market Value (USD Million) Analysis by Sales Channel, 2020-2035
  • Figure 29: Global Market Volume (Units) Analysis by Sales Channel, 2020-2035
  • Figure 30: Global Market Value Share (%) and BPS Analysis by Sales Channel, 2025-2035
  • Figure 31: Global Market Y-o-Y Growth (%) Projections by Sales Channel, 2025-2035
  • Figure 32: Global Market Value (USD Million) Analysis by End User, 2020-2035
  • Figure 33: Global Market Volume (Units) Analysis by End User, 2020-2035
  • Figure 34: Global Market Value Share (%) and BPS Analysis by End User, 2025-2035
  • Figure 35: Global Market Y-o-Y Growth (%) Projections by End User, 2025-2035
  • Figure 36: Global Market Attractiveness by Product Type, 2025-2035
  • Figure 37: Global Market Attractiveness by Functionality, 2025-2035
  • Figure 38: Global Market Attractiveness by Formulation Type, 2025-2035
  • Figure 39: Global Market Attractiveness by Skin Type, 2025-2035
  • Figure 40: Global Market Attractiveness by Sales Channel, 2025-2035
  • Figure 41: Global Market Attractiveness by End User, 2025-2035
  • Figure 42: Global Market Attractiveness by Region, 2025-2035
  • Figure 43: North America Market Value (USD Million) by Product Type, 2025-2035
  • Figure 44: North America Market Value (USD Million) by Functionality, 2025-2035
  • Figure 45: North America Market Value (USD Million) by Formulation Type, 2025-2035
  • Figure 46: North America Market Value (USD Million) by Skin Type, 2025-2035
  • Figure 47: North America Market Value (USD Million) by Sales Channel, 2025-2035
  • Figure 48: North America Market Value (USD Million) by End User, 2025-2035
  • Figure 49: North America Market Value (USD Million) by Country, 2025-2035
  • Figure 50: North America Market Value (USD Million) Analysis by Country, 2020-2035
  • Figure 51: North America Market Volume (Units) Analysis by Country, 2020-2035
  • Figure 52: North America Market Value Share (%) and BPS Analysis by Country, 2025-2035
  • Figure 53: North America Market Y-o-Y Growth (%) Projections by Country, 2025-2035
  • Figure 54: North America Market Value (USD Million) Analysis by Product Type, 2020-2035
  • Figure 55: North America Market Volume (Units) Analysis by Product Type, 2020-2035
  • Figure 56: North America Market Value Share (%) and BPS Analysis by Product Type, 2025-2035
  • Figure 57: North America Market Y-o-Y Growth (%) Projections by Product Type, 2025-2035
  • Figure 58: North America Market Value (USD Million) Analysis by Functionality, 2020-2035
  • Figure 59: North America Market Volume (Units) Analysis by Functionality, 2020-2035
  • Figure 60: North America Market Value Share (%) and BPS Analysis by Functionality, 2025-2035
  • Figure 61: North America Market Y-o-Y Growth (%) Projections by Functionality, 2025-2035
  • Figure 62: North America Market Value (USD Million) Analysis by Formulation Type, 2020-2035
  • Figure 63: North America Market Volume (Units) Analysis by Formulation Type, 2020-2035
  • Figure 64: North America Market Value Share (%) and BPS Analysis by Formulation Type, 2025-2035
  • Figure 65: North America Market Y-o-Y Growth (%) Projections by Formulation Type, 2025-2035
  • Figure 66: North America Market Value (USD Million) Analysis by Skin Type, 2020-2035
  • Figure 67: North America Market Volume (Units) Analysis by Skin Type, 2020-2035
  • Figure 68: North America Market Value Share (%) and BPS Analysis by Skin Type, 2025-2035
  • Figure 69: North America Market Y-o-Y Growth (%) Projections by Skin Type, 2025-2035
  • Figure 70: North America Market Value (USD Million) Analysis by Sales Channel, 2020-2035
  • Figure 71: North America Market Volume (Units) Analysis by Sales Channel, 2020-2035
  • Figure 72: North America Market Value Share (%) and BPS Analysis by Sales Channel, 2025-2035
  • Figure 73: North America Market Y-o-Y Growth (%) Projections by Sales Channel, 2025-2035
  • Figure 74: North America Market Value (USD Million) Analysis by End User, 2020-2035
  • Figure 75: North America Market Volume (Units) Analysis by End User, 2020-2035
  • Figure 76: North America Market Value Share (%) and BPS Analysis by End User, 2025-2035
  • Figure 77: North America Market Y-o-Y Growth (%) Projections by End User, 2025-2035
  • Figure 78: North America Market Attractiveness by Product Type, 2025-2035
  • Figure 79: North America Market Attractiveness by Functionality, 2025-2035
  • Figure 80: North America Market Attractiveness by Formulation Type, 2025-2035
  • Figure 81: North America Market Attractiveness by Skin Type, 2025-2035
  • Figure 82: North America Market Attractiveness by Sales Channel, 2025-2035
  • Figure 83: North America Market Attractiveness by End User, 2025-2035
  • Figure 84: North America Market Attractiveness by Country, 2025-2035
  • Figure 85: Latin America Market Value (USD Million) by Product Type, 2025-2035
  • Figure 86: Latin America Market Value (USD Million) by Functionality, 2025-2035
  • Figure 87: Latin America Market Value (USD Million) by Formulation Type, 2025-2035
  • Figure 88: Latin America Market Value (USD Million) by Skin Type, 2025-2035
  • Figure 89: Latin America Market Value (USD Million) by Sales Channel, 2025-2035
  • Figure 90: Latin America Market Value (USD Million) by End User, 2025-2035
  • Figure 91: Latin America Market Value (USD Million) by Country, 2025-2035
  • Figure 92: Latin America Market Value (USD Million) Analysis by Country, 2020-2035
  • Figure 93: Latin America Market Volume (Units) Analysis by Country, 2020-2035
  • Figure 94: Latin America Market Value Share (%) and BPS Analysis by Country, 2025-2035
  • Figure 95: Latin America Market Y-o-Y Growth (%) Projections by Country, 2025-2035
  • Figure 96: Latin America Market Value (USD Million) Analysis by Product Type, 2020-2035
  • Figure 97: Latin America Market Volume (Units) Analysis by Product Type, 2020-2035
  • Figure 98: Latin America Market Value Share (%) and BPS Analysis by Product Type, 2025-2035
  • Figure 99: Latin America Market Y-o-Y Growth (%) Projections by Product Type, 2025-2035
  • Figure 100: Latin America Market Value (USD Million) Analysis by Functionality, 2020-2035
  • Figure 101: Latin America Market Volume (Units) Analysis by Functionality, 2020-2035
  • Figure 102: Latin America Market Value Share (%) and BPS Analysis by Functionality, 2025-2035
  • Figure 103: Latin America Market Y-o-Y Growth (%) Projections by Functionality, 2025-2035
  • Figure 104: Latin America Market Value (USD Million) Analysis by Formulation Type, 2020-2035
  • Figure 105: Latin America Market Volume (Units) Analysis by Formulation Type, 2020-2035
  • Figure 106: Latin America Market Value Share (%) and BPS Analysis by Formulation Type, 2025-2035
  • Figure 107: Latin America Market Y-o-Y Growth (%) Projections by Formulation Type, 2025-2035
  • Figure 108: Latin America Market Value (USD Million) Analysis by Skin Type, 2020-2035
  • Figure 109: Latin America Market Volume (Units) Analysis by Skin Type, 2020-2035
  • Figure 110: Latin America Market Value Share (%) and BPS Analysis by Skin Type, 2025-2035
  • Figure 111: Latin America Market Y-o-Y Growth (%) Projections by Skin Type, 2025-2035
  • Figure 112: Latin America Market Value (USD Million) Analysis by Sales Channel, 2020-2035
  • Figure 113: Latin America Market Volume (Units) Analysis by Sales Channel, 2020-2035
  • Figure 114: Latin America Market Value Share (%) and BPS Analysis by Sales Channel, 2025-2035
  • Figure 115: Latin America Market Y-o-Y Growth (%) Projections by Sales Channel, 2025-2035
  • Figure 116: Latin America Market Value (USD Million) Analysis by End User, 2020-2035
  • Figure 117: Latin America Market Volume (Units) Analysis by End User, 2020-2035
  • Figure 118: Latin America Market Value Share (%) and BPS Analysis by End User, 2025-2035
  • Figure 119: Latin America Market Y-o-Y Growth (%) Projections by End User, 2025-2035
  • Figure 120: Latin America Market Attractiveness by Product Type, 2025-2035
  • Figure 121: Latin America Market Attractiveness by Functionality, 2025-2035
  • Figure 122: Latin America Market Attractiveness by Formulation Type, 2025-2035
  • Figure 123: Latin America Market Attractiveness by Skin Type, 2025-2035
  • Figure 124: Latin America Market Attractiveness by Sales Channel, 2025-2035
  • Figure 125: Latin America Market Attractiveness by End User, 2025-2035
  • Figure 126: Latin America Market Attractiveness by Country, 2025-2035
  • Figure 127: Europe Market Value (USD Million) by Product Type, 2025-2035
  • Figure 128: Europe Market Value (USD Million) by Functionality, 2025-2035
  • Figure 129: Europe Market Value (USD Million) by Formulation Type, 2025-2035
  • Figure 130: Europe Market Value (USD Million) by Skin Type, 2025-2035
  • Figure 131: Europe Market Value (USD Million) by Sales Channel, 2025-2035
  • Figure 132: Europe Market Value (USD Million) by End User, 2025-2035
  • Figure 133: Europe Market Value (USD Million) by Country, 2025-2035
  • Figure 134: Europe Market Value (USD Million) Analysis by Country, 2020-2035
  • Figure 135: Europe Market Volume (Units) Analysis by Country, 2020-2035
  • Figure 136: Europe Market Value Share (%) and BPS Analysis by Country, 2025-2035
  • Figure 137: Europe Market Y-o-Y Growth (%) Projections by Country, 2025-2035
  • Figure 138: Europe Market Value (USD Million) Analysis by Product Type, 2020-2035
  • Figure 139: Europe Market Volume (Units) Analysis by Product Type, 2020-2035
  • Figure 140: Europe Market Value Share (%) and BPS Analysis by Product Type, 2025-2035
  • Figure 141: Europe Market Y-o-Y Growth (%) Projections by Product Type, 2025-2035
  • Figure 142: Europe Market Value (USD Million) Analysis by Functionality, 2020-2035
  • Figure 143: Europe Market Volume (Units) Analysis by Functionality, 2020-2035
  • Figure 144: Europe Market Value Share (%) and BPS Analysis by Functionality, 2025-2035
  • Figure 145: Europe Market Y-o-Y Growth (%) Projections by Functionality, 2025-2035
  • Figure 146: Europe Market Value (USD Million) Analysis by Formulation Type, 2020-2035
  • Figure 147: Europe Market Volume (Units) Analysis by Formulation Type, 2020-2035
  • Figure 148: Europe Market Value Share (%) and BPS Analysis by Formulation Type, 2025-2035
  • Figure 149: Europe Market Y-o-Y Growth (%) Projections by Formulation Type, 2025-2035
  • Figure 150: Europe Market Value (USD Million) Analysis by Skin Type, 2020-2035
  • Figure 151: Europe Market Volume (Units) Analysis by Skin Type, 2020-2035
  • Figure 152: Europe Market Value Share (%) and BPS Analysis by Skin Type, 2025-2035
  • Figure 153: Europe Market Y-o-Y Growth (%) Projections by Skin Type, 2025-2035
  • Figure 154: Europe Market Value (USD Million) Analysis by Sales Channel, 2020-2035
  • Figure 155: Europe Market Volume (Units) Analysis by Sales Channel, 2020-2035
  • Figure 156: Europe Market Value Share (%) and BPS Analysis by Sales Channel, 2025-2035
  • Figure 157: Europe Market Y-o-Y Growth (%) Projections by Sales Channel, 2025-2035
  • Figure 158: Europe Market Value (USD Million) Analysis by End User, 2020-2035
  • Figure 159: Europe Market Volume (Units) Analysis by End User, 2020-2035
  • Figure 160: Europe Market Value Share (%) and BPS Analysis by End User, 2025-2035
  • Figure 161: Europe Market Y-o-Y Growth (%) Projections by End User, 2025-2035
  • Figure 162: Europe Market Attractiveness by Product Type, 2025-2035
  • Figure 163: Europe Market Attractiveness by Functionality, 2025-2035
  • Figure 164: Europe Market Attractiveness by Formulation Type, 2025-2035
  • Figure 165: Europe Market Attractiveness by Skin Type, 2025-2035
  • Figure 166: Europe Market Attractiveness by Sales Channel, 2025-2035
  • Figure 167: Europe Market Attractiveness by End User, 2025-2035
  • Figure 168: Europe Market Attractiveness by Country, 2025-2035
  • Figure 169: East Asia Market Value (USD Million) by Product Type, 2025-2035
  • Figure 170: East Asia Market Value (USD Million) by Functionality, 2025-2035
  • Figure 171: East Asia Market Value (USD Million) by Formulation Type, 2025-2035
  • Figure 172: East Asia Market Value (USD Million) by Skin Type, 2025-2035
  • Figure 173: East Asia Market Value (USD Million) by Sales Channel, 2025-2035
  • Figure 174: East Asia Market Value (USD Million) by End User, 2025-2035
  • Figure 175: East Asia Market Value (USD Million) by Country, 2025-2035
  • Figure 176: East Asia Market Value (USD Million) Analysis by Country, 2020-2035
  • Figure 177: East Asia Market Volume (Units) Analysis by Country, 2020-2035
  • Figure 178: East Asia Market Value Share (%) and BPS Analysis by Country, 2025-2035
  • Figure 179: East Asia Market Y-o-Y Growth (%) Projections by Country, 2025-2035
  • Figure 180: East Asia Market Value (USD Million) Analysis by Product Type, 2020-2035
  • Figure 181: East Asia Market Volume (Units) Analysis by Product Type, 2020-2035
  • Figure 182: East Asia Market Value Share (%) and BPS Analysis by Product Type, 2025-2035
  • Figure 183: East Asia Market Y-o-Y Growth (%) Projections by Product Type, 2025-2035
  • Figure 184: East Asia Market Value (USD Million) Analysis by Functionality, 2020-2035
  • Figure 185: East Asia Market Volume (Units) Analysis by Functionality, 2020-2035
  • Figure 186: East Asia Market Value Share (%) and BPS Analysis by Functionality, 2025-2035
  • Figure 187: East Asia Market Y-o-Y Growth (%) Projections by Functionality, 2025-2035
  • Figure 188: East Asia Market Value (USD Million) Analysis by Formulation Type, 2020-2035
  • Figure 189: East Asia Market Volume (Units) Analysis by Formulation Type, 2020-2035
  • Figure 190: East Asia Market Value Share (%) and BPS Analysis by Formulation Type, 2025-2035
  • Figure 191: East Asia Market Y-o-Y Growth (%) Projections by Formulation Type, 2025-2035
  • Figure 192: East Asia Market Value (USD Million) Analysis by Skin Type, 2020-2035
  • Figure 193: East Asia Market Volume (Units) Analysis by Skin Type, 2020-2035
  • Figure 194: East Asia Market Value Share (%) and BPS Analysis by Skin Type, 2025-2035
  • Figure 195: East Asia Market Y-o-Y Growth (%) Projections by Skin Type, 2025-2035
  • Figure 196: East Asia Market Value (USD Million) Analysis by Sales Channel, 2020-2035
  • Figure 197: East Asia Market Volume (Units) Analysis by Sales Channel, 2020-2035
  • Figure 198: East Asia Market Value Share (%) and BPS Analysis by Sales Channel, 2025-2035
  • Figure 199: East Asia Market Y-o-Y Growth (%) Projections by Sales Channel, 2025-2035
  • Figure 200: East Asia Market Value (USD Million) Analysis by End User, 2020-2035
  • Figure 201: East Asia Market Volume (Units) Analysis by End User, 2020-2035
  • Figure 202: East Asia Market Value Share (%) and BPS Analysis by End User, 2025-2035
  • Figure 203: East Asia Market Y-o-Y Growth (%) Projections by End User, 2025-2035
  • Figure 204: East Asia Market Attractiveness by Product Type, 2025-2035
  • Figure 205: East Asia Market Attractiveness by Functionality, 2025-2035
  • Figure 206: East Asia Market Attractiveness by Formulation Type, 2025-2035
  • Figure 207: East Asia Market Attractiveness by Skin Type, 2025-2035
  • Figure 208: East Asia Market Attractiveness by Sales Channel, 2025-2035
  • Figure 209: East Asia Market Attractiveness by End User, 2025-2035
  • Figure 210: East Asia Market Attractiveness by Country, 2025-2035
  • Figure 211: South Asia & Pacific Market Value (USD Million) by Product Type, 2025-2035
  • Figure 212: South Asia & Pacific Market Value (USD Million) by Functionality, 2025-2035
  • Figure 213: South Asia & Pacific Market Value (USD Million) by Formulation Type, 2025-2035
  • Figure 214: South Asia & Pacific Market Value (USD Million) by Skin Type, 2025-2035
  • Figure 215: South Asia & Pacific Market Value (USD Million) by Sales Channel, 2025-2035
  • Figure 216: South Asia & Pacific Market Value (USD Million) by End User, 2025-2035
  • Figure 217: South Asia & Pacific Market Value (USD Million) by Country, 2025-2035
  • Figure 218: South Asia & Pacific Market Value (USD Million) Analysis by Country, 2020-2035
  • Figure 219: South Asia & Pacific Market Volume (Units) Analysis by Country, 2020-2035
  • Figure 220: South Asia & Pacific Market Value Share (%) and BPS Analysis by Country, 2025-2035
  • Figure 221: South Asia & Pacific Market Y-o-Y Growth (%) Projections by Country, 2025-2035
  • Figure 222: South Asia & Pacific Market Value (USD Million) Analysis by Product Type, 2020-2035
  • Figure 223: South Asia & Pacific Market Volume (Units) Analysis by Product Type, 2020-2035
  • Figure 224: South Asia & Pacific Market Value Share (%) and BPS Analysis by Product Type, 2025-2035
  • Figure 225: South Asia & Pacific Market Y-o-Y Growth (%) Projections by Product Type, 2025-2035
  • Figure 226: South Asia & Pacific Market Value (USD Million) Analysis by Functionality, 2020-2035
  • Figure 227: South Asia & Pacific Market Volume (Units) Analysis by Functionality, 2020-2035
  • Figure 228: South Asia & Pacific Market Value Share (%) and BPS Analysis by Functionality, 2025-2035
  • Figure 229: South Asia & Pacific Market Y-o-Y Growth (%) Projections by Functionality, 2025-2035
  • Figure 230: South Asia & Pacific Market Value (USD Million) Analysis by Formulation Type, 2020-2035
  • Figure 231: South Asia & Pacific Market Volume (Units) Analysis by Formulation Type, 2020-2035
  • Figure 232: South Asia & Pacific Market Value Share (%) and BPS Analysis by Formulation Type, 2025-2035
  • Figure 233: South Asia & Pacific Market Y-o-Y Growth (%) Projections by Formulation Type, 2025-2035
  • Figure 234: South Asia & Pacific Market Value (USD Million) Analysis by Skin Type, 2020-2035
  • Figure 235: South Asia & Pacific Market Volume (Units) Analysis by Skin Type, 2020-2035
  • Figure 236: South Asia & Pacific Market Value Share (%) and BPS Analysis by Skin Type, 2025-2035
  • Figure 237: South Asia & Pacific Market Y-o-Y Growth (%) Projections by Skin Type, 2025-2035
  • Figure 238: South Asia & Pacific Market Value (USD Million) Analysis by Sales Channel, 2020-2035
  • Figure 239: South Asia & Pacific Market Volume (Units) Analysis by Sales Channel, 2020-2035
  • Figure 240: South Asia & Pacific Market Value Share (%) and BPS Analysis by Sales Channel, 2025-2035
  • Figure 241: South Asia & Pacific Market Y-o-Y Growth (%) Projections by Sales Channel, 2025-2035
  • Figure 242: South Asia & Pacific Market Value (USD Million) Analysis by End User, 2020-2035
  • Figure 243: South Asia & Pacific Market Volume (Units) Analysis by End User, 2020-2035
  • Figure 244: South Asia & Pacific Market Value Share (%) and BPS Analysis by End User, 2025-2035
  • Figure 245: South Asia & Pacific Market Y-o-Y Growth (%) Projections by End User, 2025-2035
  • Figure 246: South Asia & Pacific Market Attractiveness by Product Type, 2025-2035
  • Figure 247: South Asia & Pacific Market Attractiveness by Functionality, 2025-2035
  • Figure 248: South Asia & Pacific Market Attractiveness by Formulation Type, 2025-2035
  • Figure 249: South Asia & Pacific Market Attractiveness by Skin Type, 2025-2035
  • Figure 250: South Asia & Pacific Market Attractiveness by Sales Channel, 2025-2035
  • Figure 251: South Asia & Pacific Market Attractiveness by End User, 2025-2035
  • Figure 252: South Asia & Pacific Market Attractiveness by Country, 2025-2035
  • Figure 253: MEA Market Value (USD Million) by Product Type, 2025-2035
  • Figure 254: MEA Market Value (USD Million) by Functionality, 2025-2035
  • Figure 255: MEA Market Value (USD Million) by Formulation Type, 2025-2035
  • Figure 256: MEA Market Value (USD Million) by Skin Type, 2025-2035
  • Figure 257: MEA Market Value (USD Million) by Sales Channel, 2025-2035
  • Figure 258: MEA Market Value (USD Million) by End User, 2025-2035
  • Figure 259: MEA Market Value (USD Million) by Country, 2025-2035
  • Figure 260: MEA Market Value (USD Million) Analysis by Country, 2020-2035
  • Figure 261: MEA Market Volume (Units) Analysis by Country, 2020-2035
  • Figure 262: MEA Market Value Share (%) and BPS Analysis by Country, 2025-2035
  • Figure 263: MEA Market Y-o-Y Growth (%) Projections by Country, 2025-2035
  • Figure 264: MEA Market Value (USD Million) Analysis by Product Type, 2020-2035
  • Figure 265: MEA Market Volume (Units) Analysis by Product Type, 2020-2035
  • Figure 266: MEA Market Value Share (%) and BPS Analysis by Product Type, 2025-2035
  • Figure 267: MEA Market Y-o-Y Growth (%) Projections by Product Type, 2025-2035
  • Figure 268: MEA Market Value (USD Million) Analysis by Functionality, 2020-2035
  • Figure 269: MEA Market Volume (Units) Analysis by Functionality, 2020-2035
  • Figure 270: MEA Market Value Share (%) and BPS Analysis by Functionality, 2025-2035
  • Figure 271: MEA Market Y-o-Y Growth (%) Projections by Functionality, 2025-2035
  • Figure 272: MEA Market Value (USD Million) Analysis by Formulation Type, 2020-2035
  • Figure 273: MEA Market Volume (Units) Analysis by Formulation Type, 2020-2035
  • Figure 274: MEA Market Value Share (%) and BPS Analysis by Formulation Type, 2025-2035
  • Figure 275: MEA Market Y-o-Y Growth (%) Projections by Formulation Type, 2025-2035
  • Figure 276: MEA Market Value (USD Million) Analysis by Skin Type, 2020-2035
  • Figure 277: MEA Market Volume (Units) Analysis by Skin Type, 2020-2035
  • Figure 278: MEA Market Value Share (%) and BPS Analysis by Skin Type, 2025-2035
  • Figure 279: MEA Market Y-o-Y Growth (%) Projections by Skin Type, 2025-2035
  • Figure 280: MEA Market Value (USD Million) Analysis by Sales Channel, 2020-2035
  • Figure 281: MEA Market Volume (Units) Analysis by Sales Channel, 2020-2035
  • Figure 282: MEA Market Value Share (%) and BPS Analysis by Sales Channel, 2025-2035
  • Figure 283: MEA Market Y-o-Y Growth (%) Projections by Sales Channel, 2025-2035
  • Figure 284: MEA Market Value (USD Million) Analysis by End User, 2020-2035
  • Figure 285: MEA Market Volume (Units) Analysis by End User, 2020-2035
  • Figure 286: MEA Market Value Share (%) and BPS Analysis by End User, 2025-2035
  • Figure 287: MEA Market Y-o-Y Growth (%) Projections by End User, 2025-2035
  • Figure 288: MEA Market Attractiveness by Product Type, 2025-2035
  • Figure 289: MEA Market Attractiveness by Functionality, 2025-2035
  • Figure 290: MEA Market Attractiveness by Formulation Type, 2025-2035
  • Figure 291: MEA Market Attractiveness by Skin Type, 2025-2035
  • Figure 292: MEA Market Attractiveness by Sales Channel, 2025-2035
  • Figure 293: MEA Market Attractiveness by End User, 2025-2035
  • Figure 294: MEA Market Attractiveness by Country, 2025-2035

Frequently Asked Questions

How big is the Ectoin-Infused Skincare Market in 2025?

The global Ectoin-Infused Skincare Market is estimated to be valued at USD 435.6 million in 2025.

What will be the size of the Ectoin-Infused Skincare Market in 2035?

The market size for the Ectoin-Infused Skincare Market is projected to reach approximately USD 779.2 million by 2035.

How much will be the Ectoin-Infused Skincare Market growth between 2025 and 2035?

The Ectoin-Infused Skincare Market is expected to expand at a compound annual growth rate (CAGR) of 6.0% between 2025 and 2035.

What are the key product types in the Ectoin-Infused Skincare Market?

The key product types include face creams & moisturizers, serums & ampoules, body lotions & creams, cleansers & toners, sunscreens, face masks, lip care, and eye creams & gels.

Which product segment will contribute the most in the Ectoin-Infused Skincare Market in 2025?

In terms of product type, face creams & moisturizers and body lotions & creams are each projected to command 20% market share in 2025, leading the segment.

Explore Similar Insights

Future Market Insights

Ectoin-Infused Skincare Market