Active Charcoal Complexes Market Size and Share Forecast Outlook 2025 to 2035

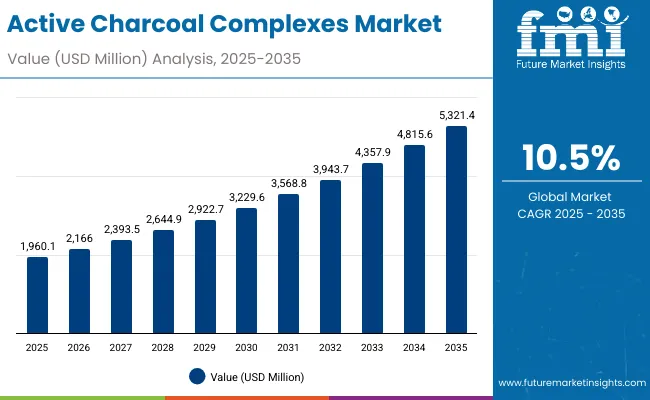
A valuation of USD 5,321.4 million is projected for the Active Charcoal Complexes Market by 2035, rising from an estimated USD 1,960.1 million in 2025. This reflects an absolute increase of USD 3,361.3 million over the decade, equivalent to 171% growth. The market is forecast to expand at a compound annual growth rate (CAGR) of 10.5%, resulting in nearly a 2.7-fold increase during the ten-year period.
Quick Stats for ACTIVE CHARCOAL COMPLEXES Market

  • Active Charcoal Complexes Market Value (2025): USD 1,960.1 million
  • Active Charcoal Complexes Market Forecast Value (2035): USD 5,321.4 million
  • Active Charcoal Complexes Market Forecast CAGR (2025 to 2035): 10.5%
  • Leading Segment in Active Charcoal Complexes Market in 2025: Others (includes cleansers, soaps, and toothpaste) - 54.5%
  • Key Growth Regions in the Active Charcoal Complexes Market: Asia-Pacific, North America, Europe
  • Top Key Players in Active Charcoal Complexes Market: Unilever, L’Oréal, The Himalaya Drug Company, Procter & Gamble, Beiersdorf AG, Colgate-Palmolive Company, Shiseido Company, The Body Shop, Origins, Clinique

Active Charcoal Complexes Market

Active Charcoal Complexes Market Key Takeaways

Metric Value
Market Estimated Value in (2025E) USD 1,960.1 million
Market Forecast Value in (2035F) USD 5,321.4 million
Forecast CAGR (2025 to 2035) 10.50%

Between 2025 and 2030, the market is expected to grow from USD 1,960.1 million to USD 3,229.6 million, adding USD 1,269.5 million in value. This first half of the forecast window is projected to account for approximately 38% of total decade growth. Steady demand for detoxifying and oil-control formulations is anticipated to drive growth, supported by consumer preference for natural ingredients and dermatologically safe products. Within this timeframe, bamboo-derived charcoal is expected to outperform other sources, while masks and cleansers gain wider adoption across skincare regimes.

The second half, from 2030 to 2035, is likely to contribute USD 2,091.8 million around 62 % of total growth as the market reaches USD 5,321.4 million. Expansion is expected to be reinforced by ingredient innovation, e-commerce penetration, and wellness-driven consumer behavior. Emerging markets such as China and India, with estimated CAGRs of 21.9% and 20.8% respectively, are poised to lead this transformation by adopting sustainable sourcing practices and region-specific product development.

From 2020 to 2024, the market grew from USD 1,140.5 million to USD 1,851.8 million, driven by increasing consumer preference for toxin-absorbing skincare solutions. During this period, leading manufacturers controlled approximately 65-70% of revenue, with Unilever and L’Oréal emerging as dominant players due to expansive distribution networks and robust branding.

Hardware-equivalent revenue models were not applicable in this segment. Instead, growth was propelled by continuous product innovations, sustainable packaging trends, and expanding penetration in male grooming and natural cosmetics. Recurring purchases of mask and cleanser formats maintained demand velocity.

In 2025, demand is projected to surpass USD 1.96 billion, and a major shift toward natural, sulfate-free, and hybrid skincare products will define the next wave of competition. Digital-first beauty brands emphasizing ingredient transparency, multifunctionality, and dermatological validation are expected to disrupt incumbent market positions.

Value will increasingly be captured through clean-label positioning, direct-to-consumer (DTC) strategies, and personalized skincare solutions powered by AI-driven skin diagnostics and microbiome-focused R&D.

Why the Active Charcoal Complexes Market is growing?

Widespread consumer demand for clean-label and natural skincare products has been observed as a core driver of growth in the Active Charcoal Complexes Market. The detoxifying and deep-cleansing properties of activated charcoal have been increasingly preferred in face masks, cleansers, and toothpaste applications. This growth has been supported by heightened awareness of pollution-induced skin damage and rising interest in oil-control and exfoliating routines. Products formulated with bamboo-derived charcoal have been favored due to their perceived sustainability and plant-based origin.

Global expansion has been further accelerated by the shift toward wellness-centric self-care, especially across Asia-Pacific markets. Dermatologist endorsements and scientific validations have reinforced consumer trust, while e-commerce platforms have enabled rapid product adoption. Strong growth has also been triggered by premiumization trends and ingredient traceability, both of which are being prioritized by millennial and Gen Z consumers. Continued innovation in charcoal sourcing and multifunctional formulations is expected to sustain momentum across both developed and emerging economies.

Segmental Analysis

The Active Charcoal Complexes Market has been segmented by function, source, and product type to provide a structured understanding of its demand dynamics. By function, products have been categorized based on their intended dermatological benefits, with detoxifying and exfoliating applications showing high traction. Segmentation by source reflects consumer preference for ingredient origin, distinguishing between bamboo-derived charcoal and other charcoal types.

The product type classification encompasses format-specific preferences such as masks, cleansers, soaps, and toothpastes, driven by evolving skincare and oral care habits. These segments have been shaped by regional consumption patterns, regulatory acceptance, and emerging trends in personal care. Over the forecast period, strong growth across all segments is expected to be observed as sustainability narratives, efficacy claims, and wellness-driven routines continue to influence purchasing decisions.
Insights into the Function Segment with Detoxifying Leading in Market Share

Active Charcoal Complexes Market By Function

Function Market Value Share, 2025
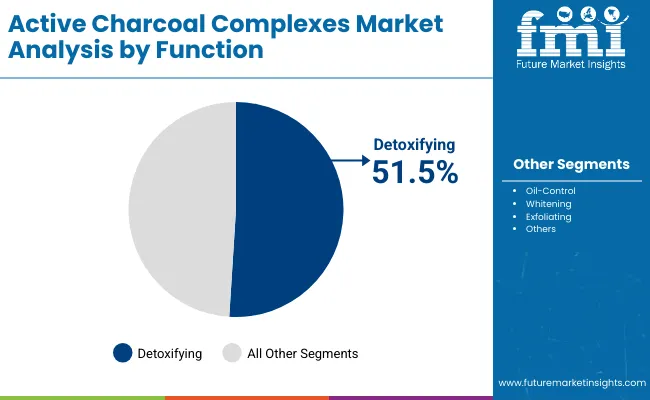
Detoxifying 51.5%
Others 48.5%

The detoxifying segment is forecasted to lead with a 51.5% value share in 2025. Growing awareness around pollution-induced skin damage has accelerated consumer interest in charcoal products with pore-cleansing benefits. Dermatologically positioned detox solutions are gaining preference, particularly among urban users. With charcoal's high absorption capacity, products in this segment have been formulated to address oily skin, acne, and environmental exposure. In response, leading brands have been expanding detox-focused product lines. Continuous innovation in hybrid detox products and the rise of skin-prep routines in beauty regimens are expected to reinforce segment dominance through the decade.
Insights into the Source Segment with Bamboo-derived Charcoal Gaining Preference

Active Charcoal Complexes Market By Source

Source Market Value Share, 2025
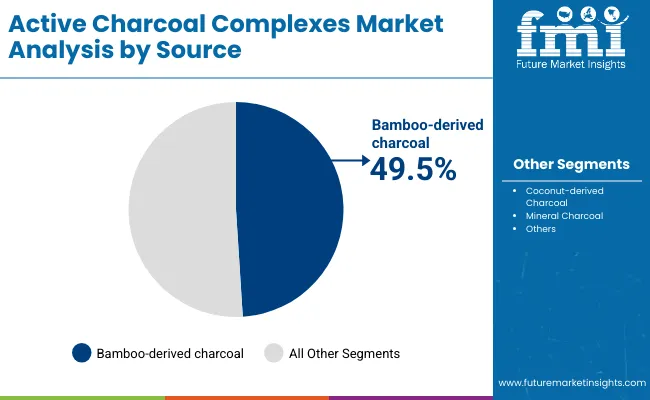
Bamboo-derived charcoal 49.5%
Others 50.5%

Bamboo-derived charcoal is anticipated to hold a 49.5% share of market value in 2025. This rise in preference is being driven by its association with sustainable sourcing and eco-friendly marketing claims. Brands are increasingly highlighting bamboo charcoal as a cleaner, renewable alternative, appealing to environmentally conscious consumers. The material’s high surface area and toxin-absorbing ability have made it ideal for skincare and oral care formulations. Asian countries, especially China and Japan, are expected to lead usage of bamboo-based charcoal due to local availability and cultural familiarity. As carbon-neutral formulations gain traction, the bamboo-derived segment is likely to strengthen further.
Insights into the Technology Segment with Focus on Laser Triangulation

Active Charcoal Complexes Market By Product

Product Type Market Value Share, 2025
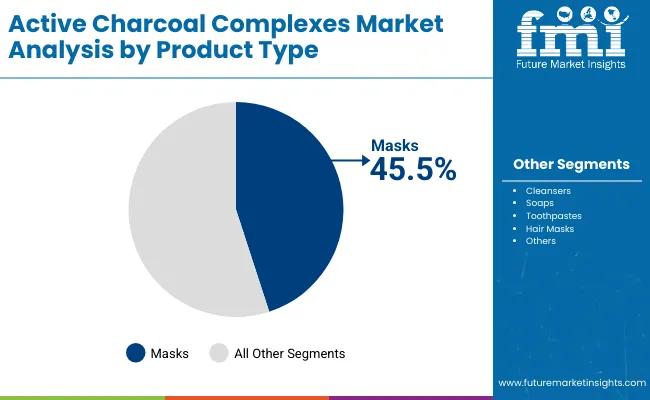
Masks 45.5%
Others 54.5%

The mask segment is projected to contribute 45.5% of total value in 2025. Charcoal masks have been popularized as instant detox solutions that offer visible skincare benefits. Positioned as premium self-care products, masks are favored in weekly routines and are widely promoted through beauty influencers. Peel-off and cream-based mask formats have gained significant attention, especially among younger and urban consumers. While daily-use formats like cleansers continue to grow, masks retain a strong perception of efficacy and indulgence. Product innovation, including charcoal-infused sheet masks and blendable clays, is expected to boost engagement. Expansion in e-commerce and clean beauty positioning will likely sustain this segment’s upward trajectory.

What are the Drivers, Restraints, and Key Trends of the Active Charcoal Complexes Market?

Growing awareness of micro-pollution, ingredient transparency, and sensory-driven skin detoxification has redefined consumer expectations, prompting advanced ingredient innovation in the Active Charcoal Complexes Market. Yet, structural bottlenecks in sourcing and standardization continue to shape market behavior across regions.

Customization of Functionality through Ingredient Hybridization

Product development has increasingly been influenced by the integration of active charcoal with probiotics, botanicals, or clays to offer multi-functional outcomes detox, brightening, and oil-balance in one formulation. This hybridization approach is being adopted not only to differentiate offerings but also to increase consumer compliance in repeat purchases. Functional layering has allowed brands to expand into adjacent personal care verticals without diluting core charcoal positioning. As a result, innovation pipelines are being structured around dual-benefit and time-efficient product concepts, especially in masks and rinse-off categories.

AI-Led Personalization in Charcoal Skincare

AI-powered diagnostics are being embedded into retail and online platforms to match consumers with ingredient-specific regimens. In this context, active charcoal has been algorithmically positioned for urban skin types, oily zones, and pollution-exposed profiles. This analytical personalization is enabling brands to justify charcoal’s efficacy via micro-targeted skincare journeys. Tech-integrated ingredient recommendations are expected to redefine how active charcoal is marketed, tracked, and optimized across skin segments particularly in Asia, where smartphone-based skincare mapping has seen widespread adoption.
Analysis of Active Charcoal Complexes Market By Key Countries

Active Charcoal Complexes Market By Country

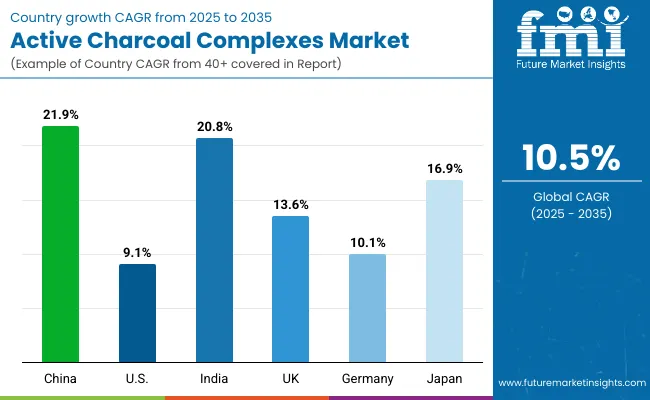
Countries CAGR
China 21.9%
USA 9.1%
India 20.8%
UK 13.6%
Germany 10.1%
Japan 16.9%

The Active Charcoal Complexes Market has demonstrated uneven geographic momentum, shaped by regulatory frameworks, consumer education levels, and ingredient localization capabilities. Across major economies, varying rates of adoption have been recorded, reflecting differences in dermocosmetic maturity, raw material accessibility, and digital beauty penetration.

Asia-Pacific is expected to remain the fastest-growing region, led by China with a CAGR of 21.9% and India at 20.8%. In China, growth is being reinforced through bamboo-derived charcoal innovation, sustainability branding, and high mobile-commerce integration. In India, market expansion is being enabled by herbal hybridization, influencer-based consumer acquisition, and mass retail activation across Tier 2 and Tier 3 cities.

Japan, at 16.9% CAGR, is gaining traction through anti-aging charcoal formats and wellness-oriented personalization in skincare. The UK and Germany are forecast to grow at 13.6% and 10.1% respectively, where dermatologically tested, clean-label products dominate shelf space and pharmacy distribution channels. Both countries are emphasizing efficacy claims and ingredient disclosure norms.

In contrast, the U.S. market, projected to grow at 9.1%, remains driven by established brands leveraging detox narratives and product bundling strategies. Consumer demand in North America is more function-led than ingredient-led, with emphasis on visible results, clinical support, and online dermatologist recommendations. Going forward, growth leadership is expected to remain concentrated in Asia.
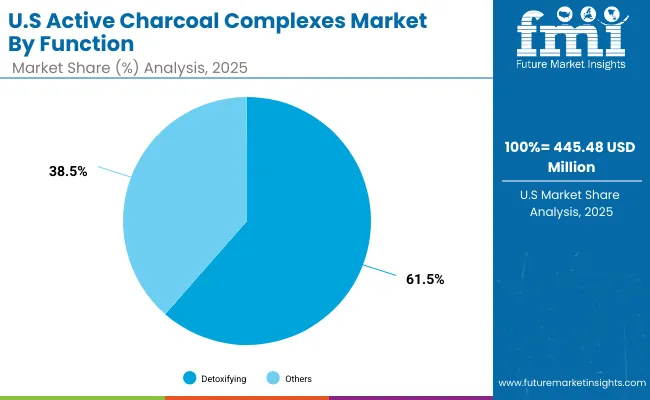
Sales Outlook for Active Charcoal Complexes in the United States

Active Charcoal Complexes Market Usa

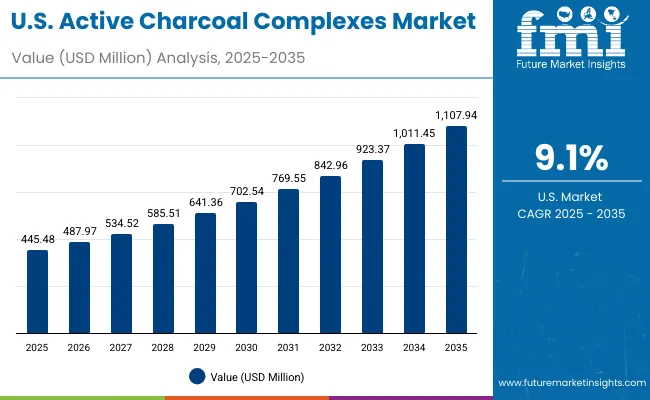
Year USA Active Charcoal Complexes Market (USD Million)
2025 445.48
2026 487.97
2027 534.52
2028 585.51
2029 641.36
2030 702.54
2031 769.55
2032 842.96
2033 923.37
2034 1,011.45
2035 1,107.94

The Active Charcoal Complexes Market in the United States is projected to grow from USD 445.48 million in 2025 to USD 1,107.94 million by 2035, reflecting a steady year-on-year expansion. A CAGR of approximately 9.1% has been estimated for the period, underscoring consistent consumer engagement across both mass and prestige skincare categories.

Growth is expected to be shaped by rising demand for detoxifying skincare regimens, dermatologist-backed endorsements, and clean-label formulations. The integration of charcoal-based products into daily routines has been accelerated by product bundling strategies and cross-category marketing in oral care and facial cleansers. While legacy brands continue to lead distribution, private label entrants are capturing niche opportunities in functional skincare and male grooming.

Digital-first platforms are enabling wider reach for charcoal-infused offerings, especially through influencer-driven education and skin-type personalization. Urban centers have emerged as early adoption zones, though suburban markets are witnessing increasing traction due to retail availability and dermocosmetic awareness.

  • Detoxifying charcoal cleansers and exfoliants are being prioritized for oil-prone and acne-sensitive skin types
  • Charcoal toothpaste has seen increased pharmacy placement due to enamel-safe claims
  • Hybrid products combining charcoal with niacinamide, clay, or salicylic acid are being positioned for multi-action benefits

Growth and Expansion Outlook for Active Charcoal Complexes Market in the United Kingdom

A CAGR of 13.6% has been projected for the UK Active Charcoal Complexes Market between 2025 and 2035, reflecting an expanding base of ingredient-conscious skincare users. Growth is being facilitated by sustainability-driven preferences and regulatory support for clean-label formulations.

Consumer behavior is being reshaped by heightened sensitivity to air pollution and oil-related skin issues. Ingredient traceability is being prioritized by Gen Z and millennial shoppers. Brand storytelling centered around bamboo-derived charcoal and zero-waste packaging has found strong resonance. As omni-channel distribution expands and value-tier brands innovate, charcoal’s role in mainstream beauty routines is expected to deepen.

  • Retail pharmacy chains are scaling charcoal-based offerings with dermatologist approvals
  • Clinical claims and skin compatibility testing are emphasized for consumer trust
  • Hybrid personal care (charcoal + botanical) products are receiving strong shelf rotation
  • Digital beauty consultations are driving personalized product uptake

Growth and Expansion Outlook for Active Charcoal Complexes Market in India

India’s Active Charcoal Complexes Market is forecast to expand at a CAGR of 20.8% from 2025 to 2035, positioning it among the fastest-growing countries globally. Growth is being driven by Ayurveda-modern hybridization, local ingredient processing, and mass-scale retail activation.

Domestic brands are integrating active charcoal into traditional beauty narratives, offering products aligned with sweat-prone, oily, and acne-sensitive skin types. E-commerce platforms and regional D2C brands are educating first-time users via influencer-based outreach. Product acceptance is also being influenced by festival-season skincare routines. As FMCG giants increase rural distribution and pricing strategies, broad-based adoption is likely to be sustained.

  • Tier 2 and Tier 3 city penetration is accelerating charcoal product adoption
  • Charcoal-based soaps and cleansers are promoted as oil-balancing and purifying solutions
  • Cross-category expansion includes toothpaste, face wash, and shampoo formats
  • Low-cost SKUs and sachet packs are supporting rural demand

Sales Outlook for Active Charcoal Complexes in China

China is expected to lead the global Active Charcoal Complexes Market with a CAGR of 21.9% between 2025 and 2035. Market evolution is being shaped by bamboo-derived charcoal demand, government sustainability goals, and domestic R&D in clean beauty.

Consumer demand has moved beyond novelty toward results-backed performance, especially in urban tier 1 cities. App-based skin diagnostics and AI-led personalization have increased conversion in online channels. The market is increasingly influenced by dermatologist-led livestreaming, which boosts uptake of specialty charcoal formats. Localized ingredient sourcing, eco-labels, and QR code-enabled transparency are expected to further accelerate market penetration.
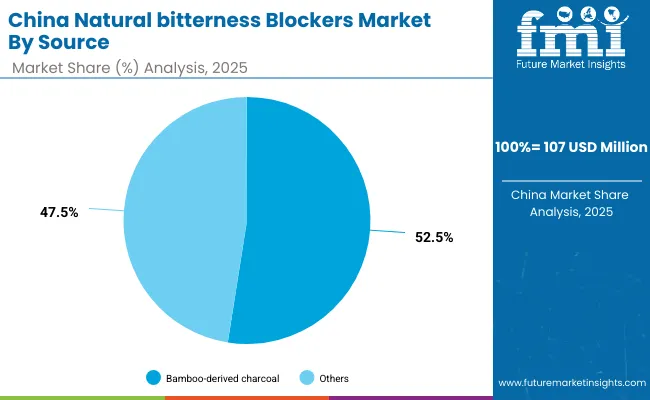
  • Bamboo-derived charcoal accounts for over half the category's value in 2025
  • Premium skincare players are bundling charcoal with TCM (Traditional Chinese Medicine) elements
  • Cross-border e-commerce is fueling K-beauty and C-beauty charcoal mask adoption
  • Ingredient-conscious parents are driving demand in teen skincare segments

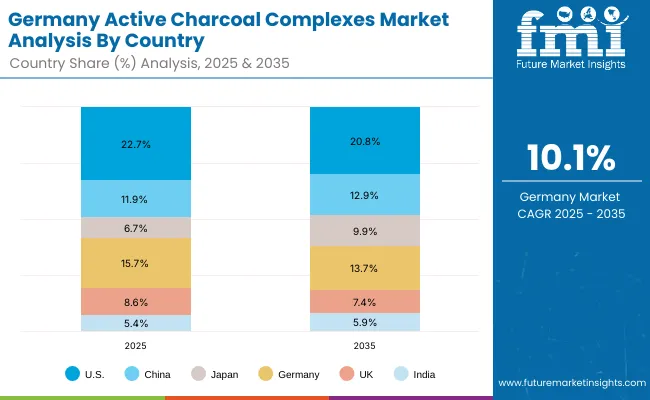
In-depth Analysis of Active Charcoal Complexes in Germany

Active Charcoal Complexes Market Germany

Countries 2025
USA 22.7%
China 11.9%
Japan 6.7%
Germany 15.7%
UK 8.6%
India 5.4%
Countries 2035
USA 20.8%
China 12.9%
Japan 9.9%
Germany 13.7%
UK 7.4%
India 5.9%

Germany is projected to grow at a CAGR of 10.1% through 2035, supported by clean-label regulations, pharmacy-led distribution, and consumer preference for clinical-grade skincare. Charcoal-based products are positioned more as functional than trend-led in this market.

The German market places high emphasis on efficacy, ingredient minimalism, and dermatological validation. Active charcoal is being formulated into rinse-off products with controlled dosage, often paired with anti-inflammatory ingredients. Preference for fragrance-free and pH-balanced formulations is impacting product development. As sustainability certifications and recyclable packaging become mandatory, manufacturers are revising formulations and marketing. Future volume growth is likely to arise from science-backed innovations rather than promotional hype.
  • Apothecary retail formats dominate charcoal skincare placements
  • Clinical testing and ingredient certifications are required for mass-market penetration
  • Detox + sensitive-skin dual claims are gaining ground
  • Private-label and BDIH-certified brands are outperforming trend-driven imports

Growth Outlook for Active Charcoal Complexes Market in Japan

Active Charcoal Complexes Market Japan

Segment Market Value Share, 2025
Skincare Formats (Masks, Cleansers) 85%
Oral Care & Others (Toothpastes, Soaps) 15%

The Active Charcoal Complexes Market in Japan is projected at approximately USD 131.3 million in 2025, accounting for 6.7% of the global market size. Within the national segment, skincare formats dominate, with strong alignment toward anti-aging and oil-control routines.

Consumer preferences in Japan have been shaped by a cultural emphasis on purification and minimalism, aligning closely with the detoxifying appeal of activated charcoal. A tilt toward hybrid formulations that combine charcoal with green tea, rice enzymes, and hyaluronic acid has been observed, particularly in mask and cleanser categories.

Innovation is being driven by Japanese dermocosmetic brands that emphasize gentle yet deep-cleansing performance, supported by fragrance-free and pH-balanced compositions. Retail expansion through convenience stores and D2C platforms is allowing deeper reach across age groups.

  • Japan holds a 6.7% value share in the global market in 2025
  • Growth is anchored in dermocosmetic-led innovation and hybrid ingredient use
  • Anti-aging and oil-control remain core application areas
  • Demand is strengthened by minimalist skincare rituals and dermatologist-backed claims

Opportunity Analysis of South Korea Active Charcoal Complexes Market

Segment Market Value Share, 2025
Skincare Formats (Masks, Cleansers) 90%
Oral Care & Others (Toothpastes, Soaps) 10%

The Active Charcoal Complexes Market in South Korea is projected at approximately USD 168.6 million in 2025, representing 8.6% of global value. Product development in this market has been strongly influenced by K-beauty innovation, skin-type precision, and export-driven formulation trends.

Charcoal has been positioned less as a standalone functional agent and more as part of multi-ingredient, skin-sensitive systems that align with 5-step and 7-step skincare regimens. Growth is being led by facial masks, pore-care cleansing foams, and tone-correcting charcoal-infused primers.

Major K-beauty brands have incorporated charcoal into seasonal limited editions and dermatologist-led collaborations, allowing for high social media visibility and cross-market resonance. Domestic consumers have demonstrated a preference for skin-purifying but non-stripping products - often formulated with botanical waters, fermented extracts, and amino acid-based surfactants.

  • South Korea holds 8.6% share in the global market in 2025
  • Growth driven by pore-focused, multi-step skincare systems
  • Export-quality innovation fuels both domestic and international demand
  • Ingredient integration with fermented actives and skin barrier enhancers defines premium offerings

Competitive Landscape of Active Charcoal Complexes Market

Active Charcoal Complexes Market By Company

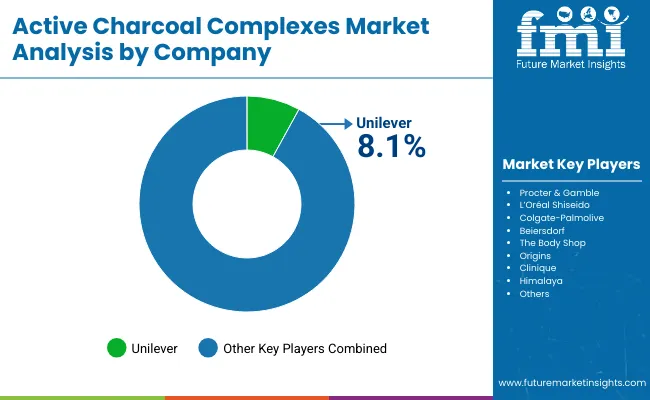
The Active Charcoal Complexes Market is moderately fragmented, with global leaders, mid-sized innovators, and botanical-centric specialists competing across skincare, oral care, and personal hygiene applications. Global FMCG players such as Unilever, L’Oréal, and Colgate-Palmolive have maintained a strong foothold, leveraging established brand equity, global distribution, and deep R&D pipelines. Unilever is estimated to have led the global market in 2024 with a value share of 8.1%, primarily through its detoxifying and deep-cleansing product lines across brands like Dove and Pond’s.

Mid-sized players including Beiersdorf, Shiseido, and The Body Shop have focused on sensitive skin and ethical ingredient positioning, offering targeted charcoal-based formulations under Nivea, Senka, and Tea Tree lines respectively. Their strength lies in dermocosmetic performance and regional customization.

Brand portfolios like Origins, Clinique, and Himalaya have catered to niche and natural product segments, emphasizing botanical infusion, sustainability certifications, and Ayurvedic crossovers. These companies are expanding through e-commerce channels and D2C strategies, especially in Asia and the Middle East.

Differentiation in this market is moving beyond detox claims toward hybrid functionality, ingredient traceability, and personalization ecosystems. Strategic investments are being redirected toward skin-microbiome-safe actives, AI-powered product pairing, and refillable packaging formats to support long-term consumer loyalty.

Key Developments in Active Charcoal Complexes Market

  • In March 2025, L’Oréal launched its new charcoal-based Revitalift Detox Foam Cleanser across Asia-Pacific, emphasizing oil-control and pollution-defense. The launch aligns with rising consumer demand for gentle detox routines and supports the brand’s clean beauty strategy, using sustainable bamboo-derived charcoal and clinically tested formulations targeting urban, oily, and acne-prone skin.
  • In June 2025, Unilever rolled out refillable packaging for its Pond’s Pure Detox Charcoal Mask line in Europe. Designed to reduce plastic waste by 70%, the initiative reflects growing consumer preference for sustainable formats and positions Unilever as a circular economy leader in the detox skincare segment.

Scope of the Report

Item Value
Quantitative Units USD Million
Market Size USD 1,960.1 Million (2025)
Component Skincare Formats (Masks, Cleansers, Soaps), Oral Care (Toothpastes), Haircare, and Others
Functionality Detoxifying, Oil-Control, Whitening, Exfoliating
Source Bamboo-derived Charcoal, Coconut-derived Charcoal, Mineral Charcoal
Product Type Masks, Cleansers, Soaps, Toothpastes, Hair Masks
End-use Channels E-commerce, Pharmacies, Mass Retail, Specialty Stores
Regions Covered North America, Europe, Asia-Pacific, Latin America, Middle East & Africa
Countries Covered United States, Canada, Germany, United Kingdom, France, China, Japan, South Korea, India, Brazil
Key Companies Profiled Unilever, L’Oréal, Colgate-Palmolive, Procter & Gamble, Beiersdorf, Shiseido, The Body Shop, Origins, Clinique, Himalaya

Key Segments

By Source:

  • Bamboo-derived charcoal
  • Coconut-derived charcoal
  • Mineral charcoal

By Function:

  • Detoxifying
  • Oil-control
  • Whitening
  • Exfoliation

By Product Type:

  • Masks
  • Cleansers
  • Soaps
  • Toothpastes

By Channel:

  • E-commerce
  • Mass retail
  • Pharmacies
  • Specialty stores

By Region:

  • North America
  • Latin America
  • Europe
  • East Asia
  • South Asia & Pacific
  • Middle East and Africa

Table of Content

  1. Executive Summary
    • Global Market Outlook
    • Demand-side Trends
    • Supply-side Trends
    • Technology Roadmap Analysis
    • Analysis and Recommendations
  2. Market Overview
    • Market Coverage / Taxonomy
    • Market Definition / Scope / Limitations
  3. Market Background
    • Market Dynamics
      • Drivers
      • Restraints
      • Opportunity
      • Trends
    • Scenario Forecast
      • Demand in Optimistic Scenario
      • Demand in Likely Scenario
      • Demand in Conservative Scenario
    • Opportunity Map Analysis
    • Product Life Cycle Analysis
    • Supply Chain Analysis
      • Supply Side Participants and their Roles
        • Producers
        • Mid-Level Participants (Traders/ Agents/ Brokers)
        • Wholesalers and Distributors
      • Value Added and Value Created at Node in the Supply Chain
      • List of Raw Material Suppliers
      • List of Existing and Potential Buyer’s
    • Investment Feasibility Matrix
    • Value Chain Analysis
      • Profit Margin Analysis
      • Wholesalers and Distributors
      • Retailers
    • PESTLE and Porter’s Analysis
    • Regulatory Landscape
      • By Key Regions
      • By Key Countries
    • Regional Parent Market Outlook
    • Production and Consumption Statistics
    • Import and Export Statistics
  4. Global Market Analysis 2020 to 2024 and Forecast, 2025 to 2035
    • Historical Market Size Value (USD Million) & Volume (Units) Analysis, 2020 to 2024
    • Current and Future Market Size Value (USD Million) & Volume (Units) Projections, 2025 to 2035
      • Y-o-Y Growth Trend Analysis
      • Absolute $ Opportunity Analysis
  5. Global Market Analysis 2020 to 2024 and Forecast 2025 to 2035, By Source
    • Introduction / Key Findings
    • Historical Market Size Value (USD Million) & Volume (Units) Analysis By Source, 2020 to 2024
    • Current and Future Market Size Value (USD Million) & Volume (Units) Analysis and Forecast By Source, 2025 to 2035
      • Bamboo-derived charcoal
      • Coconut-derived charcoal
      • Mineral charcoal
    • Y-o-Y Growth Trend Analysis By Source, 2020 to 2024
    • Absolute $ Opportunity Analysis By Source, 2025 to 2035
  6. Global Market Analysis 2020 to 2024 and Forecast 2025 to 2035, By Function
    • Introduction / Key Findings
    • Historical Market Size Value (USD Million) & Volume (Units) Analysis By Function, 2020 to 2024
    • Current and Future Market Size Value (USD Million) & Volume (Units) Analysis and Forecast By Function, 2025 to 2035
      • Detoxifying
      • Oil-control
      • Whitening
      • Exfoliation
    • Y-o-Y Growth Trend Analysis By Function, 2020 to 2024
    • Absolute $ Opportunity Analysis By Function, 2025 to 2035
  7. Global Market Analysis 2020 to 2024 and Forecast 2025 to 2035, By Product Type
    • Introduction / Key Findings
    • Historical Market Size Value (USD Million) & Volume (Units) Analysis By Product Type, 2020 to 2024
    • Current and Future Market Size Value (USD Million) & Volume (Units) Analysis and Forecast By Product Type, 2025 to 2035
      • Masks
      • Cleansers
      • Soaps
      • Toothpastes
    • Y-o-Y Growth Trend Analysis By Product Type, 2020 to 2024
    • Absolute $ Opportunity Analysis By Product Type, 2025 to 2035
  8. Global Market Analysis 2020 to 2024 and Forecast 2025 to 2035, By Channel
    • Introduction / Key Findings
    • Historical Market Size Value (USD Million) & Volume (Units) Analysis By Channel, 2020 to 2024
    • Current and Future Market Size Value (USD Million) & Volume (Units) Analysis and Forecast By Channel, 2025 to 2035
      • E-commerce
      • Mass retail
      • Pharmacies
      • Specialty stores
    • Y-o-Y Growth Trend Analysis By Channel, 2020 to 2024
    • Absolute $ Opportunity Analysis By Channel, 2025 to 2035
  9. Global Market Analysis 2020 to 2024 and Forecast 2025 to 2035, By Region
    • Introduction
    • Historical Market Size Value (USD Million) & Volume (Units) Analysis By Region, 2020 to 2024
    • Current Market Size Value (USD Million) & Volume (Units) Analysis and Forecast By Region, 2025 to 2035
      • North America
      • Latin America
      • Europe
      • East Asia
      • South Asia & Pacific
      • Middle East and Africa
    • Market Attractiveness Analysis By Region
  10. North America Market Analysis 2020 to 2024 and Forecast 2025 to 2035, By Country
    • Historical Market Size Value (USD Million) & Volume (Units) Trend Analysis By Market Taxonomy, 2020 to 2024
    • Market Size Value (USD Million) & Volume (Units) Forecast By Market Taxonomy, 2025 to 2035
      • By Country
        • USA
        • Canada
      • By Source
      • By Function
      • By Product Type
      • By Channel
    • Market Attractiveness Analysis
      • By Country
      • By Source
      • By Function
      • By Product Type
      • By Channel
    • Key Takeaways
  11. Latin America Market Analysis 2020 to 2024 and Forecast 2025 to 2035, By Country
    • Historical Market Size Value (USD Million) & Volume (Units) Trend Analysis By Market Taxonomy, 2020 to 2024
    • Market Size Value (USD Million) & Volume (Units) Forecast By Market Taxonomy, 2025 to 2035
      • By Country
        • Brazil
        • Mexico
        • Colombia
        • Rest of Latin America
      • By Source
      • By Function
      • By Product Type
      • By Channel
    • Market Attractiveness Analysis
      • By Country
      • By Source
      • By Function
      • By Product Type
      • By Channel
    • Key Takeaways
  12. Europe Market Analysis 2020 to 2024 and Forecast 2025 to 2035, By Country
    • Historical Market Size Value (USD Million) & Volume (Units) Trend Analysis By Market Taxonomy, 2020 to 2024
    • Market Size Value (USD Million) & Volume (Units) Forecast By Market Taxonomy, 2025 to 2035
      • By Country
        • Germany
        • UK
        • France
        • Italy
        • Spain
        • Belgium
        • Netherlands
        • Nordic
        • Switzerland
        • Russia
        • Poland
        • Rest of Europe
      • By Source
      • By Function
      • By Product Type
      • By Channel
    • Market Attractiveness Analysis
      • By Country
      • By Source
      • By Function
      • By Product Type
      • By Channel
    • Key Takeaways
  13. East Asia Market Analysis 2020 to 2024 and Forecast 2025 to 2035, By Country
    • Historical Market Size Value (USD Million) & Volume (Units) Trend Analysis By Market Taxonomy, 2020 to 2024
    • Market Size Value (USD Million) & Volume (Units) Forecast By Market Taxonomy, 2025 to 2035
      • By Country
        • China
        • Japan
        • South Korea
      • By Source
      • By Function
      • By Product Type
      • By Channel
    • Market Attractiveness Analysis
      • By Country
      • By Source
      • By Function
      • By Product Type
      • By Channel
    • Key Takeaways
  14. South Asia & Pacific Market Analysis 2020 to 2024 and Forecast 2025 to 2035, By Country
    • Historical Market Size Value (USD Million) & Volume (Units) Trend Analysis By Market Taxonomy, 2020 to 2024
    • Market Size Value (USD Million) & Volume (Units) Forecast By Market Taxonomy, 2025 to 2035
      • By Country
        • India
        • Thailand
        • Malaysia
        • Indonesia
        • Singapore
        • Vietnam
        • Australia
        • New Zealand
        • Rest of South Asia
      • By Source
      • By Function
      • By Product Type
      • By Channel
    • Market Attractiveness Analysis
      • By Country
      • By Source
      • By Function
      • By Product Type
      • By Channel
    • Key Takeaways
  15. Middle East and Africa Market Analysis 2020 to 2024 and Forecast 2025 to 2035, By Country
    • Historical Market Size Value (USD Million) & Volume (Units) Trend Analysis By Market Taxonomy, 2020 to 2024
    • Market Size Value (USD Million) & Volume (Units) Forecast By Market Taxonomy, 2025 to 2035
      • By Country
        • Turkey
        • UAE
        • Saudi Arabia
        • Israel
        • Other GCC Countries
        • North Africa
        • South Africa
      • By Source
      • By Function
      • By Product Type
      • By Channel
    • Market Attractiveness Analysis
      • By Country
      • By Source
      • By Function
      • By Product Type
      • By Channel
    • Key Takeaways
  16. Key Countries Market Analysis
    • USA
      • Pricing Analysis
      • Market Share Analysis, 2024
        • By Source
        • By Function
        • By Product Type
        • By Channel
    • Canada
      • Pricing Analysis
      • Market Share Analysis, 2024
        • By Source
        • By Function
        • By Product Type
        • By Channel
    • Brazil
      • Pricing Analysis
      • Market Share Analysis, 2024
        • By Source
        • By Function
        • By Product Type
        • By Channel
    • Mexico
      • Pricing Analysis
      • Market Share Analysis, 2024
        • By Source
        • By Function
        • By Product Type
        • By Channel
    • Colombia
      • Pricing Analysis
      • Market Share Analysis, 2024
        • By Source
        • By Function
        • By Product Type
        • By Channel
    • Germany
      • Pricing Analysis
      • Market Share Analysis, 2024
        • By Source
        • By Function
        • By Product Type
        • By Channel
    • UK
      • Pricing Analysis
      • Market Share Analysis, 2024
        • By Source
        • By Function
        • By Product Type
        • By Channel
    • France
      • Pricing Analysis
      • Market Share Analysis, 2024
        • By Source
        • By Function
        • By Product Type
        • By Channel
    • Italy
      • Pricing Analysis
      • Market Share Analysis, 2024
        • By Source
        • By Function
        • By Product Type
        • By Channel
    • Spain
      • Pricing Analysis
      • Market Share Analysis, 2024
        • By Source
        • By Function
        • By Product Type
        • By Channel
    • Belgium
      • Pricing Analysis
      • Market Share Analysis, 2024
        • By Source
        • By Function
        • By Product Type
        • By Channel
    • Netherlands
      • Pricing Analysis
      • Market Share Analysis, 2024
        • By Source
        • By Function
        • By Product Type
        • By Channel
    • Nordic
      • Pricing Analysis
      • Market Share Analysis, 2024
        • By Source
        • By Function
        • By Product Type
        • By Channel
    • Switzerland
      • Pricing Analysis
      • Market Share Analysis, 2024
        • By Source
        • By Function
        • By Product Type
        • By Channel
    • Russia
      • Pricing Analysis
      • Market Share Analysis, 2024
        • By Source
        • By Function
        • By Product Type
        • By Channel
    • Poland
      • Pricing Analysis
      • Market Share Analysis, 2024
        • By Source
        • By Function
        • By Product Type
        • By Channel
    • China
      • Pricing Analysis
      • Market Share Analysis, 2024
        • By Source
        • By Function
        • By Product Type
        • By Channel
    • Japan
      • Pricing Analysis
      • Market Share Analysis, 2024
        • By Source
        • By Function
        • By Product Type
        • By Channel
    • South Korea
      • Pricing Analysis
      • Market Share Analysis, 2024
        • By Source
        • By Function
        • By Product Type
        • By Channel
    • India
      • Pricing Analysis
      • Market Share Analysis, 2024
        • By Source
        • By Function
        • By Product Type
        • By Channel
    • Thailand
      • Pricing Analysis
      • Market Share Analysis, 2024
        • By Source
        • By Function
        • By Product Type
        • By Channel
    • Indonesia
      • Pricing Analysis
      • Market Share Analysis, 2024
        • By Source
        • By Function
        • By Product Type
        • By Channel
    • Australia
      • Pricing Analysis
      • Market Share Analysis, 2024
        • By Source
        • By Function
        • By Product Type
        • By Channel
    • New Zealand
      • Pricing Analysis
      • Market Share Analysis, 2024
        • By Source
        • By Function
        • By Product Type
        • By Channel
    • Turkey
      • Pricing Analysis
      • Market Share Analysis, 2024
        • By Source
        • By Function
        • By Product Type
        • By Channel
    • UAE
      • Pricing Analysis
      • Market Share Analysis, 2024
        • By Source
        • By Function
        • By Product Type
        • By Channel
    • Saudi Arabia
      • Pricing Analysis
      • Market Share Analysis, 2024
        • By Source
        • By Function
        • By Product Type
        • By Channel
    • Israel
      • Pricing Analysis
      • Market Share Analysis, 2024
        • By Source
        • By Function
        • By Product Type
        • By Channel
    • North Africa
      • Pricing Analysis
      • Market Share Analysis, 2024
        • By Source
        • By Function
        • By Product Type
        • By Channel
    • South Africa
      • Pricing Analysis
      • Market Share Analysis, 2024
        • By Source
        • By Function
        • By Product Type
        • By Channel
  17. Market Structure Analysis
    • Competition Dashboard
    • Competition Benchmarking
    • Market Share Analysis of Top Players
      • By Regional
      • By Source
      • By Function
      • By Product Type
      • By Channel
  18. Competition Analysis
    • Competition Deep Dive
      • Unilever
        • Overview
        • Product Portfolio
        • Profitability by Market Segments (Product/Age /Sales Channel/Region)
        • Sales Footprint
        • Strategy Overview
          • Marketing Strategy
          • Product Strategy
          • Channel Strategy
      • Procter & Gamble
        • Overview
        • Product Portfolio
        • Profitability by Market Segments (Product/Age /Sales Channel/Region)
        • Sales Footprint
        • Strategy Overview
          • Marketing Strategy
          • Product Strategy
          • Channel Strategy
      • L’Oréal
        • Overview
        • Product Portfolio
        • Profitability by Market Segments (Product/Age /Sales Channel/Region)
        • Sales Footprint
        • Strategy Overview
          • Marketing Strategy
          • Product Strategy
          • Channel Strategy
      • Shiseido
        • Overview
        • Product Portfolio
        • Profitability by Market Segments (Product/Age /Sales Channel/Region)
        • Sales Footprint
        • Strategy Overview
          • Marketing Strategy
          • Product Strategy
          • Channel Strategy
      • Colgate-Palmolive
        • Overview
        • Product Portfolio
        • Profitability by Market Segments (Product/Age /Sales Channel/Region)
        • Sales Footprint
        • Strategy Overview
          • Marketing Strategy
          • Product Strategy
          • Channel Strategy
      • Beiersdorf
        • Overview
        • Product Portfolio
        • Profitability by Market Segments (Product/Age /Sales Channel/Region)
        • Sales Footprint
        • Strategy Overview
          • Marketing Strategy
          • Product Strategy
          • Channel Strategy
      • The Body Shop
        • Overview
        • Product Portfolio
        • Profitability by Market Segments (Product/Age /Sales Channel/Region)
        • Sales Footprint
        • Strategy Overview
          • Marketing Strategy
          • Product Strategy
          • Channel Strategy
      • Origins
        • Overview
        • Product Portfolio
        • Profitability by Market Segments (Product/Age /Sales Channel/Region)
        • Sales Footprint
        • Strategy Overview
          • Marketing Strategy
          • Product Strategy
          • Channel Strategy
      • Clinique
        • Overview
        • Product Portfolio
        • Profitability by Market Segments (Product/Age /Sales Channel/Region)
        • Sales Footprint
        • Strategy Overview
          • Marketing Strategy
          • Product Strategy
          • Channel Strategy
      • Himalaya
        • Overview
        • Product Portfolio
        • Profitability by Market Segments (Product/Age /Sales Channel/Region)
        • Sales Footprint
        • Strategy Overview
          • Marketing Strategy
          • Product Strategy
          • Channel Strategy
      • Others
        • Overview
        • Product Portfolio
        • Profitability by Market Segments (Product/Age /Sales Channel/Region)
        • Sales Footprint
        • Strategy Overview
          • Marketing Strategy
          • Product Strategy
          • Channel Strategy
  19. Assumptions & Acronyms Used
  20. Research Methodology

List of Tables

  • Table 1: Global Market Value (USD Million) Forecast by Region, 2020-2035
  • Table 2: Global Market Volume (Units) Forecast by Region, 2020-2035
  • Table 3: Global Market Value (USD Million) Forecast by Source, 2020-2035
  • Table 4: Global Market Volume (Units) Forecast by Source, 2020-2035
  • Table 5: Global Market Value (USD Million) Forecast by Function, 2020-2035
  • Table 6: Global Market Volume (Units) Forecast by Function, 2020-2035
  • Table 7: Global Market Value (USD Million) Forecast by Product Type, 2020-2035
  • Table 8: Global Market Volume (Units) Forecast by Product Type, 2020-2035
  • Table 9: Global Market Value (USD Million) Forecast by Channel, 2020-2035
  • Table 10: Global Market Volume (Units) Forecast by Channel, 2020-2035
  • Table 11: North America Market Value (USD Million) Forecast by Country, 2020-2035
  • Table 12: North America Market Volume (Units) Forecast by Country, 2020-2035
  • Table 13: North America Market Value (USD Million) Forecast by Source, 2020-2035
  • Table 14: North America Market Volume (Units) Forecast by Source, 2020-2035
  • Table 15: North America Market Value (USD Million) Forecast by Function, 2020-2035
  • Table 16: North America Market Volume (Units) Forecast by Function, 2020-2035
  • Table 17: North America Market Value (USD Million) Forecast by Product Type, 2020-2035
  • Table 18: North America Market Volume (Units) Forecast by Product Type, 2020-2035
  • Table 19: North America Market Value (USD Million) Forecast by Channel, 2020-2035
  • Table 20: North America Market Volume (Units) Forecast by Channel, 2020-2035
  • Table 21: Latin America Market Value (USD Million) Forecast by Country, 2020-2035
  • Table 22: Latin America Market Volume (Units) Forecast by Country, 2020-2035
  • Table 23: Latin America Market Value (USD Million) Forecast by Source, 2020-2035
  • Table 24: Latin America Market Volume (Units) Forecast by Source, 2020-2035
  • Table 25: Latin America Market Value (USD Million) Forecast by Function, 2020-2035
  • Table 26: Latin America Market Volume (Units) Forecast by Function, 2020-2035
  • Table 27: Latin America Market Value (USD Million) Forecast by Product Type, 2020-2035
  • Table 28: Latin America Market Volume (Units) Forecast by Product Type, 2020-2035
  • Table 29: Latin America Market Value (USD Million) Forecast by Channel, 2020-2035
  • Table 30: Latin America Market Volume (Units) Forecast by Channel, 2020-2035
  • Table 31: Europe Market Value (USD Million) Forecast by Country, 2020-2035
  • Table 32: Europe Market Volume (Units) Forecast by Country, 2020-2035
  • Table 33: Europe Market Value (USD Million) Forecast by Source, 2020-2035
  • Table 34: Europe Market Volume (Units) Forecast by Source, 2020-2035
  • Table 35: Europe Market Value (USD Million) Forecast by Function, 2020-2035
  • Table 36: Europe Market Volume (Units) Forecast by Function, 2020-2035
  • Table 37: Europe Market Value (USD Million) Forecast by Product Type, 2020-2035
  • Table 38: Europe Market Volume (Units) Forecast by Product Type, 2020-2035
  • Table 39: Europe Market Value (USD Million) Forecast by Channel, 2020-2035
  • Table 40: Europe Market Volume (Units) Forecast by Channel, 2020-2035
  • Table 41: East Asia Market Value (USD Million) Forecast by Country, 2020-2035
  • Table 42: East Asia Market Volume (Units) Forecast by Country, 2020-2035
  • Table 43: East Asia Market Value (USD Million) Forecast by Source, 2020-2035
  • Table 44: East Asia Market Volume (Units) Forecast by Source, 2020-2035
  • Table 45: East Asia Market Value (USD Million) Forecast by Function, 2020-2035
  • Table 46: East Asia Market Volume (Units) Forecast by Function, 2020-2035
  • Table 47: East Asia Market Value (USD Million) Forecast by Product Type, 2020-2035
  • Table 48: East Asia Market Volume (Units) Forecast by Product Type, 2020-2035
  • Table 49: East Asia Market Value (USD Million) Forecast by Channel, 2020-2035
  • Table 50: East Asia Market Volume (Units) Forecast by Channel, 2020-2035
  • Table 51: South Asia & Pacific Market Value (USD Million) Forecast by Country, 2020-2035
  • Table 52: South Asia & Pacific Market Volume (Units) Forecast by Country, 2020-2035
  • Table 53: South Asia & Pacific Market Value (USD Million) Forecast by Source, 2020-2035
  • Table 54: South Asia & Pacific Market Volume (Units) Forecast by Source, 2020-2035
  • Table 55: South Asia & Pacific Market Value (USD Million) Forecast by Function, 2020-2035
  • Table 56: South Asia & Pacific Market Volume (Units) Forecast by Function, 2020-2035
  • Table 57: South Asia & Pacific Market Value (USD Million) Forecast by Product Type, 2020-2035
  • Table 58: South Asia & Pacific Market Volume (Units) Forecast by Product Type, 2020-2035
  • Table 59: South Asia & Pacific Market Value (USD Million) Forecast by Channel, 2020-2035
  • Table 60: South Asia & Pacific Market Volume (Units) Forecast by Channel, 2020-2035
  • Table 61: Middle East and Africa Market Value (USD Million) Forecast by Country, 2020-2035
  • Table 62: Middle East and Africa Market Volume (Units) Forecast by Country, 2020-2035
  • Table 63: Middle East and Africa Market Value (USD Million) Forecast by Source, 2020-2035
  • Table 64: Middle East and Africa Market Volume (Units) Forecast by Source, 2020-2035
  • Table 65: Middle East and Africa Market Value (USD Million) Forecast by Function, 2020-2035
  • Table 66: Middle East and Africa Market Volume (Units) Forecast by Function, 2020-2035
  • Table 67: Middle East and Africa Market Value (USD Million) Forecast by Product Type, 2020-2035
  • Table 68: Middle East and Africa Market Volume (Units) Forecast by Product Type, 2020-2035
  • Table 69: Middle East and Africa Market Value (USD Million) Forecast by Channel, 2020-2035
  • Table 70: Middle East and Africa Market Volume (Units) Forecast by Channel, 2020-2035

List of Figures

  • Figure 1: Global Market Value (USD Million) by Source, 2025-2035
  • Figure 2: Global Market Value (USD Million) by Function, 2025-2035
  • Figure 3: Global Market Value (USD Million) by Product Type, 2025-2035
  • Figure 4: Global Market Value (USD Million) by Channel, 2025-2035
  • Figure 5: Global Market Value (USD Million) by Region, 2025-2035
  • Figure 6: Global Market Value (USD Million) Analysis by Region, 2020-2035
  • Figure 7: Global Market Volume (Units) Analysis by Region, 2020-2035
  • Figure 8: Global Market Value Share (%) and BPS Analysis by Region, 2025-2035
  • Figure 9: Global Market Y-o-Y Growth (%) Projections by Region, 2025-2035
  • Figure 10: Global Market Value (USD Million) Analysis by Source, 2020-2035
  • Figure 11: Global Market Volume (Units) Analysis by Source, 2020-2035
  • Figure 12: Global Market Value Share (%) and BPS Analysis by Source, 2025-2035
  • Figure 13: Global Market Y-o-Y Growth (%) Projections by Source, 2025-2035
  • Figure 14: Global Market Value (USD Million) Analysis by Function, 2020-2035
  • Figure 15: Global Market Volume (Units) Analysis by Function, 2020-2035
  • Figure 16: Global Market Value Share (%) and BPS Analysis by Function, 2025-2035
  • Figure 17: Global Market Y-o-Y Growth (%) Projections by Function, 2025-2035
  • Figure 18: Global Market Value (USD Million) Analysis by Product Type, 2020-2035
  • Figure 19: Global Market Volume (Units) Analysis by Product Type, 2020-2035
  • Figure 20: Global Market Value Share (%) and BPS Analysis by Product Type, 2025-2035
  • Figure 21: Global Market Y-o-Y Growth (%) Projections by Product Type, 2025-2035
  • Figure 22: Global Market Value (USD Million) Analysis by Channel, 2020-2035
  • Figure 23: Global Market Volume (Units) Analysis by Channel, 2020-2035
  • Figure 24: Global Market Value Share (%) and BPS Analysis by Channel, 2025-2035
  • Figure 25: Global Market Y-o-Y Growth (%) Projections by Channel, 2025-2035
  • Figure 26: Global Market Attractiveness by Source, 2025-2035
  • Figure 27: Global Market Attractiveness by Function, 2025-2035
  • Figure 28: Global Market Attractiveness by Product Type, 2025-2035
  • Figure 29: Global Market Attractiveness by Channel, 2025-2035
  • Figure 30: Global Market Attractiveness by Region, 2025-2035
  • Figure 31: North America Market Value (USD Million) by Source, 2025-2035
  • Figure 32: North America Market Value (USD Million) by Function, 2025-2035
  • Figure 33: North America Market Value (USD Million) by Product Type, 2025-2035
  • Figure 34: North America Market Value (USD Million) by Channel, 2025-2035
  • Figure 35: North America Market Value (USD Million) by Country, 2025-2035
  • Figure 36: North America Market Value (USD Million) Analysis by Country, 2020-2035
  • Figure 37: North America Market Volume (Units) Analysis by Country, 2020-2035
  • Figure 38: North America Market Value Share (%) and BPS Analysis by Country, 2025-2035
  • Figure 39: North America Market Y-o-Y Growth (%) Projections by Country, 2025-2035
  • Figure 40: North America Market Value (USD Million) Analysis by Source, 2020-2035
  • Figure 41: North America Market Volume (Units) Analysis by Source, 2020-2035
  • Figure 42: North America Market Value Share (%) and BPS Analysis by Source, 2025-2035
  • Figure 43: North America Market Y-o-Y Growth (%) Projections by Source, 2025-2035
  • Figure 44: North America Market Value (USD Million) Analysis by Function, 2020-2035
  • Figure 45: North America Market Volume (Units) Analysis by Function, 2020-2035
  • Figure 46: North America Market Value Share (%) and BPS Analysis by Function, 2025-2035
  • Figure 47: North America Market Y-o-Y Growth (%) Projections by Function, 2025-2035
  • Figure 48: North America Market Value (USD Million) Analysis by Product Type, 2020-2035
  • Figure 49: North America Market Volume (Units) Analysis by Product Type, 2020-2035
  • Figure 50: North America Market Value Share (%) and BPS Analysis by Product Type, 2025-2035
  • Figure 51: North America Market Y-o-Y Growth (%) Projections by Product Type, 2025-2035
  • Figure 52: North America Market Value (USD Million) Analysis by Channel, 2020-2035
  • Figure 53: North America Market Volume (Units) Analysis by Channel, 2020-2035
  • Figure 54: North America Market Value Share (%) and BPS Analysis by Channel, 2025-2035
  • Figure 55: North America Market Y-o-Y Growth (%) Projections by Channel, 2025-2035
  • Figure 56: North America Market Attractiveness by Source, 2025-2035
  • Figure 57: North America Market Attractiveness by Function, 2025-2035
  • Figure 58: North America Market Attractiveness by Product Type, 2025-2035
  • Figure 59: North America Market Attractiveness by Channel, 2025-2035
  • Figure 60: North America Market Attractiveness by Country, 2025-2035
  • Figure 61: Latin America Market Value (USD Million) by Source, 2025-2035
  • Figure 62: Latin America Market Value (USD Million) by Function, 2025-2035
  • Figure 63: Latin America Market Value (USD Million) by Product Type, 2025-2035
  • Figure 64: Latin America Market Value (USD Million) by Channel, 2025-2035
  • Figure 65: Latin America Market Value (USD Million) by Country, 2025-2035
  • Figure 66: Latin America Market Value (USD Million) Analysis by Country, 2020-2035
  • Figure 67: Latin America Market Volume (Units) Analysis by Country, 2020-2035
  • Figure 68: Latin America Market Value Share (%) and BPS Analysis by Country, 2025-2035
  • Figure 69: Latin America Market Y-o-Y Growth (%) Projections by Country, 2025-2035
  • Figure 70: Latin America Market Value (USD Million) Analysis by Source, 2020-2035
  • Figure 71: Latin America Market Volume (Units) Analysis by Source, 2020-2035
  • Figure 72: Latin America Market Value Share (%) and BPS Analysis by Source, 2025-2035
  • Figure 73: Latin America Market Y-o-Y Growth (%) Projections by Source, 2025-2035
  • Figure 74: Latin America Market Value (USD Million) Analysis by Function, 2020-2035
  • Figure 75: Latin America Market Volume (Units) Analysis by Function, 2020-2035
  • Figure 76: Latin America Market Value Share (%) and BPS Analysis by Function, 2025-2035
  • Figure 77: Latin America Market Y-o-Y Growth (%) Projections by Function, 2025-2035
  • Figure 78: Latin America Market Value (USD Million) Analysis by Product Type, 2020-2035
  • Figure 79: Latin America Market Volume (Units) Analysis by Product Type, 2020-2035
  • Figure 80: Latin America Market Value Share (%) and BPS Analysis by Product Type, 2025-2035
  • Figure 81: Latin America Market Y-o-Y Growth (%) Projections by Product Type, 2025-2035
  • Figure 82: Latin America Market Value (USD Million) Analysis by Channel, 2020-2035
  • Figure 83: Latin America Market Volume (Units) Analysis by Channel, 2020-2035
  • Figure 84: Latin America Market Value Share (%) and BPS Analysis by Channel, 2025-2035
  • Figure 85: Latin America Market Y-o-Y Growth (%) Projections by Channel, 2025-2035
  • Figure 86: Latin America Market Attractiveness by Source, 2025-2035
  • Figure 87: Latin America Market Attractiveness by Function, 2025-2035
  • Figure 88: Latin America Market Attractiveness by Product Type, 2025-2035
  • Figure 89: Latin America Market Attractiveness by Channel, 2025-2035
  • Figure 90: Latin America Market Attractiveness by Country, 2025-2035
  • Figure 91: Europe Market Value (USD Million) by Source, 2025-2035
  • Figure 92: Europe Market Value (USD Million) by Function, 2025-2035
  • Figure 93: Europe Market Value (USD Million) by Product Type, 2025-2035
  • Figure 94: Europe Market Value (USD Million) by Channel, 2025-2035
  • Figure 95: Europe Market Value (USD Million) by Country, 2025-2035
  • Figure 96: Europe Market Value (USD Million) Analysis by Country, 2020-2035
  • Figure 97: Europe Market Volume (Units) Analysis by Country, 2020-2035
  • Figure 98: Europe Market Value Share (%) and BPS Analysis by Country, 2025-2035
  • Figure 99: Europe Market Y-o-Y Growth (%) Projections by Country, 2025-2035
  • Figure 100: Europe Market Value (USD Million) Analysis by Source, 2020-2035
  • Figure 101: Europe Market Volume (Units) Analysis by Source, 2020-2035
  • Figure 102: Europe Market Value Share (%) and BPS Analysis by Source, 2025-2035
  • Figure 103: Europe Market Y-o-Y Growth (%) Projections by Source, 2025-2035
  • Figure 104: Europe Market Value (USD Million) Analysis by Function, 2020-2035
  • Figure 105: Europe Market Volume (Units) Analysis by Function, 2020-2035
  • Figure 106: Europe Market Value Share (%) and BPS Analysis by Function, 2025-2035
  • Figure 107: Europe Market Y-o-Y Growth (%) Projections by Function, 2025-2035
  • Figure 108: Europe Market Value (USD Million) Analysis by Product Type, 2020-2035
  • Figure 109: Europe Market Volume (Units) Analysis by Product Type, 2020-2035
  • Figure 110: Europe Market Value Share (%) and BPS Analysis by Product Type, 2025-2035
  • Figure 111: Europe Market Y-o-Y Growth (%) Projections by Product Type, 2025-2035
  • Figure 112: Europe Market Value (USD Million) Analysis by Channel, 2020-2035
  • Figure 113: Europe Market Volume (Units) Analysis by Channel, 2020-2035
  • Figure 114: Europe Market Value Share (%) and BPS Analysis by Channel, 2025-2035
  • Figure 115: Europe Market Y-o-Y Growth (%) Projections by Channel, 2025-2035
  • Figure 116: Europe Market Attractiveness by Source, 2025-2035
  • Figure 117: Europe Market Attractiveness by Function, 2025-2035
  • Figure 118: Europe Market Attractiveness by Product Type, 2025-2035
  • Figure 119: Europe Market Attractiveness by Channel, 2025-2035
  • Figure 120: Europe Market Attractiveness by Country, 2025-2035
  • Figure 121: East Asia Market Value (USD Million) by Source, 2025-2035
  • Figure 122: East Asia Market Value (USD Million) by Function, 2025-2035
  • Figure 123: East Asia Market Value (USD Million) by Product Type, 2025-2035
  • Figure 124: East Asia Market Value (USD Million) by Channel, 2025-2035
  • Figure 125: East Asia Market Value (USD Million) by Country, 2025-2035
  • Figure 126: East Asia Market Value (USD Million) Analysis by Country, 2020-2035
  • Figure 127: East Asia Market Volume (Units) Analysis by Country, 2020-2035
  • Figure 128: East Asia Market Value Share (%) and BPS Analysis by Country, 2025-2035
  • Figure 129: East Asia Market Y-o-Y Growth (%) Projections by Country, 2025-2035
  • Figure 130: East Asia Market Value (USD Million) Analysis by Source, 2020-2035
  • Figure 131: East Asia Market Volume (Units) Analysis by Source, 2020-2035
  • Figure 132: East Asia Market Value Share (%) and BPS Analysis by Source, 2025-2035
  • Figure 133: East Asia Market Y-o-Y Growth (%) Projections by Source, 2025-2035
  • Figure 134: East Asia Market Value (USD Million) Analysis by Function, 2020-2035
  • Figure 135: East Asia Market Volume (Units) Analysis by Function, 2020-2035
  • Figure 136: East Asia Market Value Share (%) and BPS Analysis by Function, 2025-2035
  • Figure 137: East Asia Market Y-o-Y Growth (%) Projections by Function, 2025-2035
  • Figure 138: East Asia Market Value (USD Million) Analysis by Product Type, 2020-2035
  • Figure 139: East Asia Market Volume (Units) Analysis by Product Type, 2020-2035
  • Figure 140: East Asia Market Value Share (%) and BPS Analysis by Product Type, 2025-2035
  • Figure 141: East Asia Market Y-o-Y Growth (%) Projections by Product Type, 2025-2035
  • Figure 142: East Asia Market Value (USD Million) Analysis by Channel, 2020-2035
  • Figure 143: East Asia Market Volume (Units) Analysis by Channel, 2020-2035
  • Figure 144: East Asia Market Value Share (%) and BPS Analysis by Channel, 2025-2035
  • Figure 145: East Asia Market Y-o-Y Growth (%) Projections by Channel, 2025-2035
  • Figure 146: East Asia Market Attractiveness by Source, 2025-2035
  • Figure 147: East Asia Market Attractiveness by Function, 2025-2035
  • Figure 148: East Asia Market Attractiveness by Product Type, 2025-2035
  • Figure 149: East Asia Market Attractiveness by Channel, 2025-2035
  • Figure 150: East Asia Market Attractiveness by Country, 2025-2035
  • Figure 151: South Asia & Pacific Market Value (USD Million) by Source, 2025-2035
  • Figure 152: South Asia & Pacific Market Value (USD Million) by Function, 2025-2035
  • Figure 153: South Asia & Pacific Market Value (USD Million) by Product Type, 2025-2035
  • Figure 154: South Asia & Pacific Market Value (USD Million) by Channel, 2025-2035
  • Figure 155: South Asia & Pacific Market Value (USD Million) by Country, 2025-2035
  • Figure 156: South Asia & Pacific Market Value (USD Million) Analysis by Country, 2020-2035
  • Figure 157: South Asia & Pacific Market Volume (Units) Analysis by Country, 2020-2035
  • Figure 158: South Asia & Pacific Market Value Share (%) and BPS Analysis by Country, 2025-2035
  • Figure 159: South Asia & Pacific Market Y-o-Y Growth (%) Projections by Country, 2025-2035
  • Figure 160: South Asia & Pacific Market Value (USD Million) Analysis by Source, 2020-2035
  • Figure 161: South Asia & Pacific Market Volume (Units) Analysis by Source, 2020-2035
  • Figure 162: South Asia & Pacific Market Value Share (%) and BPS Analysis by Source, 2025-2035
  • Figure 163: South Asia & Pacific Market Y-o-Y Growth (%) Projections by Source, 2025-2035
  • Figure 164: South Asia & Pacific Market Value (USD Million) Analysis by Function, 2020-2035
  • Figure 165: South Asia & Pacific Market Volume (Units) Analysis by Function, 2020-2035
  • Figure 166: South Asia & Pacific Market Value Share (%) and BPS Analysis by Function, 2025-2035
  • Figure 167: South Asia & Pacific Market Y-o-Y Growth (%) Projections by Function, 2025-2035
  • Figure 168: South Asia & Pacific Market Value (USD Million) Analysis by Product Type, 2020-2035
  • Figure 169: South Asia & Pacific Market Volume (Units) Analysis by Product Type, 2020-2035
  • Figure 170: South Asia & Pacific Market Value Share (%) and BPS Analysis by Product Type, 2025-2035
  • Figure 171: South Asia & Pacific Market Y-o-Y Growth (%) Projections by Product Type, 2025-2035
  • Figure 172: South Asia & Pacific Market Value (USD Million) Analysis by Channel, 2020-2035
  • Figure 173: South Asia & Pacific Market Volume (Units) Analysis by Channel, 2020-2035
  • Figure 174: South Asia & Pacific Market Value Share (%) and BPS Analysis by Channel, 2025-2035
  • Figure 175: South Asia & Pacific Market Y-o-Y Growth (%) Projections by Channel, 2025-2035
  • Figure 176: South Asia & Pacific Market Attractiveness by Source, 2025-2035
  • Figure 177: South Asia & Pacific Market Attractiveness by Function, 2025-2035
  • Figure 178: South Asia & Pacific Market Attractiveness by Product Type, 2025-2035
  • Figure 179: South Asia & Pacific Market Attractiveness by Channel, 2025-2035
  • Figure 180: South Asia & Pacific Market Attractiveness by Country, 2025-2035
  • Figure 181: Middle East and Africa Market Value (USD Million) by Source, 2025-2035
  • Figure 182: Middle East and Africa Market Value (USD Million) by Function, 2025-2035
  • Figure 183: Middle East and Africa Market Value (USD Million) by Product Type, 2025-2035
  • Figure 184: Middle East and Africa Market Value (USD Million) by Channel, 2025-2035
  • Figure 185: Middle East and Africa Market Value (USD Million) by Country, 2025-2035
  • Figure 186: Middle East and Africa Market Value (USD Million) Analysis by Country, 2020-2035
  • Figure 187: Middle East and Africa Market Volume (Units) Analysis by Country, 2020-2035
  • Figure 188: Middle East and Africa Market Value Share (%) and BPS Analysis by Country, 2025-2035
  • Figure 189: Middle East and Africa Market Y-o-Y Growth (%) Projections by Country, 2025-2035
  • Figure 190: Middle East and Africa Market Value (USD Million) Analysis by Source, 2020-2035
  • Figure 191: Middle East and Africa Market Volume (Units) Analysis by Source, 2020-2035
  • Figure 192: Middle East and Africa Market Value Share (%) and BPS Analysis by Source, 2025-2035
  • Figure 193: Middle East and Africa Market Y-o-Y Growth (%) Projections by Source, 2025-2035
  • Figure 194: Middle East and Africa Market Value (USD Million) Analysis by Function, 2020-2035
  • Figure 195: Middle East and Africa Market Volume (Units) Analysis by Function, 2020-2035
  • Figure 196: Middle East and Africa Market Value Share (%) and BPS Analysis by Function, 2025-2035
  • Figure 197: Middle East and Africa Market Y-o-Y Growth (%) Projections by Function, 2025-2035
  • Figure 198: Middle East and Africa Market Value (USD Million) Analysis by Product Type, 2020-2035
  • Figure 199: Middle East and Africa Market Volume (Units) Analysis by Product Type, 2020-2035
  • Figure 200: Middle East and Africa Market Value Share (%) and BPS Analysis by Product Type, 2025-2035
  • Figure 201: Middle East and Africa Market Y-o-Y Growth (%) Projections by Product Type, 2025-2035
  • Figure 202: Middle East and Africa Market Value (USD Million) Analysis by Channel, 2020-2035
  • Figure 203: Middle East and Africa Market Volume (Units) Analysis by Channel, 2020-2035
  • Figure 204: Middle East and Africa Market Value Share (%) and BPS Analysis by Channel, 2025-2035
  • Figure 205: Middle East and Africa Market Y-o-Y Growth (%) Projections by Channel, 2025-2035
  • Figure 206: Middle East and Africa Market Attractiveness by Source, 2025-2035
  • Figure 207: Middle East and Africa Market Attractiveness by Function, 2025-2035
  • Figure 208: Middle East and Africa Market Attractiveness by Product Type, 2025-2035
  • Figure 209: Middle East and Africa Market Attractiveness by Channel, 2025-2035
  • Figure 210: Middle East and Africa Market Attractiveness by Country, 2025-2035

Frequently Asked Questions

How big is the Active Charcoal Complexes Market in 2025?

The global Active Charcoal Complexes Market is estimated to be valued at USD 1,960.1 million in 2025.

What will be the size of the Active Charcoal Complexes Market in 2035?

The market size for the Active Charcoal Complexes Market is projected to reach USD 5,321.4 million by 2035.

How much will be the Active Charcoal Complexes Market growth between 2025 and 2035?

The Active Charcoal Complexes Market is expected to grow at a CAGR of 10.5% between 2025 and 2035.

What are the key product types in the Active Charcoal Complexes Market?

The key product types in the market are masks, cleansers, soaps, and toothpastes, with emerging formats in hybrid and multi-functional skincare.

Which product segment will contribute the most in the Active Charcoal Complexes Market in 2025?

In terms of product type, the “Others” segment (comprising cleansers, soaps, and toothpastes) is projected to command 54.5% of the total market share in 2025.

Explore Similar Insights

Future Market Insights

Active Charcoal Complexes Market