Reactive Arthritis Treatment Market Size and Share Forecast Outlook 2025 to 2035

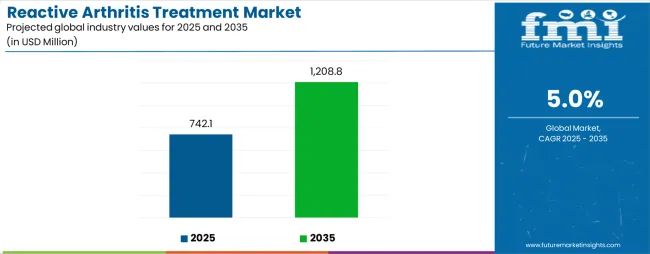
The Reactive Arthritis Treatment Market is estimated to be valued at USD 742.1 million in 2025 and is projected to reach USD 1208.8 million by 2035, registering a compound annual growth rate (CAGR) of 5.0% over the forecast period.
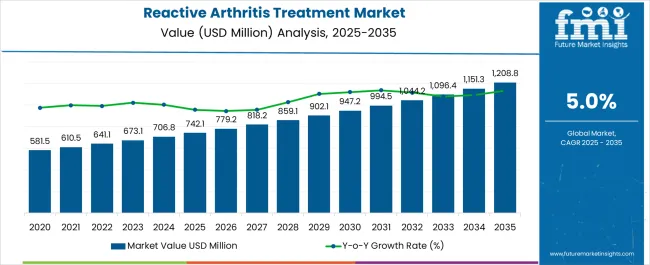
Reactive Arthritis Treatment Market Market Value Analysis

Quick Stats for Reactive Arthritis Treatment Market

  • Reactive Arthritis Treatment Market Value (2025): USD 742.1 million
  • Reactive Arthritis Treatment Market Forecast Value (2035): USD 1208.8 million
  • Reactive Arthritis Treatment Market Forecast CAGR: 5.0%
  • Leading Segment in Reactive Arthritis Treatment Market in 2025: Antibiotics (36.9%)
  • Key Growth Regions in Reactive Arthritis Treatment Market: North America, Asia-Pacific, Europe
  • Top Key Players in Reactive Arthritis Treatment Market: F. Hoffmann-La Roche Ltd, Teva Pharmaceutical Industries Ltd, Pfizer, Novartis AG, Amgen Inc, Velcura Therapeutics, Johnson & Johnson Services

Reactive Arthritis Treatment Market Industry Value Analysis

Reactive Arthritis Treatment Market Key Takeaways

Metric Value
Reactive Arthritis Treatment Market Estimated Value in (2025 E) USD 742.1 million
Reactive Arthritis Treatment Market Forecast Value in (2035 F) USD 1208.8 million
Forecast CAGR (2025 to 2035) 5.0%

Why is the Reactive Arthritis Treatment Market Growing?

The Reactive Arthritis Treatment market is expanding steadily, supported by the growing prevalence of autoimmune and infection-triggered joint disorders. The condition, often associated with bacterial infections such as Chlamydia or gastrointestinal pathogens, requires comprehensive management strategies that combine antibiotics, anti-inflammatory drugs, and supportive therapies. Increasing awareness among healthcare professionals about early diagnosis and targeted treatment is driving market growth.

Rising incidence rates in both developed and emerging economies, coupled with lifestyle factors that contribute to weakened immunity, are further fueling demand. Innovations in drug development, including improved antibiotic formulations and biologics under clinical evaluation, are shaping future treatment pathways. Government initiatives aimed at strengthening infectious disease management and rheumatology care are reinforcing adoption across hospitals and clinics.

The growing availability of generic drugs has improved accessibility and affordability, supporting treatment uptake in cost-sensitive regions As patients increasingly seek effective and timely therapies to manage symptoms and prevent recurrence, the Reactive Arthritis Treatment market is expected to maintain consistent growth momentum over the coming years.

Segmental Analysis

The reactive arthritis treatment market is segmented by drug type, route of administration, distribution channel, and geographic regions. By drug type, reactive arthritis treatment market is divided into Antibiotics, Corticosteroids, Nonsteroidal Anti-Inflammatory Drugs (NSAIDs), Disease Modifying Anti-Rheumatic Drugs (DMARDs), Tumor Necrosis Factor (TNF) Blockers, and Immunosuppressant Drugs. In terms of route of administration, reactive arthritis treatment market is classified into Oral, Topical/Transdermal, and Parenteral. Based on distribution channel, reactive arthritis treatment market is segmented into Hospital Pharmacies, Retail Pharmacies, and Online Pharmacies. Regionally, the reactive arthritis treatment industry is classified into North America, Latin America, Western Europe, Eastern Europe, Balkan & Baltic Countries, Russia & Belarus, Central Asia, East Asia, South Asia & Pacific, and the Middle East & Africa.
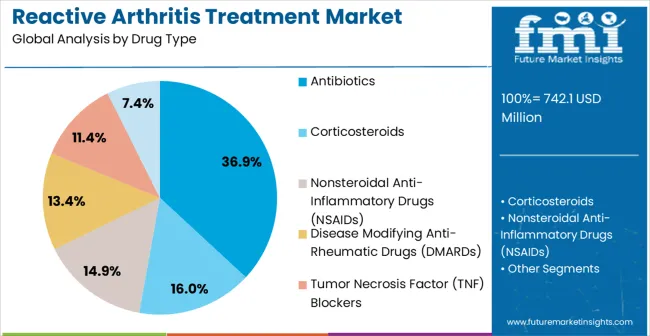
Insights into the Antibiotics Drug Type Segment

Reactive Arthritis Treatment Market Analysis By Drug Type

The antibiotics segment is projected to account for 36.9% of the Reactive Arthritis Treatment market revenue in 2025, positioning it as the leading drug type. Antibiotics play a critical role in addressing the underlying bacterial infections that trigger reactive arthritis, making them a cornerstone of treatment strategies. Their efficacy in reducing infection load helps to prevent long-term joint complications, thereby enhancing patient outcomes.

The availability of a wide range of oral and injectable antibiotic formulations ensures accessibility across diverse healthcare settings. Increasing prescription rates are also supported by the global rise in sexually transmitted and gastrointestinal infections, which are major triggers for this condition. Moreover, the growing use of generics has made antibiotic therapies more affordable, encouraging widespread adoption in low and middle-income regions.

Continuous improvements in formulations to reduce resistance and side effects further support their use As clinical guidelines emphasize timely antibiotic intervention for reactive arthritis, this segment is expected to retain its dominant position in the treatment landscape.
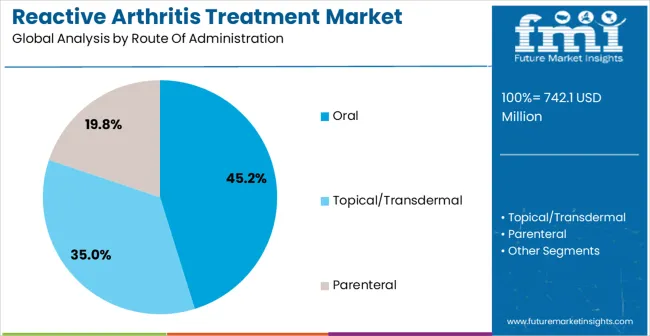
Insights into the Oral Route of Administration Segment

Reactive Arthritis Treatment Market Analysis By Route Of Administration

The oral route of administration segment is expected to capture 45.2% of the market revenue in 2025, making it the dominant method of delivering treatment for reactive arthritis. Oral drugs are highly preferred due to their ease of use, cost-effectiveness, and suitability for outpatient care. Patient compliance is significantly higher with oral medications compared to parenteral routes, which require clinical supervision.

The widespread availability of oral antibiotics and anti-inflammatory agents has reinforced this segment’s strong position in the market. Additionally, the oral route facilitates long-term therapy for patients managing chronic symptoms, which is critical for reducing flare-ups and maintaining quality of life. Pharmaceutical companies continue to invest in developing advanced oral formulations with improved bioavailability and reduced gastrointestinal side effects, further strengthening patient preference.

Growing demand for convenient and self-administered treatments across both developed and developing regions is expected to sustain this segment’s leadership With expanding access to pharmacies and online platforms, oral administration is anticipated to remain the preferred route in reactive arthritis treatment.
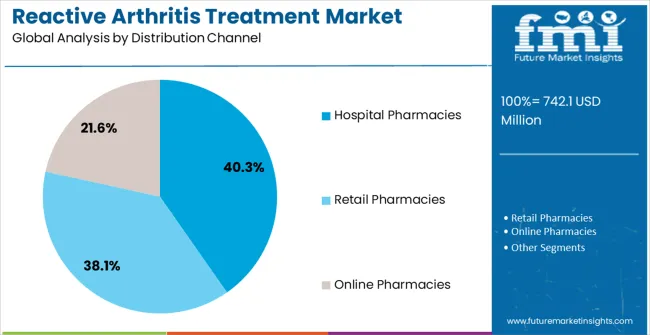
Insights into the Hospital Pharmacies Distribution Channel Segment

Reactive Arthritis Treatment Market Analysis By Distribution Channel

The hospital pharmacies segment is projected to hold 40.3% of the market revenue in 2025, emerging as the leading distribution channel for reactive arthritis treatments. Hospitals serve as the primary point of care for patients requiring diagnosis, advanced treatment, and management of complex cases. The availability of a wide range of medications, including antibiotics, anti-inflammatories, and biologics, ensures that hospital pharmacies remain the central hub for dispensing therapies.

Strong physician-pharmacist collaboration within hospital settings improves treatment adherence and ensures accurate medication management. Additionally, patients with severe infections or advanced stages of reactive arthritis often require hospital-based interventions, increasing reliance on hospital pharmacies. Government initiatives aimed at strengthening healthcare infrastructure and ensuring the availability of essential drugs further support this channel’s growth.

Hospital pharmacies also play a key role in maintaining compliance with safety standards and regulatory requirements, which enhances trust among patients As the burden of reactive arthritis rises and the demand for specialized care grows, hospital pharmacies are expected to sustain their dominance in the distribution landscape.

Market Overview

Reactive Arthritis Treatment Market Overview

Reactive arthritis is a form of joint inflammation, which affects the joints, heels, toes, lower back especially of the knees and ankles, and may also affect the skin, urinary tract and eyes. Reactive arthritis belongs to a group of orthopedic disorders which is commonly known as spondyloarthritis, which can cause inflammation throughout the body, especially in the spine. Reactive arthritis occurs when a bacteria (Chlamydia trachomatis with Shigella, Salmonella, Campylobacter, Yersinia, or Clostridium difficile)

enters the blood stream from urogenital tract and gastrointestinal tract. There are few instances where the bacteria in urogenital tract can enter through vagina or urethra and spread over the bladder while in the gastrointestinal tract. Reactive arthritis typically initiates within 2 to 4 week after infection.

Reactive Arthritis can also create inflammation also can affect your eyes, skin, and urethra. As compared to men, women often have milder symptoms of reactive arthritis. Reactive arthritis usually tends to occur in men aged 40 and above. Reactive arthritis is not a contagious disease.
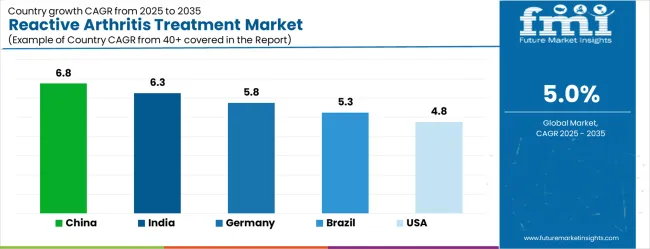
Analysis of Reactive Arthritis Treatment Market By Key Countries

Reactive Arthritis Treatment Market Cagr Analysis By Country

Country CAGR
China 6.8%
India 6.3%
Germany 5.8%
Brazil 5.3%
USA 4.8%
UK 4.3%
Japan 3.8%

Country-wise Analysis

The Reactive Arthritis Treatment Market is expected to register a CAGR of 5.0% during the forecast period, exhibiting varied country level momentum. China leads with the highest CAGR of 6.8%, followed by India at 6.3%. Developed markets such as Germany, France, and the UK continue to expand steadily, while the USA is likely to grow at consistent rates. Japan posts the lowest CAGR at 3.8%, yet still underscores a broadly positive trajectory for the global Reactive Arthritis Treatment Market. In 2024, Germany held a dominant revenue in the Western Europe market and is expected to grow with a CAGR of 5.8%. The USA Reactive Arthritis Treatment Market is estimated to be valued at USD 262.5 million in 2025 and is anticipated to reach a valuation of USD 262.5 million by 2035. Sales are projected to rise at a CAGR of 0.0% over the forecast period between 2025 and 2035. While Japan and South Korea markets are estimated to be valued at USD 40.5 million and USD 24.8 million respectively in 2025.
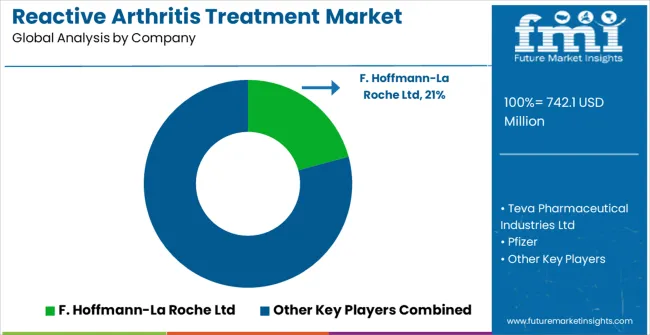
Key Players in the Reactive Arthritis Treatment Market

Reactive Arthritis Treatment Market Analysis By Company

  • F. Hoffmann-La Roche Ltd
  • Teva Pharmaceutical Industries Ltd
  • Pfizer
  • Novartis AG
  • Amgen Inc
  • Velcura Therapeutics
  • Johnson & Johnson Services

Scope of the Report

Item Value
Quantitative Units USD 742.1 Million
Drug Type Antibiotics, Corticosteroids, Nonsteroidal Anti-Inflammatory Drugs (NSAIDs), Disease Modifying Anti-Rheumatic Drugs (DMARDs), Tumor Necrosis Factor (TNF) Blockers, and Immunosuppressant Drugs
Route Of Administration Oral, Topical/Transdermal, and Parenteral
Distribution Channel Hospital Pharmacies, Retail Pharmacies, and Online Pharmacies
Regions Covered North America, Europe, Asia-Pacific, Latin America, Middle East & Africa
Country Covered United States, Canada, Germany, France, United Kingdom, China, Japan, India, Brazil, South Africa
Key Companies Profiled F. Hoffmann-La Roche Ltd, Teva Pharmaceutical Industries Ltd, Pfizer, Novartis AG, Amgen Inc, Velcura Therapeutics, and Johnson & Johnson Services

Reactive Arthritis Treatment Market by Segments

Drug Type:

  • Antibiotics
  • Corticosteroids
  • Nonsteroidal Anti-Inflammatory Drugs (NSAIDs)
  • Disease Modifying Anti-Rheumatic Drugs (DMARDs)
  • Tumor Necrosis Factor (TNF) Blockers
  • Immunosuppressant Drugs

Route Of Administration:

  • Oral
  • Topical/Transdermal
  • Parenteral

Distribution Channel:

  • Hospital Pharmacies
  • Retail Pharmacies
  • Online Pharmacies

Region:

  • North America
    • USA
    • Canada
    • Mexico
  • Latin America
    • Brazil
    • Chile
    • Rest of Latin America
  • Western Europe
    • Germany
    • UK
    • Italy
    • Spain
    • France
    • Nordic
    • BENELUX
    • Rest of Western Europe
  • Eastern Europe
    • Russia
    • Poland
    • Hungary
    • Balkan & Baltic
    • Rest of Eastern Europe
  • East Asia
    • China
    • Japan
    • South Korea
  • South Asia and Pacific
    • India
    • ASEAN
    • Australia & New Zealand
    • Rest of South Asia and Pacific
  • Middle East & Africa
    • Kingdom of Saudi Arabia
    • Other GCC Countries
    • Turkiye
    • South Africa
    • Other African Union
    • Rest of Middle East & Africa

Table of Content

  1. Executive Summary
    • Global Market Outlook
    • Demand-side Trends
    • Supply-side Trends
    • Technology Roadmap Analysis
    • Analysis and Recommendations
  2. Market Overview
    • Market Coverage / Taxonomy
    • Market Definition / Scope / Limitations
  3. Market Background
    • Market Dynamics
      • Drivers
      • Restraints
      • Opportunity
      • Trends
    • Scenario Forecast
      • Demand in Optimistic Scenario
      • Demand in Likely Scenario
      • Demand in Conservative Scenario
    • Opportunity Map Analysis
    • Product Life Cycle Analysis
    • Supply Chain Analysis
    • Investment Feasibility Matrix
    • Value Chain Analysis
    • PESTLE and Porter’s Analysis
    • Regulatory Landscape
    • Regional Parent Market Outlook
    • Production and Consumption Statistics
    • Import and Export Statistics
  4. Global Reactive Arthritis Treatment Market Analysis 2020-2024 and Forecast, 2025-2035
    • Historical Market Size Value (USD Mn) Analysis, 2020-2024
    • Current and Future Market Size Value (USD Mn) Projections, 2025-2035
      • Y-o-Y Growth Trend Analysis
      • Absolute $ Opportunity Analysis
  5. Global Reactive Arthritis Treatment Market Pricing Analysis 2020-2024 and Forecast 2025-2035
  6. Global Reactive Arthritis Treatment Market Analysis 2020-2024 and Forecast 2025-2035, By Drug Type
    • Introduction / Key Findings
    • Historical Market Size Value (USD Mn) Analysis By Drug Type , 2020-2024
    • Current and Future Market Size Value (USD Mn) Analysis and Forecast By Drug Type , 2025-2035
      • Antibiotics
      • Corticosteroids
      • Nonsteroidal Anti-Inflammatory Drugs (NSAIDs)
      • Disease Modifying Anti-Rheumatic Drugs (DMARDs)
      • Tumor Necrosis Factor (TNF) Blockers
      • Immunosuppressant Drugs
    • Y-o-Y Growth Trend Analysis By Drug Type , 2020-2024
    • Absolute $ Opportunity Analysis By Drug Type , 2025-2035
  7. Global Reactive Arthritis Treatment Market Analysis 2020-2024 and Forecast 2025-2035, By Route Of Administration
    • Introduction / Key Findings
    • Historical Market Size Value (USD Mn) Analysis By Route Of Administration, 2020-2024
    • Current and Future Market Size Value (USD Mn) Analysis and Forecast By Route Of Administration, 2025-2035
      • Oral
      • Topical/Transdermal
      • Parenteral
    • Y-o-Y Growth Trend Analysis By Route Of Administration, 2020-2024
    • Absolute $ Opportunity Analysis By Route Of Administration, 2025-2035
  8. Global Reactive Arthritis Treatment Market Analysis 2020-2024 and Forecast 2025-2035, By Distribution Channel
    • Introduction / Key Findings
    • Historical Market Size Value (USD Mn) Analysis By Distribution Channel, 2020-2024
    • Current and Future Market Size Value (USD Mn) Analysis and Forecast By Distribution Channel, 2025-2035
      • Hospital Pharmacies
      • Retail Pharmacies
      • Online Pharmacies
    • Y-o-Y Growth Trend Analysis By Distribution Channel, 2020-2024
    • Absolute $ Opportunity Analysis By Distribution Channel, 2025-2035
  9. Global Reactive Arthritis Treatment Market Analysis 2020-2024 and Forecast 2025-2035, By Region
    • Introduction
    • Historical Market Size Value (USD Mn) Analysis By Region, 2020-2024
    • Current Market Size Value (USD Mn) Analysis and Forecast By Region, 2025-2035
      • North America
      • Latin America
      • Western Europe
      • Eastern Europe
      • East Asia
      • South Asia and Pacific
      • Middle East & Africa
    • Market Attractiveness Analysis By Region
  10. North America Reactive Arthritis Treatment Market Analysis 2020-2024 and Forecast 2025-2035, By Country
    • Historical Market Size Value (USD Mn) Trend Analysis By Market Taxonomy, 2020-2024
    • Market Size Value (USD Mn) Forecast By Market Taxonomy, 2025-2035
      • By Country
        • USA
        • Canada
        • Mexico
      • By Drug Type
      • By Route Of Administration
      • By Distribution Channel
    • Market Attractiveness Analysis
      • By Country
      • By Drug Type
      • By Route Of Administration
      • By Distribution Channel
    • Key Takeaways
  11. Latin America Reactive Arthritis Treatment Market Analysis 2020-2024 and Forecast 2025-2035, By Country
    • Historical Market Size Value (USD Mn) Trend Analysis By Market Taxonomy, 2020-2024
    • Market Size Value (USD Mn) Forecast By Market Taxonomy, 2025-2035
      • By Country
        • Brazil
        • Chile
        • Rest of Latin America
      • By Drug Type
      • By Route Of Administration
      • By Distribution Channel
    • Market Attractiveness Analysis
      • By Country
      • By Drug Type
      • By Route Of Administration
      • By Distribution Channel
    • Key Takeaways
  12. Western Europe Reactive Arthritis Treatment Market Analysis 2020-2024 and Forecast 2025-2035, By Country
    • Historical Market Size Value (USD Mn) Trend Analysis By Market Taxonomy, 2020-2024
    • Market Size Value (USD Mn) Forecast By Market Taxonomy, 2025-2035
      • By Country
        • Germany
        • UK
        • Italy
        • Spain
        • France
        • Nordic
        • BENELUX
        • Rest of Western Europe
      • By Drug Type
      • By Route Of Administration
      • By Distribution Channel
    • Market Attractiveness Analysis
      • By Country
      • By Drug Type
      • By Route Of Administration
      • By Distribution Channel
    • Key Takeaways
  13. Eastern Europe Reactive Arthritis Treatment Market Analysis 2020-2024 and Forecast 2025-2035, By Country
    • Historical Market Size Value (USD Mn) Trend Analysis By Market Taxonomy, 2020-2024
    • Market Size Value (USD Mn) Forecast By Market Taxonomy, 2025-2035
      • By Country
        • Russia
        • Poland
        • Hungary
        • Balkan & Baltic
        • Rest of Eastern Europe
      • By Drug Type
      • By Route Of Administration
      • By Distribution Channel
    • Market Attractiveness Analysis
      • By Country
      • By Drug Type
      • By Route Of Administration
      • By Distribution Channel
    • Key Takeaways
  14. East Asia Reactive Arthritis Treatment Market Analysis 2020-2024 and Forecast 2025-2035, By Country
    • Historical Market Size Value (USD Mn) Trend Analysis By Market Taxonomy, 2020-2024
    • Market Size Value (USD Mn) Forecast By Market Taxonomy, 2025-2035
      • By Country
        • China
        • Japan
        • South Korea
      • By Drug Type
      • By Route Of Administration
      • By Distribution Channel
    • Market Attractiveness Analysis
      • By Country
      • By Drug Type
      • By Route Of Administration
      • By Distribution Channel
    • Key Takeaways
  15. South Asia and Pacific Reactive Arthritis Treatment Market Analysis 2020-2024 and Forecast 2025-2035, By Country
    • Historical Market Size Value (USD Mn) Trend Analysis By Market Taxonomy, 2020-2024
    • Market Size Value (USD Mn) Forecast By Market Taxonomy, 2025-2035
      • By Country
        • India
        • ASEAN
        • Australia & New Zealand
        • Rest of South Asia and Pacific
      • By Drug Type
      • By Route Of Administration
      • By Distribution Channel
    • Market Attractiveness Analysis
      • By Country
      • By Drug Type
      • By Route Of Administration
      • By Distribution Channel
    • Key Takeaways
  16. Middle East & Africa Reactive Arthritis Treatment Market Analysis 2020-2024 and Forecast 2025-2035, By Country
    • Historical Market Size Value (USD Mn) Trend Analysis By Market Taxonomy, 2020-2024
    • Market Size Value (USD Mn) Forecast By Market Taxonomy, 2025-2035
      • By Country
        • Kingdom of Saudi Arabia
        • Other GCC Countries
        • Turkiye
        • South Africa
        • Other African Union
        • Rest of Middle East & Africa
      • By Drug Type
      • By Route Of Administration
      • By Distribution Channel
    • Market Attractiveness Analysis
      • By Country
      • By Drug Type
      • By Route Of Administration
      • By Distribution Channel
    • Key Takeaways
  17. Key Countries Reactive Arthritis Treatment Market Analysis
    • USA
      • Pricing Analysis
      • Market Share Analysis, 2024
        • By Drug Type
        • By Route Of Administration
        • By Distribution Channel
    • Canada
      • Pricing Analysis
      • Market Share Analysis, 2024
        • By Drug Type
        • By Route Of Administration
        • By Distribution Channel
    • Mexico
      • Pricing Analysis
      • Market Share Analysis, 2024
        • By Drug Type
        • By Route Of Administration
        • By Distribution Channel
    • Brazil
      • Pricing Analysis
      • Market Share Analysis, 2024
        • By Drug Type
        • By Route Of Administration
        • By Distribution Channel
    • Chile
      • Pricing Analysis
      • Market Share Analysis, 2024
        • By Drug Type
        • By Route Of Administration
        • By Distribution Channel
    • Germany
      • Pricing Analysis
      • Market Share Analysis, 2024
        • By Drug Type
        • By Route Of Administration
        • By Distribution Channel
    • UK
      • Pricing Analysis
      • Market Share Analysis, 2024
        • By Drug Type
        • By Route Of Administration
        • By Distribution Channel
    • Italy
      • Pricing Analysis
      • Market Share Analysis, 2024
        • By Drug Type
        • By Route Of Administration
        • By Distribution Channel
    • Spain
      • Pricing Analysis
      • Market Share Analysis, 2024
        • By Drug Type
        • By Route Of Administration
        • By Distribution Channel
    • France
      • Pricing Analysis
      • Market Share Analysis, 2024
        • By Drug Type
        • By Route Of Administration
        • By Distribution Channel
    • India
      • Pricing Analysis
      • Market Share Analysis, 2024
        • By Drug Type
        • By Route Of Administration
        • By Distribution Channel
    • ASEAN
      • Pricing Analysis
      • Market Share Analysis, 2024
        • By Drug Type
        • By Route Of Administration
        • By Distribution Channel
    • Australia & New Zealand
      • Pricing Analysis
      • Market Share Analysis, 2024
        • By Drug Type
        • By Route Of Administration
        • By Distribution Channel
    • China
      • Pricing Analysis
      • Market Share Analysis, 2024
        • By Drug Type
        • By Route Of Administration
        • By Distribution Channel
    • Japan
      • Pricing Analysis
      • Market Share Analysis, 2024
        • By Drug Type
        • By Route Of Administration
        • By Distribution Channel
    • South Korea
      • Pricing Analysis
      • Market Share Analysis, 2024
        • By Drug Type
        • By Route Of Administration
        • By Distribution Channel
    • Russia
      • Pricing Analysis
      • Market Share Analysis, 2024
        • By Drug Type
        • By Route Of Administration
        • By Distribution Channel
    • Poland
      • Pricing Analysis
      • Market Share Analysis, 2024
        • By Drug Type
        • By Route Of Administration
        • By Distribution Channel
    • Hungary
      • Pricing Analysis
      • Market Share Analysis, 2024
        • By Drug Type
        • By Route Of Administration
        • By Distribution Channel
    • Kingdom of Saudi Arabia
      • Pricing Analysis
      • Market Share Analysis, 2024
        • By Drug Type
        • By Route Of Administration
        • By Distribution Channel
    • Turkiye
      • Pricing Analysis
      • Market Share Analysis, 2024
        • By Drug Type
        • By Route Of Administration
        • By Distribution Channel
    • South Africa
      • Pricing Analysis
      • Market Share Analysis, 2024
        • By Drug Type
        • By Route Of Administration
        • By Distribution Channel
  18. Market Structure Analysis
    • Competition Dashboard
    • Competition Benchmarking
    • Market Share Analysis of Top Players
      • By Regional
      • By Drug Type
      • By Route Of Administration
      • By Distribution Channel
  19. Competition Analysis
    • Competition Deep Dive
      • F. Hoffmann-La Roche Ltd
        • Overview
        • Product Portfolio
        • Profitability by Market Segments (Product/Age /Sales Channel/Region)
        • Sales Footprint
        • Strategy Overview
          • Marketing Strategy
          • Product Strategy
          • Channel Strategy
      • Teva Pharmaceutical Industries Ltd
      • Pfizer
      • Novartis AG
      • Amgen Inc
      • Velcura Therapeutics
      • Johnson & Johnson Services
  20. Assumptions & Acronyms Used
  21. Research Methodology

List of Tables

  • Table 1: Global Reactive Arthritis Treatment Market Value (USD Mn) Forecast by Region, 2020-2035
  • Table 2: Global Reactive Arthritis Treatment Market Value (USD Mn) Forecast by Drug Type , 2020-2035
  • Table 3: Global Reactive Arthritis Treatment Market Value (USD Mn) Forecast by Route Of Administration, 2020-2035
  • Table 4: Global Reactive Arthritis Treatment Market Value (USD Mn) Forecast by Distribution Channel, 2020-2035
  • Table 5: North America Reactive Arthritis Treatment Market Value (USD Mn) Forecast by Country, 2020-2035
  • Table 6: North America Reactive Arthritis Treatment Market Value (USD Mn) Forecast by Drug Type , 2020-2035
  • Table 7: North America Reactive Arthritis Treatment Market Value (USD Mn) Forecast by Route Of Administration, 2020-2035
  • Table 8: North America Reactive Arthritis Treatment Market Value (USD Mn) Forecast by Distribution Channel, 2020-2035
  • Table 9: Latin America Reactive Arthritis Treatment Market Value (USD Mn) Forecast by Country, 2020-2035
  • Table 10: Latin America Reactive Arthritis Treatment Market Value (USD Mn) Forecast by Drug Type , 2020-2035
  • Table 11: Latin America Reactive Arthritis Treatment Market Value (USD Mn) Forecast by Route Of Administration, 2020-2035
  • Table 12: Latin America Reactive Arthritis Treatment Market Value (USD Mn) Forecast by Distribution Channel, 2020-2035
  • Table 13: Western Europe Reactive Arthritis Treatment Market Value (USD Mn) Forecast by Country, 2020-2035
  • Table 14: Western Europe Reactive Arthritis Treatment Market Value (USD Mn) Forecast by Drug Type , 2020-2035
  • Table 15: Western Europe Reactive Arthritis Treatment Market Value (USD Mn) Forecast by Route Of Administration, 2020-2035
  • Table 16: Western Europe Reactive Arthritis Treatment Market Value (USD Mn) Forecast by Distribution Channel, 2020-2035
  • Table 17: Eastern Europe Reactive Arthritis Treatment Market Value (USD Mn) Forecast by Country, 2020-2035
  • Table 18: Eastern Europe Reactive Arthritis Treatment Market Value (USD Mn) Forecast by Drug Type , 2020-2035
  • Table 19: Eastern Europe Reactive Arthritis Treatment Market Value (USD Mn) Forecast by Route Of Administration, 2020-2035
  • Table 20: Eastern Europe Reactive Arthritis Treatment Market Value (USD Mn) Forecast by Distribution Channel, 2020-2035
  • Table 21: East Asia Reactive Arthritis Treatment Market Value (USD Mn) Forecast by Country, 2020-2035
  • Table 22: East Asia Reactive Arthritis Treatment Market Value (USD Mn) Forecast by Drug Type , 2020-2035
  • Table 23: East Asia Reactive Arthritis Treatment Market Value (USD Mn) Forecast by Route Of Administration, 2020-2035
  • Table 24: East Asia Reactive Arthritis Treatment Market Value (USD Mn) Forecast by Distribution Channel, 2020-2035
  • Table 25: South Asia and Pacific Reactive Arthritis Treatment Market Value (USD Mn) Forecast by Country, 2020-2035
  • Table 26: South Asia and Pacific Reactive Arthritis Treatment Market Value (USD Mn) Forecast by Drug Type , 2020-2035
  • Table 27: South Asia and Pacific Reactive Arthritis Treatment Market Value (USD Mn) Forecast by Route Of Administration, 2020-2035
  • Table 28: South Asia and Pacific Reactive Arthritis Treatment Market Value (USD Mn) Forecast by Distribution Channel, 2020-2035
  • Table 29: Middle East & Africa Reactive Arthritis Treatment Market Value (USD Mn) Forecast by Country, 2020-2035
  • Table 30: Middle East & Africa Reactive Arthritis Treatment Market Value (USD Mn) Forecast by Drug Type , 2020-2035
  • Table 31: Middle East & Africa Reactive Arthritis Treatment Market Value (USD Mn) Forecast by Route Of Administration, 2020-2035
  • Table 32: Middle East & Africa Reactive Arthritis Treatment Market Value (USD Mn) Forecast by Distribution Channel, 2020-2035

List of Figures

  • Figure 1: Global Reactive Arthritis Treatment Market Pricing Analysis
  • Figure 2: Global Reactive Arthritis Treatment Market Value (USD Mn) Forecast 2020–2035
  • Figure 3: Global Reactive Arthritis Treatment Market Value Share and BPS Analysis by Drug Type , 2025 and 2035
  • Figure 4: Global Reactive Arthritis Treatment Market Y-o-Y Growth Comparison by Drug Type , 2025–2035
  • Figure 5: Global Reactive Arthritis Treatment Market Attractiveness Analysis by Drug Type
  • Figure 6: Global Reactive Arthritis Treatment Market Value Share and BPS Analysis by Route Of Administration, 2025 and 2035
  • Figure 7: Global Reactive Arthritis Treatment Market Y-o-Y Growth Comparison by Route Of Administration, 2025–2035
  • Figure 8: Global Reactive Arthritis Treatment Market Attractiveness Analysis by Route Of Administration
  • Figure 9: Global Reactive Arthritis Treatment Market Value Share and BPS Analysis by Distribution Channel, 2025 and 2035
  • Figure 10: Global Reactive Arthritis Treatment Market Y-o-Y Growth Comparison by Distribution Channel, 2025–2035
  • Figure 11: Global Reactive Arthritis Treatment Market Attractiveness Analysis by Distribution Channel
  • Figure 12: Global Reactive Arthritis Treatment Market Value (USD Mn) Share and BPS Analysis by Region, 2025 and 2035
  • Figure 13: Global Reactive Arthritis Treatment Market Y-o-Y Growth Comparison by Region, 2025–2035
  • Figure 14: Global Reactive Arthritis Treatment Market Attractiveness Analysis by Region
  • Figure 15: North America Reactive Arthritis Treatment Market Incremental Dollar Opportunity, 2025–2035
  • Figure 16: Latin America Reactive Arthritis Treatment Market Incremental Dollar Opportunity, 2025–2035
  • Figure 17: Western Europe Reactive Arthritis Treatment Market Incremental Dollar Opportunity, 2025–2035
  • Figure 18: Eastern Europe Reactive Arthritis Treatment Market Incremental Dollar Opportunity, 2025–2035
  • Figure 19: East Asia Reactive Arthritis Treatment Market Incremental Dollar Opportunity, 2025–2035
  • Figure 20: South Asia and Pacific Reactive Arthritis Treatment Market Incremental Dollar Opportunity, 2025–2035
  • Figure 21: Middle East & Africa Reactive Arthritis Treatment Market Incremental Dollar Opportunity, 2025–2035
  • Figure 22: North America Reactive Arthritis Treatment Market Value Share and BPS Analysis by Country, 2025 and 2035
  • Figure 23: North America Reactive Arthritis Treatment Market Value Share and BPS Analysis by Drug Type , 2025 and 2035
  • Figure 24: North America Reactive Arthritis Treatment Market Y-o-Y Growth Comparison by Drug Type , 2025–2035
  • Figure 25: North America Reactive Arthritis Treatment Market Attractiveness Analysis by Drug Type
  • Figure 26: North America Reactive Arthritis Treatment Market Value Share and BPS Analysis by Route Of Administration, 2025 and 2035
  • Figure 27: North America Reactive Arthritis Treatment Market Y-o-Y Growth Comparison by Route Of Administration, 2025–2035
  • Figure 28: North America Reactive Arthritis Treatment Market Attractiveness Analysis by Route Of Administration
  • Figure 29: North America Reactive Arthritis Treatment Market Value Share and BPS Analysis by Distribution Channel, 2025 and 2035
  • Figure 30: North America Reactive Arthritis Treatment Market Y-o-Y Growth Comparison by Distribution Channel, 2025–2035
  • Figure 31: North America Reactive Arthritis Treatment Market Attractiveness Analysis by Distribution Channel
  • Figure 32: Latin America Reactive Arthritis Treatment Market Value Share and BPS Analysis by Country, 2025 and 2035
  • Figure 33: Latin America Reactive Arthritis Treatment Market Value Share and BPS Analysis by Drug Type , 2025 and 2035
  • Figure 34: Latin America Reactive Arthritis Treatment Market Y-o-Y Growth Comparison by Drug Type , 2025–2035
  • Figure 35: Latin America Reactive Arthritis Treatment Market Attractiveness Analysis by Drug Type
  • Figure 36: Latin America Reactive Arthritis Treatment Market Value Share and BPS Analysis by Route Of Administration, 2025 and 2035
  • Figure 37: Latin America Reactive Arthritis Treatment Market Y-o-Y Growth Comparison by Route Of Administration, 2025–2035
  • Figure 38: Latin America Reactive Arthritis Treatment Market Attractiveness Analysis by Route Of Administration
  • Figure 39: Latin America Reactive Arthritis Treatment Market Value Share and BPS Analysis by Distribution Channel, 2025 and 2035
  • Figure 40: Latin America Reactive Arthritis Treatment Market Y-o-Y Growth Comparison by Distribution Channel, 2025–2035
  • Figure 41: Latin America Reactive Arthritis Treatment Market Attractiveness Analysis by Distribution Channel
  • Figure 42: Western Europe Reactive Arthritis Treatment Market Value Share and BPS Analysis by Country, 2025 and 2035
  • Figure 43: Western Europe Reactive Arthritis Treatment Market Value Share and BPS Analysis by Drug Type , 2025 and 2035
  • Figure 44: Western Europe Reactive Arthritis Treatment Market Y-o-Y Growth Comparison by Drug Type , 2025–2035
  • Figure 45: Western Europe Reactive Arthritis Treatment Market Attractiveness Analysis by Drug Type
  • Figure 46: Western Europe Reactive Arthritis Treatment Market Value Share and BPS Analysis by Route Of Administration, 2025 and 2035
  • Figure 47: Western Europe Reactive Arthritis Treatment Market Y-o-Y Growth Comparison by Route Of Administration, 2025–2035
  • Figure 48: Western Europe Reactive Arthritis Treatment Market Attractiveness Analysis by Route Of Administration
  • Figure 49: Western Europe Reactive Arthritis Treatment Market Value Share and BPS Analysis by Distribution Channel, 2025 and 2035
  • Figure 50: Western Europe Reactive Arthritis Treatment Market Y-o-Y Growth Comparison by Distribution Channel, 2025–2035
  • Figure 51: Western Europe Reactive Arthritis Treatment Market Attractiveness Analysis by Distribution Channel
  • Figure 52: Eastern Europe Reactive Arthritis Treatment Market Value Share and BPS Analysis by Country, 2025 and 2035
  • Figure 53: Eastern Europe Reactive Arthritis Treatment Market Value Share and BPS Analysis by Drug Type , 2025 and 2035
  • Figure 54: Eastern Europe Reactive Arthritis Treatment Market Y-o-Y Growth Comparison by Drug Type , 2025–2035
  • Figure 55: Eastern Europe Reactive Arthritis Treatment Market Attractiveness Analysis by Drug Type
  • Figure 56: Eastern Europe Reactive Arthritis Treatment Market Value Share and BPS Analysis by Route Of Administration, 2025 and 2035
  • Figure 57: Eastern Europe Reactive Arthritis Treatment Market Y-o-Y Growth Comparison by Route Of Administration, 2025–2035
  • Figure 58: Eastern Europe Reactive Arthritis Treatment Market Attractiveness Analysis by Route Of Administration
  • Figure 59: Eastern Europe Reactive Arthritis Treatment Market Value Share and BPS Analysis by Distribution Channel, 2025 and 2035
  • Figure 60: Eastern Europe Reactive Arthritis Treatment Market Y-o-Y Growth Comparison by Distribution Channel, 2025–2035
  • Figure 61: Eastern Europe Reactive Arthritis Treatment Market Attractiveness Analysis by Distribution Channel
  • Figure 62: East Asia Reactive Arthritis Treatment Market Value Share and BPS Analysis by Country, 2025 and 2035
  • Figure 63: East Asia Reactive Arthritis Treatment Market Value Share and BPS Analysis by Drug Type , 2025 and 2035
  • Figure 64: East Asia Reactive Arthritis Treatment Market Y-o-Y Growth Comparison by Drug Type , 2025–2035
  • Figure 65: East Asia Reactive Arthritis Treatment Market Attractiveness Analysis by Drug Type
  • Figure 66: East Asia Reactive Arthritis Treatment Market Value Share and BPS Analysis by Route Of Administration, 2025 and 2035
  • Figure 67: East Asia Reactive Arthritis Treatment Market Y-o-Y Growth Comparison by Route Of Administration, 2025–2035
  • Figure 68: East Asia Reactive Arthritis Treatment Market Attractiveness Analysis by Route Of Administration
  • Figure 69: East Asia Reactive Arthritis Treatment Market Value Share and BPS Analysis by Distribution Channel, 2025 and 2035
  • Figure 70: East Asia Reactive Arthritis Treatment Market Y-o-Y Growth Comparison by Distribution Channel, 2025–2035
  • Figure 71: East Asia Reactive Arthritis Treatment Market Attractiveness Analysis by Distribution Channel
  • Figure 72: South Asia and Pacific Reactive Arthritis Treatment Market Value Share and BPS Analysis by Country, 2025 and 2035
  • Figure 73: South Asia and Pacific Reactive Arthritis Treatment Market Value Share and BPS Analysis by Drug Type , 2025 and 2035
  • Figure 74: South Asia and Pacific Reactive Arthritis Treatment Market Y-o-Y Growth Comparison by Drug Type , 2025–2035
  • Figure 75: South Asia and Pacific Reactive Arthritis Treatment Market Attractiveness Analysis by Drug Type
  • Figure 76: South Asia and Pacific Reactive Arthritis Treatment Market Value Share and BPS Analysis by Route Of Administration, 2025 and 2035
  • Figure 77: South Asia and Pacific Reactive Arthritis Treatment Market Y-o-Y Growth Comparison by Route Of Administration, 2025–2035
  • Figure 78: South Asia and Pacific Reactive Arthritis Treatment Market Attractiveness Analysis by Route Of Administration
  • Figure 79: South Asia and Pacific Reactive Arthritis Treatment Market Value Share and BPS Analysis by Distribution Channel, 2025 and 2035
  • Figure 80: South Asia and Pacific Reactive Arthritis Treatment Market Y-o-Y Growth Comparison by Distribution Channel, 2025–2035
  • Figure 81: South Asia and Pacific Reactive Arthritis Treatment Market Attractiveness Analysis by Distribution Channel
  • Figure 82: Middle East & Africa Reactive Arthritis Treatment Market Value Share and BPS Analysis by Country, 2025 and 2035
  • Figure 83: Middle East & Africa Reactive Arthritis Treatment Market Value Share and BPS Analysis by Drug Type , 2025 and 2035
  • Figure 84: Middle East & Africa Reactive Arthritis Treatment Market Y-o-Y Growth Comparison by Drug Type , 2025–2035
  • Figure 85: Middle East & Africa Reactive Arthritis Treatment Market Attractiveness Analysis by Drug Type
  • Figure 86: Middle East & Africa Reactive Arthritis Treatment Market Value Share and BPS Analysis by Route Of Administration, 2025 and 2035
  • Figure 87: Middle East & Africa Reactive Arthritis Treatment Market Y-o-Y Growth Comparison by Route Of Administration, 2025–2035
  • Figure 88: Middle East & Africa Reactive Arthritis Treatment Market Attractiveness Analysis by Route Of Administration
  • Figure 89: Middle East & Africa Reactive Arthritis Treatment Market Value Share and BPS Analysis by Distribution Channel, 2025 and 2035
  • Figure 90: Middle East & Africa Reactive Arthritis Treatment Market Y-o-Y Growth Comparison by Distribution Channel, 2025–2035
  • Figure 91: Middle East & Africa Reactive Arthritis Treatment Market Attractiveness Analysis by Distribution Channel
  • Figure 92: Global Reactive Arthritis Treatment Market – Tier Structure Analysis
  • Figure 93: Global Reactive Arthritis Treatment Market – Company Share Analysis

Frequently Asked Questions

How big is the reactive arthritis treatment market in 2025?

The global reactive arthritis treatment market is estimated to be valued at USD 742.1 million in 2025.

What will be the size of reactive arthritis treatment market in 2035?

The market size for the reactive arthritis treatment market is projected to reach USD 1,208.8 million by 2035.

How much will be the reactive arthritis treatment market growth between 2025 and 2035?

The reactive arthritis treatment market is expected to grow at a 5.0% CAGR between 2025 and 2035.

What are the key product types in the reactive arthritis treatment market?

The key product types in reactive arthritis treatment market are antibiotics, corticosteroids, nonsteroidal anti-inflammatory drugs (nsaids), disease modifying anti-rheumatic drugs (dmards), tumor necrosis factor (tnf) blockers and immunosuppressant drugs.

Which route of administration segment to contribute significant share in the reactive arthritis treatment market in 2025?

In terms of route of administration, oral segment to command 45.2% share in the reactive arthritis treatment market in 2025.

Explore Similar Insights

Future Market Insights

Reactive Arthritis Treatment Market

Chat With MaRIA

Chat With

MaRIA

Hi There, I am MaRIA, Your Market Research Intelligence Assistant. How may I help you?