Canine Arthritis Treatment Market
Market Insights on Canine Arthritis Treatment covering sales outlook, demand forecast & up-to-date key trends
Canine Arthritis Treatment Market By Treatment (Non-steroidal Anti-inflammatory Drugs (NSAIDs), Opioids, Stem Cell Therapy), Route of Administration (Oral Canine Arthritis Treatment, Injectable Canine Arthritis Treatment) & Region - Forecast 2022 - 2028
Canine Arthritis Treatment Market Outlook (2022-2028)
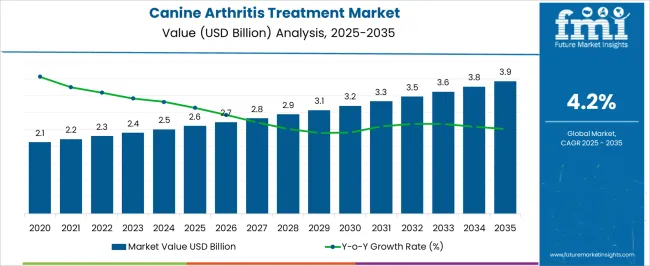
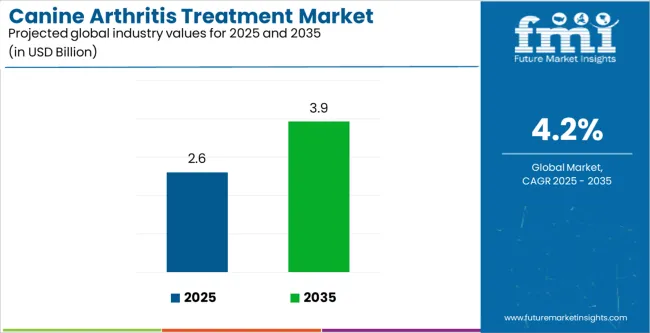
[183 Pages Report] The global canine arthritis treatment market stands at a net worth of US$ 2.39 Bn in 2022. Worldwide demand for canine arthritis treatment medications is predicted to rise at a CAGR of 4.2% and attain a market valuation of US$ 3.05 Bn by 2028.
Canine Arthritis Treatment Market Size (2022) |
US$ 2.39 Bn |
Sales Forecast (2028) |
US$ 3.05 Bn |
Global Market Growth Rate (2022 to 2028) |
4.2% CAGR |
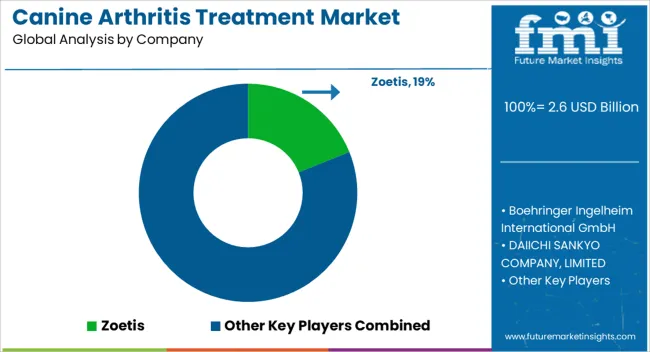
Share of Top 5 Market Players |
55% |
Canine arthritis treatment medicines accounted for 17.2% share of the global rare inflammatory disease treatment market in 2021.
Let us know your requirement to get
100% FREE customization
How The Market Progressed Till June 2022?
Particulars |
Details |
H1, 2021 |
4.44% |
H1, 2022 Projected |
4.19% |
H1, 2022 Outlook |
4.09% |
BPS Change - H1, 2022 (O) – H1, 2022 (P) |
(-) 10 ↓ |
BPS Change – H1, 2022 (O) – H1, 2021 |
(-) 35 ↓ |
The variation between the BPS values observed within this market in H1, 2022 - outlook over H1, 2022 projected reflects a decline of 10 BPS units. A reduction in the BPS growth in H1-2022 over H1-2021 by 35 Basis Point Share (BPS) is demonstrated by the market.
The market for canine arthritis treatment displays a negative BPS growth due to the absence of standardized treatment modalities, as well as the lack of licensed treatments at present. Moreover, limited data on the scientific efficacy of current treatment modalities for canine arthritis has further resulted in a decline in the BPS value change.
However, with the adoption of regenerative autosomal SVF stem cell therapies, the current limitations could be overlooked, and hence the market for canine arthritis treatment is expected to present a positive growth outlook during the forecasted years.
The canine arthritis treatment market is subject to market or conditional approvals for novel veterinary biologics, as per the macro and industry standards. With the oversight from the Centre for Veterinary Medicine (CVM) within the FDA regulatory body, the novel effective therapies for canine arthritis originating after approvals with evaluated efficacy and safety could pose a positive impact upon the growth of the overall market, thus presenting itself as a key developmental factor.
Revenue Analysis of Canine Arthritis Treatment (2013-2021) Vs Market Outlook (2022 to 2028)
“High Demand for Efficient Monitoring & Diagnosis of Canine Arthritis for Companion Animals”
During the historical period of 2013 to 2021, the canine arthritis treatment market expanded at a CAGR of 3.8%.
Canine arthritis is a degenerative joint disease that produces inflammation in the joints of dogs as a result of frequent rubbing, cartilage degradation, and long-term joint disease. The knees, elbows, shoulders, hips, and spinal cord are usually the most affected joints in animals. Injuries, overweight, and faulty bone formation are some of the reasons for canine arthritis in dogs.
Increasing prevalence of obesity associated with arthritis, the rising adoption rate of canines, growing awareness about pet-related diseases, high disposable income, and ease in the regulatory approvals for veterinary medicines have been driving factors for the growth of the canine arthritis treatment medicine market.
The global canine arthritis treatment market is anticipated to rise at a CAGR of 4.2% from 2022 to 2028.
What Key Factors Are Driving Overall Market Growth?
“Growing Awareness about Veterinary Epidemiology of Diseases to Boost Market Growth”
- Launch of Veterinary Regenerative Medicines for Canine Arthritis Treatment
Fast FDA approvals for veterinary therapeutic drugs and veterinary regenerative medicines to repair diseased/damaged tissues and organs in animals are contributing to the growth of the canine arthritis treatment market. While veterinary drugs for canine arthritis treatment continue to account for higher sales, veterinary regenerative medicines prove to be an interesting area of research and development for developing novel therapies, such as stem cell therapy.
- High Adoption of Allogeneic Stem Cell Therapy
There is an increase in the number of allogeneic stem cell therapy for canine arthritis treatment, due to its higher success rate coupled with 100% safe therapy with better outcomes. Other factors such as an increase in demand for effective therapy processes as well as advancements in pet technology will boost the growth rate of the canine arthritis treatment products and medication market.
Find your sweet spots for generating winning opportunities in this market.
Talk to AnalystWhat Are Challenging Factors For Market Expansion?
“High Cost of Canine Osteoarthritis Treatment Hampering Market Growth”
The unavailability of trained professionals in the treatment of canine arthritis, expensive treatment, and the lengthy drug approval process are the factors hampering the market growth.
The market is projected to be hampered by adverse effects associated with canine osteoarthritis treatment.
Why Is North America Expected To Lead The Global Canine Arthritis Treatment Market?
“High Awareness about Dog Arthritis Treatment across North America”
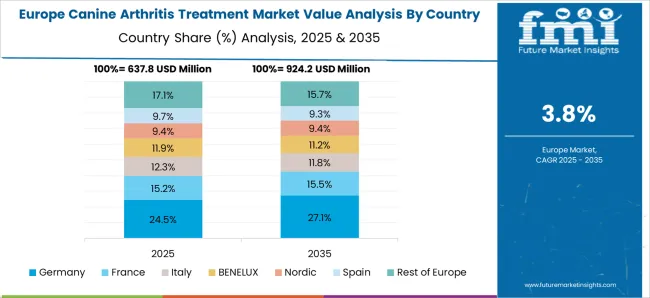
North America will continue to be a prominent regional market for canine arthritis treatment, due to the increasing prevalence of arthritis, awareness of diseases, and accessibility of dog arthritis treatment and diagnostic methods.
Increasing animal adoption, as well as rising consumer spending on veterinarian services, are driving market expansion in the region. Also expanding veterinary healthcare infrastructure in the region is expected to drive the market growth.

A unified Market Research Subscription Platform, built for today's disparate research needs.
Country-Wise Analysis
Why is the U.S. Canine Arthritis Treatment Market Growing at a Rapid Pace?
“Rising Number of Veterinary Clinics to Augment Market Growth”
According to the American Animal Hospital Association (AAHA) and the American Veterinary Medical Association (AVMA), there are over 26,000 small animal veterinary clinics in the United States, resulting in a considerable expansion in the veterinary industry.
The launch of better therapeutic drugs prominently accounts for the growing popularity of canine arthritis treatment in the U.S. Consistent rise in the number of manufacturers and distributors, is likely to contribute to the growth of the canine arthritis treatment market.
What is the Demand Outlook for Canine Arthritis Treatment in China?
“Rising Initiatives by NGOs for Animal Welfare across the Country”
Increase in investments in the animal healthcare domain, rapid development of animal healthcare infrastructure, and rising prevalence of canine arthritis in China are factors offering a strong impetus to the growth of the canine arthritis treatment market.
With approximately 25 million canines, China has the greatest dog population in the Asia Pacific region. On the basis of the rising number of NGOs campaigning for animal welfare, as well as convenient access to treatment and diagnostic technologies, the market in China is expected to grow at the fastest rate over the forecast period.
Category-Wise Insights
Which Canine Arthritis Treatment is Projected to Get Traction?
“Non-steroidal Anti-inflammatory Drugs (NSAIDs) to Witness Healthy Demand Growth Owing to High Effectiveness in Canine Arthritis Treatment”
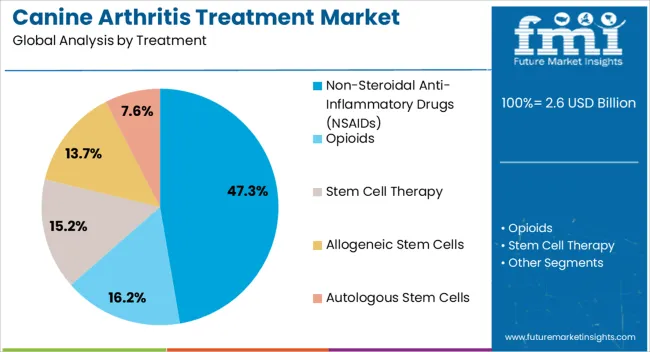
Non-steroidal anti-inflammatory drugs remain the most preferred option for treatment. Non-steroidal anti-inflammatory drugs (NSAIDs) are commonly used to treat dogs' ailments and can significantly enhance movement and well-being.
Non-steroidal anti-inflammatory medicines are being used as the first choice of treatment for inflammatory diseases by a veterinary physician, as it has better anti-inflammatory action, safety profile, and fast onset of action. NSAIDs inhibit the formation of prostaglandins, which are responsible for arthritis-related inflammation. They accomplish this by inhibiting the enzyme cyclooxygenase.
Opioids therapy is further likely to gain significant momentum over the forecast period. An increase in the number of non-steroidal anti-inflammatory medications and the use of stem cell therapies for canine arthritis treatment will continue to contribute to the market growth.
Which is the Dominant Distribution Channel for Canine Arthritis Treatment Drugs?
“Growing Penetration of Veterinary Hospitals & Clinics across Geographies”
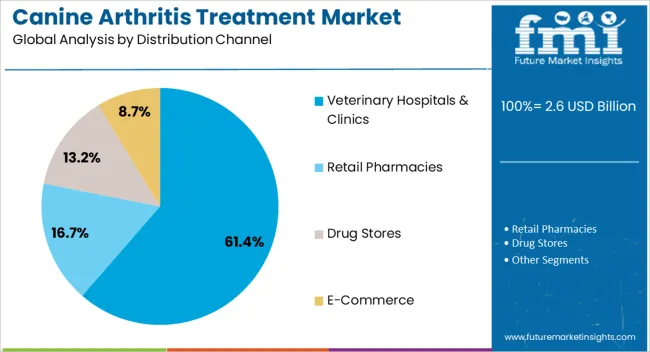
Veterinary hospitals & clinics are expected to account for 36.4% share of the canine arthritis treatment market in 2022.
Animal healthcare product manufacturers mainly rely on a direct sales force to gain better access to distribution channels. Through this method, companies also seek to raise awareness, provide training, and support in areas of disease management and adherence to treatment protocols.
People appear to spend more money on veterinary services than on pharmaceuticals. Several veterinary hospitals & clinics from around the world are forming an alliance to broaden their reach and secure profit in the global marketplace.
Popularity of canine stem cell therapy is likely to increase in the near future, owing to an increase in the number of veterinary hospitals & clinics.
COVID-19 Impact On Demand For Canine Arthritis Treatment
The COVID-19 pandemic had a negative influence on the canine arthritis treatment market to some extent. Due to the COVID-19 pandemic, tight lockdowns and isolation laws were implemented around the world, resulting in a limitation on non-essential vet visits. Furthermore, the business was adversely impacted by the worldwide delay of medical operations.
On the other hand, the industry is predicted to revive as professional business services increase their efforts to provide support for pet care. Pet adoption and foster care applications are on the rise, which is expected to help the market thrive over the coming years.
Competitive Landscape
Key players in the canine arthritis market continue to increase their share with the launch of new products. Joint ventures and partnerships with distributors are the strategic actions practiced by the majority of key players.
Major canine arthritis medication manufacturers are focusing on inorganic growth strategies to make a strong hold on targeted in-licensing and acquisitions through expanding their R&D activities and distribution channels, particularly including specialist retail chains.
For instance,
- In 2020, The Committee for Medicinal Products for Veterinary Use (CVMP) approved Zoetis, a marketing authorization variation for the veterinary medicinal product Cytopoint, which includes the addition of a new therapeutic indication for the treatment of pruritus associated with allergic dermatitis in dogs.
Canine Arthritis Treatment Industry Report Scope
Attribute |
Details |
Forecast Period |
2022-2028 |
Historical Data Available for |
2013-2021 |
Market Analysis |
Value in US$ Mn |
Key Regions Covered |
|
Key Countries Covered |
|
Key Market Segments Covered |
|
Key Companies Profiled |
|
Pricing |
Available upon Request |
Key Segments Of Canine Arthritis Treatment Industry Survey
Canine Arthritis Treatment Market by Treatment:
- Non-steroidal Anti-inflammatory Drugs (NSAIDs)
- Opioids
- Stem Cell Therapy
- Allogeneic Stem Cells
- Autologous Stem Cells
Canine Arthritis Treatment Market by Route of Administration:
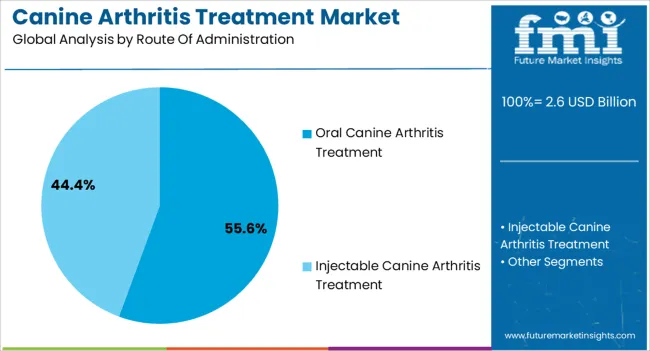
- Oral Canine Arthritis Treatment
- Injectable Canine Arthritis Treatment
Canine Arthritis Treatment Market by Distribution Channel:
- Veterinary Hospitals & Clinics
- Retail Pharmacies
- Drug Stores
- e-Commerce
Canine Arthritis Treatment Market by Region:
- North America Canine Arthritis Treatment Market
- Latin America Canine Arthritis Treatment Market
- Europe Canine Arthritis Treatment Market
- East Asia Canine Arthritis Treatment Market
- South Asia & Pacific Canine Arthritis Treatment Market
- Middle East & Africa (MEA) Canine Arthritis Treatment Market
Frequently Asked Questions
The global canine arthritis treatment market is currently valued at around US$ 2.39 Bn.
The market is expected to rise due to increase in dog ownership, improving veterinary healthcare infrastructure, and expanding treatment options for canine arthritis.
The market for canine arthritis treatment is estimated to exhibit a CAGR of 4.2% during the forecast period (2022-2028).
Major canine arthritis treatment providers include Boehringer Ingelheim International GmbH., DAIICHI SANKYO COMPANY, LIMITED, Thorne, NUTRI-VET, and American Regent, Inc.
Veterinary hospitals & clinics account for 36.4% share of canine arthritis treatment.
The canine arthritis treatment market is expected to reach a valuation of US$ 3.05 Bn by 2028.
Table of Content
1. Executive Summary
1.1. Market Outlook
1.2. Analysis and Recommendations
2. Market Overview
2.1. Market Coverage / Taxonomy
2.2. Market Definition / Scope / Limitations
3. Market Background
3.1. Macro-Economic Factors
3.1.1. Drivers
3.1.2. Restraints
3.1.3. Opportunity Analysis
3.1.4. Trends
4. Market Context
4.1. Global Healthcare Market Outlook
4.2. Global Scenario
4.3. Pet Ownership in European Union (EU)
4.4. Share of Household Owing at least one Dog in European Union (EU)
4.5. Spending on Health of Pets
4.6. Vet care Spending on Dogs
4.7. Key Regulations and Guidelines
5. Global Market (in Value or Size in US$ Mn) Analysis 2013-2021 and Forecast, 2022-2028
5.1. Historical Market Value (US$ Mn) Analysis, 2013-2021
5.2. Current and Future Market Value (US$ Mn) Projections, 2022-2028
5.2.1. Y-o-Y Growth Trend Analysis
5.2.2. Absolute $ Opportunity Analysis
5.2.3. Market Value Comparison
6. Global Market Analysis 2013-2021 and Forecast 2022-2028, by Treatment Type
6.1. Introduction / Key Findings
6.2. Historical Market Size (US$ Mn) Analysis By Treatment Type, 2013-2021
6.3. Current and Future Market Size (US$ Mn) Analysis and Forecast By Treatment Type, 2022 - 2028
6.3.1. Non-steroidal anti-inflammatory Medications (NSAIDs)
6.3.2. Opioids
6.3.3. Stem Cell Therapy
6.3.3.1. Allogeneic Stem Cells
6.3.3.2. Autologous Stem Cells
6.4. Market Attractiveness Analysis By Treatment Type
7. Global Market Analysis 2013-2021 and Forecast 2022-2028, by Route of Administration
7.1. Introduction / Key Findings
7.2. Historical Market Size (US$ Mn) Analysis By Route of Administration, 2013-2021
7.3. Current and Future Market Size (US$ Mn) Analysis and Forecast By Route of Administration, 2022 - 2028
7.3.1. Oral
7.3.2. Injectable
7.4. Market Attractiveness Analysis By Route of Administration
8. Global Market Analysis 2013-2021 and Forecast 2022-2028, by Distribution Channel
8.1. Introduction / Key Findings
8.2. Historical Market Size (US$ Mn) Analysis By Distribution Channel, 2013-2021
8.3. Current and Future Market Size (US$ Mn) Analysis and Forecast By Distribution Channel, 2022 - 2028
8.3.1. Veterinary Hospital and Clinics
8.3.2. Retail Pharmacies
8.3.3. Drug Stores
8.3.4. E-Commerce
8.3.5. Market Attractiveness Analysis By Distribution Channel
9. Global Market Analysis 2013-2021 and Forecast 2022-2028, by Region
9.1. Introduction
9.2. Historical Market Size (US$ Mn) Analysis By Region, 2013-2021
9.3. Current Market Size (US$ Mn) Analysis and Forecast By Region, 2022 - 2028
9.3.1. North America
9.3.2. Latin America
9.3.3. Europe
9.3.4. Asia-Pacific Excluding Japan
9.3.5. Japan
9.3.6. Middle East and Africa
9.4. Market Attractiveness Analysis By Region
10. North America Market Analysis 2013-2021 and Forecast 2022-2028
10.1. Introduction
10.2. Historical Market Size (US$ Mn) Trend Analysis By Market Taxonomy, 2013-2021
10.3. Market Size (US$ Mn) Forecast By Market Taxonomy, 2022 - 2028
10.3.1. By Country
10.3.1.1. U.S.
10.3.1.2. Canada
10.3.2. By Treatment Type
10.3.3. By Route of Administration
10.3.4. By Distribution Channel
10.4. Market Attractiveness Analysis
10.4.1. By Country
10.4.2. By Treatment Type
10.4.3. By Route of Administration
10.4.4. By Distribution Channel
11. Latin America Market Analysis 2013-2021 and Forecast 2022-2028
11.1. Introduction
11.2. Historical Market Size (US$ Mn) Trend Analysis By Market Taxonomy, 2013-2021
11.3. Market Size (US$ Mn) Forecast By Market Taxonomy, 2022 - 2028
11.3.1. By Country
11.3.1.1. Mexico
11.3.1.2. Brazil
11.3.1.3. Rest of Latin America
11.3.2. By Treatment Type
11.3.3. By Route of Administration
11.3.4. By Distribution Channel
11.4. Market Attractiveness Analysis
11.4.1. By Country
11.4.2. By Treatment Type
11.4.3. By Route of Administration
11.4.4. By Distribution Channel
12. Europe Market Analysis 2013-2021 and Forecast 2022-2028
12.1. Introduction
12.2. Historical Market Size (US$ Mn) Trend Analysis By Market Taxonomy, 2013-2021
12.3. Market Size (US$ Mn) Forecast By Market Taxonomy, 2022 - 2028
12.3.1. By Country
12.3.1.1. Germany
12.3.1.2. Italy
12.3.1.3. France
12.3.1.4. U.K.
12.3.1.5. Spain
12.3.1.6. Russia
12.3.1.7. Rest of Europe
12.3.2. By Treatment Type
12.3.3. By Route of Administration
12.3.4. By Distribution Channel
12.4. Market Attractiveness Analysis
12.4.1. By Country
12.4.2. By Treatment Type
12.4.3. By Route of Administration
12.4.4. By Distribution Channel
13. APEJ Market Analysis 2013-2021 and Forecast 2022-2028
13.1. Introduction
13.2. Historical Market Size (US$ Mn) Trend Analysis By Market Taxonomy, 2013-2021
13.3. Market Size (US$ Mn) Forecast By Market Taxonomy, 2022 - 2028
13.3.1. By Country
13.3.1.1. China
13.3.1.2. India
13.3.1.3. Australia & New Zealand
13.3.1.4. ASEAN
13.3.1.5. Rest of APEJ
13.3.2. By Treatment Type
13.3.3. By Route of Administration
13.3.4. By Distribution Channel
13.4. Market Attractiveness Analysis
13.4.1. By Country
13.4.2. By Treatment Type
13.4.3. By Route of Administration
13.4.4. By Distribution Channel
14. Japan Market Analysis 2013-2021 and Forecast 2022-2028
14.1. Introduction
14.2. Historical Market Size (US$ Mn) Trend Analysis By Market Taxonomy, 2013-2021
14.3. Market Size (US$ Mn) Forecast By Market Taxonomy, 2022 - 2028
14.3.1. By Treatment Type
14.3.2. By Route of Administration
14.3.3. By Distribution Channel
14.4. Market Attractiveness Analysis
14.4.1. By Treatment Type
14.4.2. By Route of Administration
14.4.3. By Distribution Channel
15. Middle East and Africa Market Analysis 2013-2021 and Forecast 2022-2028
15.1. Introduction
15.2. Historical Market Size (US$ Mn) Trend Analysis By Market Taxonomy, 2013-2021
15.3. Market Size (US$ Mn) Forecast By Market Taxonomy, 2022 - 2028
15.3.1. By Country
15.3.1.1. GCC Countries
15.3.1.2. South Africa
15.3.1.3. Rest of MEA
15.4. Market Attractiveness Analysis
15.4.1. By Country
15.4.2. By Treatment Type
15.4.3. By Route of Administration
16. Competition Analysis
16.1. Competition Dashboard
16.2. Competition Deep Dive
16.2.1. Elanco (Eli Lily and Company)
16.2.1.1. Overview
16.2.1.2. Product Portfolio
16.2.1.3. Profitability by Market Segments (Product/Route of Administration/Region)
16.2.1.4. Sales Footprint
16.2.1.5. Strategy Overview
16.2.1.5.1. Marketing Strategy
16.2.1.5.2. Product Strategy
16.2.1.5.3. Route of Administration Strategy
16.2.2. Ceva Santé Animale
16.2.2.1. Overview
16.2.2.2. Product Portfolio
16.2.2.3. Profitability by Market Segments (Product/Route of Administration/Region)
16.2.2.4. Sales Footprint
16.2.2.5. Strategy Overview
16.2.2.5.1. Marketing Strategy
16.2.2.5.2. Product Strategy
16.2.2.5.3. Route of Administration Strategy
16.2.3. Vetoquinol S.A
16.2.3.1. Overview
16.2.3.2. Product Portfolio
16.2.3.3. Profitability by Market Segments (Product/Route of Administration/Region)
16.2.3.4. Sales Footprint
16.2.3.5. Strategy Overview
16.2.3.5.1. Marketing Strategy
16.2.3.5.2. Product Strategy
16.2.3.5.3. Route of Administration Strategy
16.2.4. Norbrook Laboratories Limited
16.2.4.1. Overview
16.2.4.2. Product Portfolio
16.2.4.3. Profitability by Market Segments (Product/Route of Administration/Region)
16.2.4.4. Sales Footprint
16.2.4.5. Strategy Overview
16.2.4.5.1. Marketing Strategy
16.2.4.5.2. Product Strategy
16.2.4.5.3. Route of Administration Strategy
16.2.5. Aratana Therapeutics IncMylan Pharmaceuticals Inc.
16.2.5.1. Overview
16.2.5.2. Product Portfolio
16.2.5.3. Profitability by Market Segments (Product/Route of Administration/Region)
16.2.5.4. Sales Footprint
16.2.5.5. Strategy Overview
16.2.5.5.1. Marketing Strategy
16.2.5.5.2. Product Strategy
16.2.5.5.3. Route of Administration Strategy
16.2.6. Boehringer Ingelheim
16.2.6.1. Overview
16.2.6.2. Product Portfolio
16.2.6.3. Profitability by Market Segments (Product/Route of Administration/Region)
16.2.6.4. Sales Footprint
16.2.6.5. Strategy Overview
16.2.6.5.1. Marketing Strategy
16.2.6.5.2. Product Strategy
16.2.6.5.3. Route of Administration Strategy
16.2.7. Zoetis Inc
16.2.7.1. Overview
16.2.7.2. Product Portfolio
16.2.7.3. Profitability by Market Segments (Product/Route of Administration/Region)
16.2.7.4. Sales Footprint
16.2.7.5. Strategy Overview
16.2.7.5.1. Marketing Strategy
16.2.7.5.2. Product Strategy
16.2.7.5.3. Route of Administration Strategy
16.2.8. Bayer AG
16.2.8.1. Overview
16.2.8.2. Product Portfolio
16.2.8.3. Profitability by Market Segments (Product/Route of Administration/Region)
16.2.8.4. Sales Footprint
16.2.8.5. Strategy Overview
16.2.8.5.1. Marketing Strategy
16.2.8.5.2. Product Strategy
16.2.8.5.3. Route of Administration Strategy
16.2.9. VetStem Biopharma
16.2.9.1. Overview
16.2.9.2. Product Portfolio
16.2.9.3. Profitability by Market Segments (Product/Route of Administration/Region)
16.2.9.4. Sales Footprint
16.2.9.5. Strategy Overview
16.2.9.5.1. Marketing Strategy
16.2.9.5.2. Product Strategy
16.2.9.5.3. Route of Administration Strategy
16.2.10. Dechra Pharmaceuticals PLC
16.2.10.1. Overview
16.2.10.2. Product Portfolio
16.2.10.3. Profitability by Market Segments (Product/Route of Administration/Region)
16.2.10.4. Sales Footprint
16.2.10.5. Strategy Overview
16.2.10.5.1. Marketing Strategy
16.2.10.5.2. Product Strategy
16.2.10.5.3. Route of Administration Strategy
17. Assumptions and Acronyms Used
18. Research Methodology
Let us know your requirement to get
100% FREE customization
List of Tables
Table 01: Market Value (US$ Mn) Growth Comparison
Table 02: Global Market Value (US$ Mn) Analysis and Opportunity Assessment 2013–2028, By Treatment Type
Table 03: Global Market Value (US$ Mn) Analysis and Opportunity Assessment 2013–2028, By Route of Administration
Table 04: Global Market Value (US$ Mn) Analysis- and Opportunity Assessment 2013–2028, By Distribution Channel
Table 05: Global Market Value (US$ Mn) Analysis and Opportunity Assessment 2013–2028, By Country
Table 06: North America Market Value (US$ Mn) Analysis 2013-2021 and Forecast 2022–2028, By Treatment Type
Table 07: North America Market Value (US$ Mn) Analysis and Opportunity Assessment 2013–2028, By Route of Administration
Table 08: North America Market Value (US$ Mn) Analysis 2013-2021 and Forecast 2022–2028, By Distribution Channel
Table 09: North America Market Value (US$ Mn) Analysis 2013-2021 and Forecast 2022–2028, By Country
Table 10: Latin America Market Value (US$ Mn) Analysis 2013-2021 and Forecast 2022–2028, By Treatment Type
Table 11: Latin America Market Value (US$ Mn) Analysis and Opportunity Assessment 2013–2028, By Route of Administration
Table 12: Latin America Market Value (US$ Mn) Analysis 2013-2021 and Forecast 2022–2028, By Distribution Channel
Table 13: Latin America Market Value (US$ Mn) Analysis 2013-2021 and Forecast 2022–2028, By Country
Table 14: Europe Market Value (US$ Mn) Analysis 2013-2021 and Forecast 2022–2028, By Treatment Type
Table 15: Europe Market Value (US$ Mn) Analysis and Opportunity Assessment 2013–2028, By Route of Administration
Table 16: Europe Market Value (US$ Mn) Analysis 2013-2021 and Forecast 2022–2028, By Distribution Channel
Table 17: Europe Market Value (US$ Mn) Analysis 2013-2021 and Forecast 2022–2028, By Country
Table 18: APEJ Market Value (US$ Mn) Analysis 2013-2021 and Forecast 2022–2028, By Treatment Type
Table 19: APEJ Market Value (US$ Mn) Analysis and Opportunity Assessment 2013–2028, By Route of Administration
Table 20: APEJ Market Value (US$ Mn) Analysis 2013-2021 and Forecast 2022–2028, By Distribution Channel
Table 21: APEJ Market Value (US$ Mn) Analysis 2013-2021 and Forecast 2022–2028, By Country
Table 22: Japan Market Value (US$ Mn) Analysis 2013-2021 and Forecast 2022–2028, By Treatment Type
Table 23: Japan Market Value (US$ Mn) Analysis and Opportunity Assessment 2013–2028, By Route of Administration
Table 24: Japan Market Value (US$ Mn) Analysis 2013-2021 and Forecast 2022–2028, By Distribution Channel
Table 25: MEA Market Value (US$ Mn) Analysis 2013-2021 and Forecast 2022–2028, By Treatment Type
Table 26: MEA Market Value (US$ Mn) Analysis and Opportunity Assessment 2013–2028, By Route of Administration
Table 27: MEA Market Value (US$ Mn) Analysis 2013-2021 and Forecast 2022–2028, By Distribution Channel
Table 28: Middle East & Africa Market Value (US$ Mn) Analysis 2013-2021 and Forecast 2022–2028, By Country
Find your sweet spots for generating winning opportunities in this market.
Talk to AnalystList of Charts
Figure 01: U.S. Estimated Breakdown of Pet Industry Expenditure (US$ Bn), By Service 2021
Figure 02: Total U.S. Pet Industry Expenditure (US$), 2021
Figure 03: Global Healthcare Expenditure in US$ Tn (2013–2021)
Figure 04: Global Market Value Analysis (US$ Mn), 2013-2021
Figure 05: Global Market Value Forecast (US$ Mn), 2022-2028
Figure 06: Global Market Absolute $ Opportunity, 2022 - 2028
Figure 07: Comparison July 2021 and October 2022, Y-o-Y Forecast
Figure 08: Global Market Share Analysis (%), By Treatment Type, 2022 & 2028
Figure 09: Global Market Y-o-Y Analysis (%), By Treatment Type, 2022-2028
Figure 10: Global Market Attractiveness Analysis by Treatment Type, 2022-2028
Figure 11: Global Market Share Analysis (%), By Route of Administration, 2022 & 2028
Figure 12: Global Market Y-o-Y Analysis (%), By Route of Administration, 2022-2028
Figure 13: Global Market Attractiveness Analysis by Route of Administration, 2022-2028
Figure 14: Global Market Share Analysis (%), By Distribution Channel, 2022 & 2028
Figure 15: Global Market Y-o-Y Analysis (%), By Distribution Channel, 2022-2028
Figure 16: Global Market Attractiveness Analysis by Distribution Channel, 2022-2028
Figure 17: Global Market Share Analysis (%), By Country, 2022 & 2028
Figure 18: Global Market Y-o-Y Analysis (%), By Country, 2022-2028
Figure 19: Global Market Attractiveness Analysis by Country, 2022-2028
Figure 20: North America Market Value Share By Treatment Type (2022)
Figure 21: North America Market Value Share By Route of Administration (2022)
Figure 22: North America Market Value Share By Country (2022)
Figure 23: North America Market Value Share By Distribution Channel (2022)
Figure 24: North America Market Value Analysis (US$ Mn), 2013-2021
Figure 25: North America Market Value Forecast (US$ Mn), 2022-2028
Figure 26: North America Market Attractiveness Analysis by Treatment Type, 2022-2028
Figure 27: North America Market Attractiveness Analysis by Route of Administration, 2022-2028
Figure 28: North America Market Attractiveness Analysis by Distribution Channel, 2022-2028
Figure 29: North America Market Attractiveness Analysis by Country, 2022-2028
Figure 30: Latin America Market Value Share By Treatment Type (2022)
Figure 31: Latin America Market Value Share By Route of Administration (2022)
Figure 32: Latin America Market Value Share By Country (2022)
Figure 33: Latin America Market Value Share By Distribution Channel (2022)
Figure 34: Latin America Market Value Analysis (US$ Mn), 2013-2021
Figure 35: Latin America Market Value Forecast (US$ Mn), 2022-2028
Figure 36: Latin America Market Attractiveness Analysis by Treatment Type, 2022-2028
Figure 37: Latin America Market Attractiveness Analysis by Route of Administration, 2022-2028
Figure 38: Latin America Market Attractiveness Analysis by Distribution Channel, 2022-2028
Figure 39: Latin America Market Attractiveness Analysis by Country, 2022-2028
Figure 40: Europe Market Value Share By Treatment Type (2022)
Figure 41: Europe Market Value Share By Route of Administration (2022)
Figure 42: Europe Market Value Share By Country (2022)
Figure 43: Europe Market Value Share By Distribution Channel (2022)
Figure 44: Europe Market Value Analysis (US$ Mn), 2013-2021
Figure 45: Europe Market Value Forecast (US$ Mn), 2022-2028
Figure 46: Europe Market Attractiveness Analysis by Treatment Type, 2022-2028
Figure 47: Europe Market Attractiveness Analysis by Route of Administration, 2022-2028
Figure 48: Europe Market Attractiveness Analysis by Distribution Channel, 2022-2028
Figure 49: Europe Market Attractiveness Analysis by Country, 2022-2028
Figure 50: APEJ Market Value Share By Treatment Type (2022)
Figure 51: APEJ Market Value Share By Route of Administration (2022)
Figure 52: APEJ Market Value Share By Country (2022)
Figure 53: APEJ Market Value Share By Distribution Channel (2022)
Figure 54: APEJ Market Value Analysis (US$ Mn), 2013-2021
Figure 55: APEJ Market Value Forecast (US$ Mn), 2022-2028
Figure 56: APEJ Market Attractiveness Analysis by Treatment Type, 2022-2028
Figure 57: APEJ Market Attractiveness Analysis by Route of Administration, 2022-2028
Figure 58: APEJ Market Attractiveness Analysis by Distribution Channel, 2022-2028
Figure 59: APEJ Market Attractiveness Analysis by Country, 2022-2028
Figure 60: Japan Market Value Share By Treatment Type (2022)
Figure 61: Japan Market Value Share By Route of Administration (2022)
Figure 62: Japan Market Value (US$ Mn) & Forecast 2022 & 2028
Figure 63: Japan Market Value Share By Distribution Channel (2022)
Figure 64: Japan Market Value Analysis (US$ Mn), 2013-2021
Figure 65: Japan Market Value Forecast (US$ Mn), 2022-2028
Figure 66: Japan Market Attractiveness Analysis by Treatment Type, 2022-2028
Figure 67: Japan Market Attractiveness Analysis by Route of Administration, 2022-2028
Figure 68: Japan Market Attractiveness Analysis by Distribution Channel, 2022-2028
Figure 69: Middle East & Africa Market Value Share By Treatment Type (2022)
Figure 70: Middle East & Africa Market Value Share By Route of Administration (2022)
Figure 71: Middle East & Africa Market Value Share By Country (2022)
Figure 72: Middle East & Africa Market Value Share By Distribution Channel (2022)
Figure 73: Middle East & Africa Market Value Analysis (US$ Mn), 2013-2021
Figure 74: Middle East & Africa Market Value Forecast (US$ Mn), 2022-2028
Figure 75: Middle East & Africa Market Attractiveness Analysis by Treatment Type, 2022-2028
Figure 76: Middle East & Africa Market Attractiveness Analysis by Route of Administration, 2022-2028
Figure 77: Middle East & Africa Market Attractiveness Analysis by Distribution Channel, 2022-2028
Figure 78: Middle East & Africa Market Attractiveness Analysis by Country, 2022-2028
Need specific information?
Request CustomizationExplore Healthcare Insights
View Reports