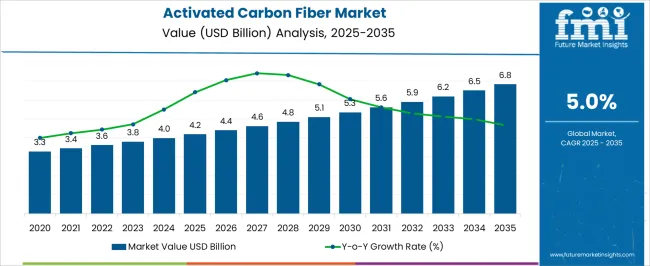
The Activated Carbon Fiber Market is estimated to be valued at USD 4.2 billion in 2025 and is projected to reach USD 6.8 billion by 2035, registering a compound annual growth rate (CAGR) of 5.0% over the forecast period.
| Metric | Value |
|---|---|
| Activated Carbon Fiber Market Estimated Value in (2025 E) | USD 4.2 billion |
| Activated Carbon Fiber Market Forecast Value in (2035 F) | USD 6.8 billion |
| Forecast CAGR (2025 to 2035) | 5.0% |
The activated carbon fiber market is witnessing steady growth due to increasing environmental concerns, rising demand for advanced filtration systems, and growing applications in industrial air and water purification. Its unique properties, including high surface area, rapid adsorption kinetics, and regeneration capability, have positioned activated carbon fiber as a superior alternative to traditional adsorbents.
Market expansion is supported by stricter emission regulations and heightened awareness regarding safe drinking water and clean air standards. Industrial sectors are adopting activated carbon fibers for gas purification, solvent recovery, and chemical processing due to operational efficiency and durability.
Additionally, the development of advanced fiber forms compatible with next-generation filtration technologies has enhanced market adoption. With continued investments in pollution control infrastructure and rising demand across urbanized regions, the activated carbon fiber market is expected to maintain robust momentum and deliver long-term growth prospects.
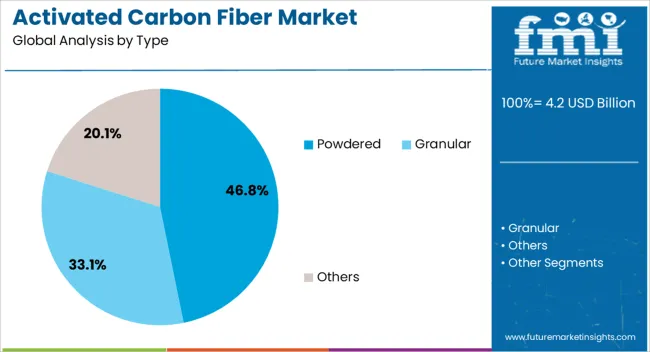
The powdered segment dominates the type category with approximately 46.80% share, supported by its widespread application in gas and liquid phase adsorption processes. Powdered activated carbon fiber provides greater surface contact with impurities, allowing for rapid and efficient filtration outcomes.
Industries favor this type for air purification and wastewater treatment projects where immediate results and cost-effective deployment are critical. Its versatility in blending with other filtration media further enhances performance across diverse industrial settings.
Growth in this segment is reinforced by its compatibility with large-scale treatment systems and ease of integration in modular purification units. With stricter environmental mandates and rising adoption in municipal and industrial water treatment, the powdered segment is expected to sustain its leadership during the forecast period.
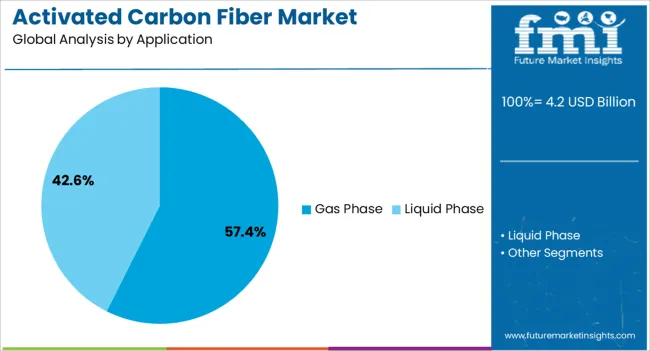
The gas phase segment leads the application category with approximately 57.40% share, driven by the increasing demand for air quality management in industrial and urban environments. Activated carbon fibers are widely utilized for the removal of volatile organic compounds, harmful gases, and odors across chemical plants, manufacturing units, and residential air purification systems.
Their high adsorption efficiency and rapid kinetics provide advantages over traditional carbon granules in dynamic air treatment processes. Regulatory emphasis on reducing industrial emissions and workplace hazards has further strengthened adoption.
With continuous innovation in air purification technologies and heightened demand for sustainable solutions, the gas phase segment is projected to remain dominant in the market landscape.
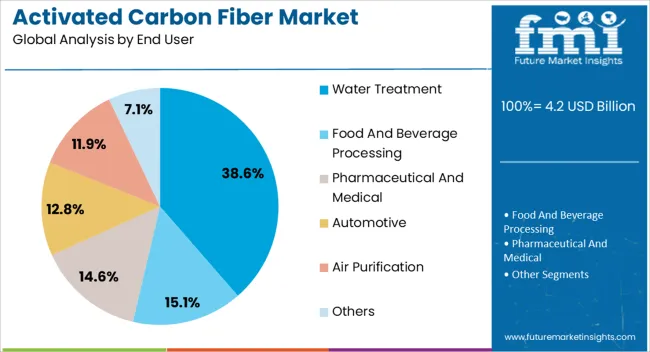
The water treatment segment holds approximately 38.60% share within the end-user category, reflecting its critical role in ensuring safe and clean water supplies. Activated carbon fibers are increasingly applied in municipal water treatment, industrial effluent purification, and residential filtration systems due to their high adsorption capacity and reusability.
Their effectiveness in removing chlorine, organic pollutants, and micropollutants aligns with rising global concerns over water safety and scarcity. Government initiatives supporting water infrastructure upgrades and stricter potable water standards have driven consistent demand.
With growing pressure to ensure sustainable water resources across both developed and developing economies, the water treatment segment is anticipated to retain a strong position in the forecast period.
The global activated carbon fiber market expanded at a 5% CAGR between 2020 and 2025. The market is anticipated to develop at a CAGR of 2.9% over the forecast period from 2025 to 2035.
| Attributes | Details |
|---|---|
| Market Value in 2020 | USD 3.3 million |
| Market Value in 2025 | USD 4.2 million |
| CAGR from 2020 to 2025 | 5% |
From 2020 to 2025, the market demonstrated a gradual ascent. Commencing at USD 3.3 million in 2020, it reached a valuation of USD 4.2 million by 2025, registering a CAGR of 5%. This growth can be attributed to heightened industry demand, driven by the material's efficient adsorption properties. Water purification and air filtration applications played pivotal roles in this upward trajectory.
Looking forward, market projections for 2025 to 2035 are optimistic. Anticipated advancements in manufacturing technologies and a growing emphasis on sustainable solutions are expected to drive expansion. Key sectors such as automotive and healthcare are poised to contribute significantly to the market's expansion.
As global industries increasingly prioritize pollution control and resource optimization, the market is forecasted to grow, reaching new milestones in the coming decade.
The table below highlights CAGRs from the five countries spearheaded by the United States, United Kingdom, China, Japan, and South Korea.
South Korea stands out as a dynamic and rapidly advancing market, poised to experience substantial growth in CAGR by 2035.
With a CAGR of 4.6%, South Korea reflects a thriving landscape in embracing and contributing to the evolution of various industries.
| Countries | CAGR by 2035 |
|---|---|
| The United States | 3.2% |
| The United Kingdom | 4% |
| China | 3.7% |
| Japan | 4.4% |
| South Korea | 4.6% |
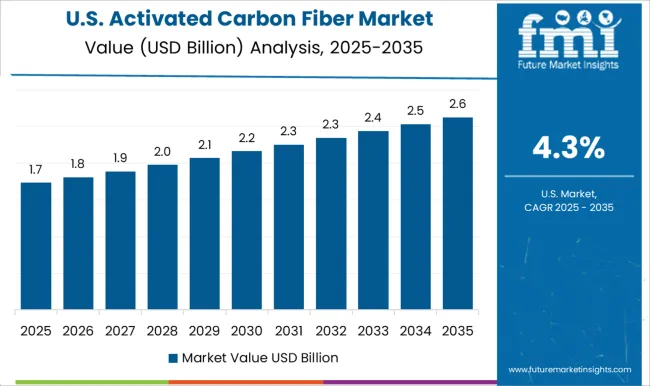
In the United States, a CAGR of 3.2% is anticipated by 2035. The market outlook reflects a steady and sustainable trajectory driven by technological advancements, consumer demand, and economic stability.
Industries across various sectors are expected to contribute to this growth, making the United States a resilient market with incremental expansion.
The United Kingdom exhibits a promising CAGR of 4% by 2035, suggesting robust economic conditions and favorable market dynamics. Innovation, investments, and consumer preferences likely influence this growth.
The higher CAGR indicates a faster-paced market expansion, possibly propelled by technological advancements and proactive business strategies.
China, with a CAGR of 3.7% by 2035, showcases a steady growth trajectory. This reflects the resilience of the China market, driven by factors such as a large consumer base, industrial development, and technological progress.
The moderate yet consistent CAGR suggests a balanced and sustainable expansion of various sectors contributing to the overall economic growth.
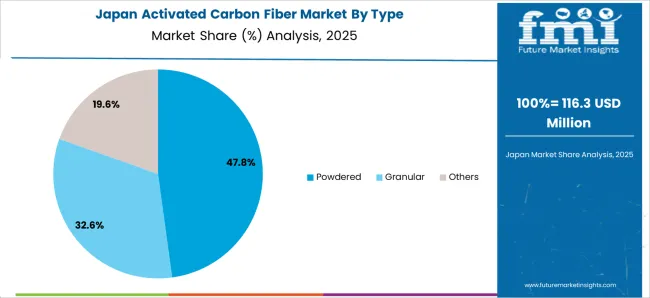
Japan anticipates a CAGR of 4.4% by 2035, indicating a robust and accelerated pace of market expansion. This growth may be attributed to technological innovation, industrial diversification, and strong consumer confidence. Japan's market dynamics appear well-positioned for significant advancements across multiple sectors.
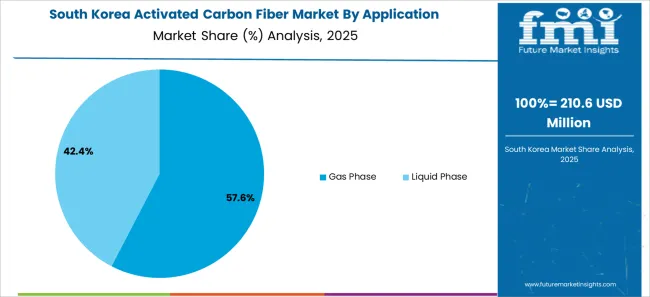
South Korea stands out with a CAGR of 4.6% by 2035, signalling a rapid and substantial market growth trajectory. Technological leadership, export-oriented industries, and a dynamic business environment will likely drive this exceptional growth rate.
The market outlook of suggests a thriving landscape with opportunities for diverse sectors to flourish in the coming years.
The table below highlights powdered-type activated carbon fibers, which are projected to lead the component type of the market, expanding at a CAGR of 2.7% by 2035. The table further detailed liquid-phase activated carbon fibers, expected to a 2.5% CAGR by 2035.
Powdered-type activated carbon fibers lead the market due to their versatility, finding applications across diverse industries. Their adaptability and effectiveness in various settings contribute to their prominent role in the market.
Liquid-phase activated carbon fibers excel in the liquid-phase application, driven by their effectiveness in meeting specific industrial needs. Their unique properties make them a preferred choice for applications requiring liquid-phase activation.
| Category | CAGR by 2035 |
|---|---|
| Powdered | 2.7% |
| Liquid Phase | 2.5% |
Powdered-type activated carbon fibers are anticipated to spearhead market growth, projecting a 2.7% CAGR by 2035.
This dominance underscores the robust demand for powdered variants, likely attributed to their versatile applications across various industries. Powdered forms are known for their efficacy in diverse settings, contributing to their sustained growth outlook.
Liquid-phase activated carbon fibers exhibit a slightly lower but significant 2.5% CAGR by 2035. This suggests a steady expansion in the demand for liquid-phase variants driven by specific applications and industry requirements.
The detailed exploration of these categories highlights the nuanced dynamics within the market, emphasizing the importance of both powdered and liquid-phase components in catering to diverse industrial needs.
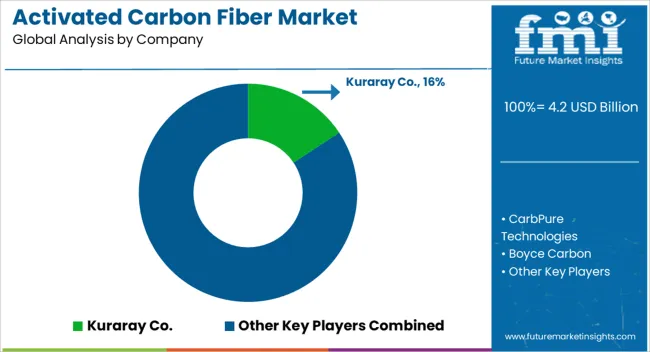
The competitive landscape of the activated carbon fiber market is characterized by a dynamic interplay among key industry players, each vying for market share and innovation. Companies within this sector are strategically positioned to capitalize on the growing trend towards circular economy principles, emphasizing sustainable practices.
Differentiated product offerings, technological advancements, and strategic collaborations are pivotal in shaping the competitive dynamics. As the market expands its applications, particularly in energy storage solutions, companies actively seek to enhance their product portfolios to cater to evolving consumer needs.
The competition is further fueled by a continual focus on research and development, aiming to stay ahead in the race for market leadership within the activated carbon fiber industry.
Some of the recent developments are
| Attributes | Details |
|---|---|
| Estimated Market Size in 2025 | USD 3.9 billion |
| Projected Market Valuation in 2035 | USD 5.3 billion |
| CAGR Share from 2025 to 2035 | 2.9% |
| Forecast Period | 2025 to 2035 |
| Historical Data Available for | 2020 to 2025 |
| Market Analysis | Value in USD billion |
| Key Regions Covered | North America; Latin America; Europe; East Asia; South Asia; Oceania; The Middle East and Africa |
| Key Market Segments Covered | By Type, By Application, By End-use |
| Key Countries Profiled | The United States, Canada, Brazil, Mexico, Argentina, Rest of Latin America, Germany, Italy, France, The United Kingdom, Spain, Russia, BENELUX, Rest of Europe, China, Japan, South Korea, India, Thailand, Malaysia, Indonesia, Rest of South Asia, Australia, New Zealand, GCC, Rest of Middle East and Africa |
| Key Companies Profiled | CarbPure Technologies; Boyce Carbon; Cabot Corporation; Kuraray Co.; CarboTech AC GmbH; Donau Chemie AG; Haycarb (Pvt) Ltd.; Jacobi Carbons Group; Kureha Corporation; Osaka Gas Chemicals Co., Ltd. |
The global activated carbon fiber market is estimated to be valued at USD 4.2 billion in 2025.
The market size for the activated carbon fiber market is projected to reach USD 6.8 billion by 2035.
The activated carbon fiber market is expected to grow at a 5.0% CAGR between 2025 and 2035.
The key product types in activated carbon fiber market are powdered, granular and others.
In terms of application, gas phase segment to command 57.4% share in the activated carbon fiber market in 2025.


Our Research Products

The "Full Research Suite" delivers actionable market intel, deep dives on markets or technologies, so clients act faster, cut risk, and unlock growth.

The Leaderboard benchmarks and ranks top vendors, classifying them as Established Leaders, Leading Challengers, or Disruptors & Challengers.

Locates where complements amplify value and substitutes erode it, forecasting net impact by horizon

We deliver granular, decision-grade intel: market sizing, 5-year forecasts, pricing, adoption, usage, revenue, and operational KPIs—plus competitor tracking, regulation, and value chains—across 60 countries broadly.

Spot the shifts before they hit your P&L. We track inflection points, adoption curves, pricing moves, and ecosystem plays to show where demand is heading, why it is changing, and what to do next across high-growth markets and disruptive tech

Real-time reads of user behavior. We track shifting priorities, perceptions of today’s and next-gen services, and provider experience, then pace how fast tech moves from trial to adoption, blending buyer, consumer, and channel inputs with social signals (#WhySwitch, #UX).

Partner with our analyst team to build a custom report designed around your business priorities. From analysing market trends to assessing competitors or crafting bespoke datasets, we tailor insights to your needs.
Supplier Intelligence
Discovery & Profiling
Capacity & Footprint
Performance & Risk
Compliance & Governance
Commercial Readiness
Who Supplies Whom
Scorecards & Shortlists
Playbooks & Docs
Category Intelligence
Definition & Scope
Demand & Use Cases
Cost Drivers
Market Structure
Supply Chain Map
Trade & Policy
Operating Norms
Deliverables
Buyer Intelligence
Account Basics
Spend & Scope
Procurement Model
Vendor Requirements
Terms & Policies
Entry Strategy
Pain Points & Triggers
Outputs
Pricing Analysis
Benchmarks
Trends
Should-Cost
Indexation
Landed Cost
Commercial Terms
Deliverables
Brand Analysis
Positioning & Value Prop
Share & Presence
Customer Evidence
Go-to-Market
Digital & Reputation
Compliance & Trust
KPIs & Gaps
Outputs
Full Research Suite comprises of:
Market outlook & trends analysis
Interviews & case studies
Strategic recommendations
Vendor profiles & capabilities analysis
5-year forecasts
8 regions and 60+ country-level data splits
Market segment data splits
12 months of continuous data updates
DELIVERED AS:
PDF EXCEL ONLINE
Carbon Fiber Bike Wheelset Market Size and Share Forecast Outlook 2025 to 2035
Carbon Fiber Construction Repair Market Size and Share Forecast Outlook 2025 to 2035
Carbon Fiber Reinforced Plastic Market Size and Share Forecast Outlook 2025 to 2035
Carbon Fiber Wraps Market Size and Share Forecast Outlook 2025 to 2035
Carbon Fiber Boat Hulls Market Size and Share Forecast Outlook 2025 to 2035
Carbon Fiber Composites Market Size, Growth, and Forecast 2025 to 2035
Carbon Fiber Composites for Prosthetics Market 2025-2035
Activated Carbon for Sugar Decolorization Market Forecast and Outlook 2025 to 2035
Activated Carbon Bags Market Size and Share Forecast Outlook 2025 to 2035
Activated Carbon Filter Market Growth - Trends & Forecast 2025 to 2035
Assessing Activated Carbon Market Share & Industry Trends
Wood Activated Carbon Market Size and Share Forecast Outlook 2025 to 2035
Recycled Carbon Fiber Market Size and Share Forecast Outlook 2025 to 2035
Medical Activated Carbon Dressing Market Size and Share Forecast Outlook 2025 to 2035
Demand for Carbon Fiber Composites for Prosthetics in USA Size and Share Forecast Outlook 2025 to 2035
Demand for Carbon Fiber Composites for Prosthetics in Japan Size and Share Forecast Outlook 2025 to 2035
Pelletized Activated Carbon Market Analysis - Size & Industry Trends 2025 to 2035
Food Grade Activated Carbon Market Report - Applications & Growth 2025 to 2035
High Performance Carbon Fiber Precursor Market Size and Share Forecast Outlook 2025 to 2035
Semiconductor Grade Carbon Fiber Rigid Felts Market Analysis - Size, Share, and Forecast Outlook 2025 to 2035

Thank you!
You will receive an email from our Business Development Manager. Please be sure to check your SPAM/JUNK folder too.
Chat With
MaRIA