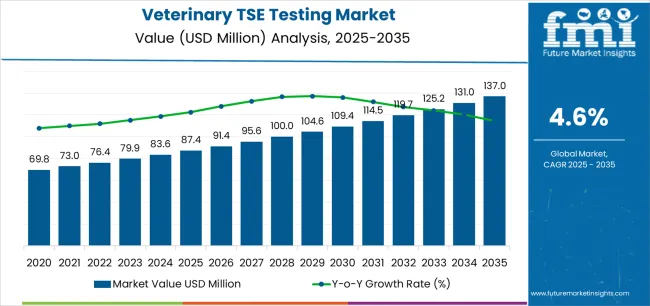
The veterinary TSE testing market enters a decade of steady expansion that will reshape disease surveillance and diagnostic capabilities across livestock monitoring, regulatory compliance, and animal health applications. The market's progression from USD 87.4 million in 2025 to USD 137.1 million by 2035 represents measured growth, reflecting the continued adoption of rapid testing methodologies and surveillance systems across BSE monitoring, scrapie detection, and chronic wasting disease applications worldwide.
The first half of the decade (2025-2030) will witness the market climbing from USD 87.4 million to approximately USD 109.5 million, adding USD 22.0 million in value, which constitutes 44% of the total forecast growth period. This phase will be characterized by the continued adoption of rapid ELISA testing and enhanced surveillance programs, driven by increasing regulatory requirements and the growing need for efficient diagnostic solutions in cattle monitoring, sheep screening, and cervid testing applications globally. Enhanced automation capabilities and standardized testing protocols will become standard expectations rather than premium options.
The latter half (2030-2035) will witness continued growth from USD 109.5 million to USD 137.1 million, representing an addition of USD 27.6 million or 56% of the decade's expansion. This period will be defined by mass market penetration of advanced diagnostic platforms, integration with comprehensive surveillance networks, and seamless compatibility with existing veterinary laboratory infrastructure. The market trajectory signals fundamental shifts in how veterinary professionals approach TSE surveillance and diagnostic operations, with participants positioned to benefit from growing demand across multiple testing segments and end-user channels.
Veterinary TSE testing encompasses sophisticated diagnostic management systems coordinating rapid screening methods, confirmatory testing protocols, and surveillance data collection across diverse animal populations and regulatory applications. Rapid ELISA testing systems provide automated immunoassay detection through standardized test protocols enabling high-throughput sample processing for routine surveillance programs. Testing capabilities typically support detection thresholds meeting regulatory specifications while maintaining analytical sensitivity requirements for effective disease monitoring and herd health assessment.
BSE testing applications drive primary market demand through requirements for cattle surveillance programs, fallen stock monitoring, and slaughterhouse screening protocols mandated by regulatory authorities for food safety assurance. Scrapie detection operations utilize targeted testing strategies for sheep and goat populations through both active surveillance systems and clinical suspect investigation protocols. Chronic wasting disease monitoring encompasses cervid population screening, wildlife surveillance programs, and captive deer testing requirements across affected geographical regions.
Western blot confirmatory testing provides definitive diagnostic validation through protein detection methodologies ensuring accurate test result interpretation and regulatory compliance standards. Immunohistochemistry applications offer tissue-based diagnostic capabilities supporting pathological examination and research applications requiring cellular-level detection precision.
| Period | Primary Revenue Buckets | Share | Notes |
|---|---|---|---|
| Today | Rapid ELISA testing | 58.4% | Volume-driven, surveillance focus |
| Western blot confirmation | 21.3% | Regulatory validation and accuracy | |
| Immunohistochemistry applications | 16.3% | Research and pathology | |
| BSE cattle testing | 46.4% | Primary disease monitoring | |
| Scrapie sheep/goat testing | 21.2% | Secondary surveillance | |
| Future (3-5 yrs) | Enhanced ELISA platforms | 60.0% | Automation advancement, efficiency gains |
| Expanded confirmatory systems | 22.9% | Regulatory enhancement, accuracy improvement | |
| Advanced IHC solutions | 16.2% | Technology consolidation, research expansion | |
| Comprehensive BSE monitoring | 46.6% | Surveillance optimization, protocol enhancement | |
| Enhanced scrapie programs | 21.5% | Program expansion, detection improvement | |
| Digital surveillance platforms | 3-5% | IoT integration, data optimization |
At-a-Glance Metrics
| Metric | Value |
|---|---|
| Market Value (2025) | USD 87.4 million |
| Market Forecast (2035) | USD 137.1 million |
| Growth Rate | 4.6% |
| Leading Test Modality | Rapid ELISA Segment |
| Primary TSE Type | BSE (cattle) |
The market demonstrates strong fundamentals with rapid ELISA testing capturing a dominant share through proven diagnostic capabilities and testing optimization. BSE surveillance applications drive primary demand, supported by increasing regulatory requirements and operational testing development. Geographic expansion remains concentrated in developed markets with established surveillance infrastructure, while emerging economies show accelerating adoption rates driven by regulatory modernization initiatives and rising food safety standards.
Design for surveillance versatility, not just test accuracy
Technology readiness for Surveillance 4.0
Compliance-by-design approach
Value-based testing models
Primary Classification: The market segments by test modality into rapid ELISA (58.4%), western blot (21.3%), immunohistochemistry (16.3%), and others (3.9%), representing the evolution from basic screening methods to specialized diagnostic platforms for comprehensive TSE detection and regulatory compliance.
Secondary Classification: TSE type segmentation divides the market into BSE cattle (46.4%), scrapie sheep/goats (21.2%), and CWD cervids (32.4%), reflecting distinct requirements for species-specific surveillance, regulatory compliance, and monitoring program standards.
Tertiary Classification: End user segmentation covers veterinary hospitals & clinics (44.4%), government/public veterinary labs & reference networks (17.3%), diagnostics labs (27.5%), and others (10.8%), demonstrating varied testing requirements and operational distribution standards.
The segmentation structure reveals diagnostic progression from standard screening methods toward specialized TSE testing applications with enhanced surveillance consistency and regulatory capabilities, while application diversity spans from routine monitoring to confirmatory testing requiring precise diagnostic solutions.
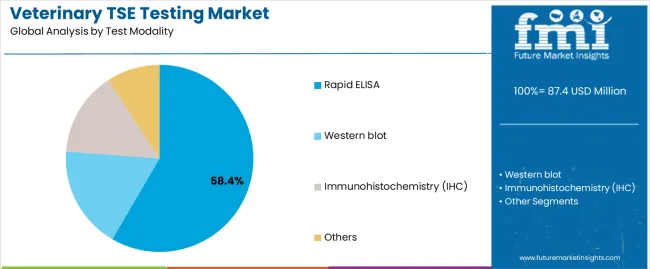
Market Position: Rapid ELISA testing commands the leading position in the veterinary TSE testing market with 58.4% market share through advanced diagnostic features, including high-throughput capabilities, operational efficiency, and testing optimization that enable laboratories to achieve optimal screening across diverse animal populations and surveillance applications.
Value Drivers: The segment benefits from laboratory preference for automated testing systems that provide consistent diagnostic performance, reduced processing complexity, and operational efficiency optimization without requiring significant equipment modifications. Advanced assay features enable automated sample handling, standardized protocols, and integration with existing laboratory systems, where diagnostic performance and regulatory compliance represent critical testing requirements.
Competitive Advantages: Rapid ELISA testing differentiates through proven diagnostic reliability, consistent screening characteristics, and integration with automated laboratory management systems that enhance testing effectiveness while maintaining optimal accuracy standards for diverse surveillance and regulatory applications.
Key market characteristics:
Western Blot Confirmatory Testing Shows Validation Market Growth
Western blot testing maintains a 21.3% market position in the veterinary TSE testing market due to their enhanced confirmatory properties and regulatory validation characteristics. These systems appeal to laboratories requiring specialized performance with premium positioning for confirmatory testing and regulatory compliance applications. Market growth is driven by regulatory validation segment expansion, emphasizing definitive diagnostic solutions and operational efficiency through optimized confirmatory designs.
Immunohistochemistry Applications Show Research Growth
Immunohistochemistry testing captures 16.3% market share through specialized diagnostic requirements in pathology applications, research operations, and tissue-based testing. These operations demand certified diagnostic systems capable of operating with histological workflow while providing effective tissue analysis and research performance capabilities.
Others Testing Methods Show Emerging Applications
Other testing methods account for 3.9% market share, including specialized protocols, experimental techniques, and alternative testing requirements for diagnostic optimization and research accessibility.
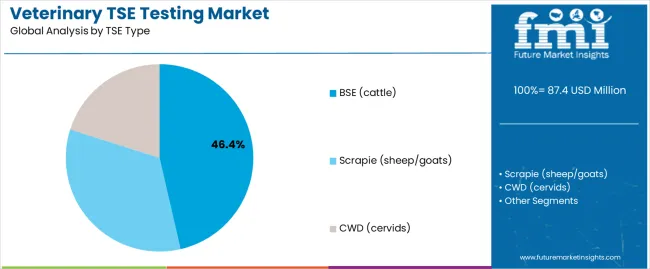
Market Context: BSE cattle testing demonstrates market leadership in the veterinary TSE testing market with 46.4% share due to widespread adoption of mandatory surveillance systems and increasing focus on food safety, regulatory compliance, and testing applications that maximize public health protection while maintaining livestock industry standards.
Appeal Factors: Regulatory authorities prioritize surveillance consistency, food safety assurance, and integration with existing livestock monitoring infrastructure that enables coordinated testing operations across multiple surveillance applications. The segment benefits from substantial regulatory investment and surveillance programs that emphasize the acquisition of BSE testing systems for monitoring optimization and food safety applications.
Growth Drivers: Livestock surveillance expansion programs incorporate BSE testing as standard screening for regulatory operations, while food safety growth increases demand for consistent testing capabilities that comply with regulatory standards and minimize public health risks.
Scrapie (sheep/goats) Testing Maintains Secondary Surveillance
Scrapie testing captures 21.2% market share through comprehensive surveillance requirements in sheep and goat populations, breeding program monitoring, and flock health applications requiring reliable testing systems capable of handling small ruminant populations while providing effective surveillance management and regulatory performance capabilities.
CWD (cervids) Testing Shows Wildlife Growth
CWD testing accounts for 32.4% market share, including wildlife surveillance, captive deer monitoring, and cervid population testing requiring specialized surveillance solutions for wildlife management and population health optimization.
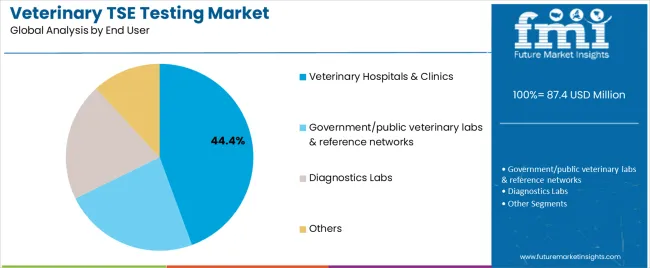
Market Context: Veterinary hospitals & clinics demonstrate market leadership in the veterinary TSE testing market with 44.4% share due to widespread adoption of clinical testing systems and increasing focus on diagnostic services, patient care, and testing applications that maximize animal health outcomes while maintaining clinical standards.
Appeal Factors: Veterinary professionals prioritize diagnostic reliability, clinical efficiency, and integration with existing practice infrastructure that enables coordinated testing operations across multiple clinical applications. The segment benefits from substantial clinical investment and modernization programs that emphasize the acquisition of testing systems for diagnostic optimization and patient care applications.
Growth Drivers: Veterinary practice expansion programs incorporate TSE testing as standard diagnostic for clinical operations, while animal health growth increases demand for consistent testing capabilities that comply with clinical standards and minimize diagnostic complexity.
Application dynamics include:
Government/Public Veterinary Labs & Reference Networks Maintain Regulatory Demand
Government laboratories capture 17.3% market share through comprehensive surveillance requirements in regulatory monitoring, reference testing, and national surveillance programs. These operations demand reliable testing systems capable of handling official surveillance while providing effective regulatory management and compliance performance capabilities.
Diagnostics Labs Show Commercial Growth
Diagnostic laboratories account for 27.5% market share, including commercial testing services, contract laboratories, and specialized testing requirements for diagnostic optimization and service accessibility.
Others End Users Show Specialized Applications
Other end users account for 10.8% market share, including research institutions, academic facilities, and specialized testing requirements for research optimization and educational applications.
| Category | Factor | Impact | Why It Matters |
|---|---|---|---|
| Driver | Regulatory surveillance requirements & food safety compliance (mandatory testing, government programs) | ★★★★★ | Large-scale regulatory markets require efficient, reliable testing solutions with consistent performance and compliance across surveillance applications. |
| Driver | Disease outbreak prevention & early detection (surveillance programs, monitoring systems) | ★★★★★ | Drives demand for rapid testing solutions and high-throughput screening capabilities; providers offering automated systems gain competitive advantage. |
| Driver | International trade facilitation & export certification (trade requirements, certification standards) | ★★★★☆ | Global trade markets need compliant testing solutions; demand for certified testing expanding addressable market segments. |
| Restraint | High testing costs & budget constraints (surveillance expense, laboratory funding) | ★★★★☆ | Small laboratories face cost pressure; increases price sensitivity and affects testing volume in budget-sensitive markets. |
| Restraint | Limited disease prevalence & testing demand (low incidence rates, reduced surveillance) | ★★★☆☆ | Cost-focused applications face challenges with testing volume and economic justification, limiting adoption in low-prevalence regions. |
| Trend | Automation advancement & laboratory efficiency (automated platforms, throughput optimization) | ★★★★★ | Growing demand for automated testing equipment; automation integration becomes core value proposition in modern laboratory segments. |
| Trend | Digital surveillance integration & data management (connected systems, reporting platforms) | ★★★★☆ | Technology integration drives demand for smart testing solutions; digital capabilities drive competition toward surveillance optimization. |
The veterinary TSE testing market demonstrates varied regional dynamics with growth leaders including India (4.3% growth rate) and China (3.8% growth rate) driving expansion through surveillance initiatives and regulatory capacity development. Steady Performers encompass USA (2.8% growth rate), France (2.8% growth rate), and UK (2.5% growth rate), benefiting from established surveillance industries and advanced testing adoption. Mature Markets feature Europe (2.4% growth rate), Brazil (2.4% growth rate), and Germany (2.3% growth rate), where regulatory technology advancement and surveillance standardization requirements support consistent growth patterns.
Regional synthesis reveals Asian markets leading adoption through surveillance expansion and regulatory development, while Western countries maintain steady expansion supported by technology advancement and surveillance standardization requirements. Emerging markets show strong growth driven by regulatory applications and surveillance modernization trends.
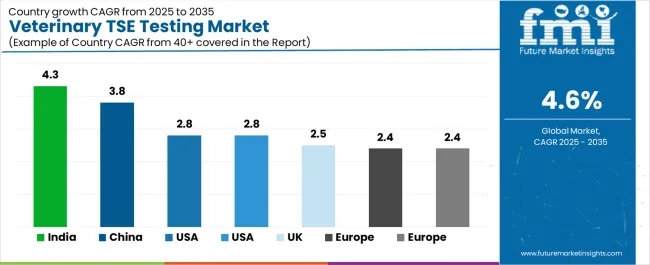
| Region/Country | 2025 to 2035 Growth | How to win | What to watch out |
|---|---|---|---|
| India | 4.3% | Focus on cost-effective surveillance solutions | Infrastructure challenges; regulatory complexity |
| China | 3.8% | Lead with high-volume testing systems | Regulatory approval; surveillance standards |
| USA | 2.8% | Provide regulatory-compliant applications | FDA oversight; compliance requirements |
| France | 2.8% | Offer integrated surveillance solutions | EU regulations; standardization requirements |
| UK | 2.5% | Premium surveillance positioning | Post-Brexit regulations; budget constraints |
| Europe | 2.4% | Comprehensive testing programs | Regulatory harmonization; cost pressures |
| Brazil | 2.4% | Premium surveillance positioning | Economic volatility; infrastructure limitations |
| Germany | 2.3% | Premium quality positioning | Over-specification; regulatory compliance |
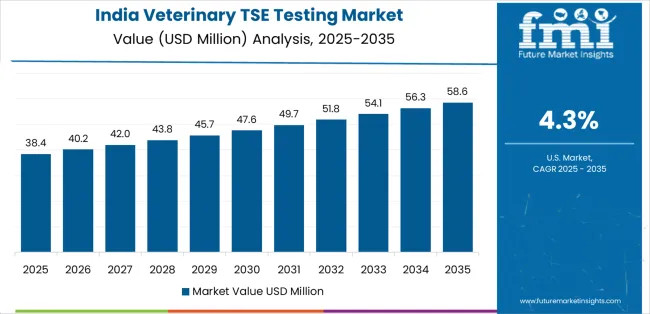
India establishes fastest market growth through aggressive surveillance programs and comprehensive regulatory capacity development, integrating advanced veterinary TSE testing as standard components in livestock monitoring systems and government surveillance installations. The country's 4.3% growth rate reflects government initiatives promoting agricultural modernization and food safety development capabilities that mandate the use of diagnostic testing systems in veterinary facilities. Growth concentrates in major agricultural centers, including Punjab, Maharashtra, and Uttar Pradesh, where surveillance technology development showcases integrated testing systems that appeal to authorities seeking advanced monitoring optimization capabilities and operational surveillance applications.
Indian regulatory authorities are developing cost-effective testing solutions that combine domestic surveillance advantages with proven diagnostic features, including automated processing systems and enhanced reliability capabilities. Distribution channels through government laboratories and veterinary service providers expand market access, while regulatory support for food safety development supports adoption across diverse surveillance segments.
Strategic Market Indicators:
In Guangdong, Jiangsu, and Zhejiang provinces, surveillance facilities and regulatory operations are implementing advanced veterinary TSE testing as standard equipment for monitoring optimization and operational surveillance enhancement, driven by increasing government food safety investment and regulatory modernization programs that emphasize the importance of testing capabilities. The market holds a 3.8% growth rate, supported by government surveillance initiatives and testing infrastructure development programs that promote advanced diagnostic systems for regulatory facilities.
Chinese operators are adopting testing systems that provide consistent surveillance performance and regulatory compliance features, particularly appealing in agricultural regions where monitoring efficiency and safety standards represent critical operational requirements. Market expansion benefits from growing surveillance processing capabilities and regulatory integration agreements that enable domestic production of advanced testing systems for surveillance applications.
USA establishes regulatory-compliant market development through comprehensive surveillance programs and established food safety infrastructure, integrating veterinary TSE testing across government facilities and regulatory applications. The country's 2.8% growth rate reflects mature surveillance industry relationships and established testing adoption that supports widespread use of diagnostic systems in regulatory facilities and compliance-oriented operations. Growth concentrates in major surveillance centers, including Colorado, Nebraska, and Wisconsin, where surveillance technology showcases mature testing deployment that appeals to regulators seeking proven compliance capabilities and operational efficiency applications.
American regulatory agencies leverage established distribution networks and comprehensive surveillance capabilities, including compliance programs and technical support that create agency relationships and operational advantages. The market benefits from mature surveillance standards and USDA requirements that support testing system use while supporting technology advancement and operational optimization.
France establishes integrated surveillance development through advanced regulatory programs and established surveillance infrastructure, integrating veterinary TSE testing across government facilities and surveillance applications. The country's 2.8% growth rate reflects growing surveillance industry relationships and established testing adoption that supports widespread use of diagnostic systems in regulatory facilities and surveillance-integrated operations. Growth concentrates in major agricultural centers, including Brittany, Normandy, and Pays de la Loire, where surveillance technology showcases mature testing deployment that appeals to regulators seeking proven integration capabilities and operational efficiency applications.
French regulatory systems leverage established surveillance networks and comprehensive support capabilities, including testing programs and technical support that create regulatory relationships and operational advantages. The market benefits from established surveillance standards and EU requirements that support testing system use while supporting technology advancement and operational optimization.
Advanced surveillance technology market in UK demonstrates sophisticated veterinary TSE testing integration with documented surveillance effectiveness in premium regulatory applications and modern facility installations through integration with existing surveillance systems and regulatory infrastructure. The country maintains a 2.5% growth rate, leveraging traditional surveillance expertise and precision systems integration in testing technology. Surveillance centers, including England, Scotland, and Wales, showcase premium installations where testing systems integrate with traditional surveillance platforms and modern facility management systems to optimize regulatory operations and maintain surveillance quality profiles.
British regulatory providers prioritize testing precision and surveillance consistency in diagnostic development, creating demand for premium systems with advanced features, including surveillance monitoring and automated testing systems. The market benefits from established surveillance infrastructure and commitment to regulatory standards that provide long-term operational benefits and compliance with traditional quality surveillance methods.
Europe establishes comprehensive testing development through established regulatory programs and advanced surveillance infrastructure, integrating veterinary TSE testing across government facilities and surveillance applications. The region's 2.4% growth rate reflects mature surveillance industry relationships and established testing adoption that supports widespread use of diagnostic systems in regulatory facilities and surveillance-compliant operations. Growth concentrates in major surveillance centers, including Germany, France, and Italy, where surveillance technology showcases mature testing deployment that appeals to regulators seeking proven surveillance capabilities and operational efficiency applications.
European regulatory agencies leverage established distribution networks and comprehensive surveillance capabilities, including compliance programs and technical support that create regulatory relationships and operational advantages. The market benefits from mature surveillance standards and EU requirements that support testing system use while supporting technology advancement and operational optimization.
Advancing surveillance technology market in Brazil demonstrates sophisticated veterinary TSE testing integration with documented surveillance effectiveness in premium regulatory applications and modern facility installations through integration with existing surveillance systems and agricultural infrastructure. The country maintains a 2.4% growth rate, leveraging traditional agricultural expertise and precision systems integration in testing technology. Surveillance centers, including São Paulo, Minas Gerais, and Rio Grande do Sul, showcase premium installations where testing systems integrate with traditional surveillance platforms and modern facility management systems to optimize agricultural operations and maintain surveillance quality profiles.
Brazilian regulatory providers prioritize testing precision and surveillance consistency in diagnostic development, creating demand for premium systems with advanced features, including surveillance monitoring and automated testing systems. The market benefits from established surveillance infrastructure and commitment to agricultural standards that provide long-term operational benefits and compliance with traditional quality surveillance methods.
Advanced surveillance technology market in Germany demonstrates sophisticated veterinary TSE testing integration with documented surveillance effectiveness in premium regulatory applications and modern facility installations through integration with existing surveillance systems and regulatory infrastructure. The country maintains a 2.3% growth rate, leveraging traditional quality expertise and precision systems integration in testing technology. Surveillance centers, including Bavaria, North Rhine-Westphalia, and Baden-Württemberg, showcase premium installations where testing systems integrate with traditional quality platforms and modern facility management systems to optimize regulatory operations and maintain surveillance quality profiles.
German regulatory providers prioritize testing precision and quality consistency in diagnostic development, creating demand for premium systems with advanced features, including quality monitoring and automated testing systems. The market benefits from established quality infrastructure and commitment to regulatory standards that provide long-term operational benefits and compliance with traditional quality surveillance methods.
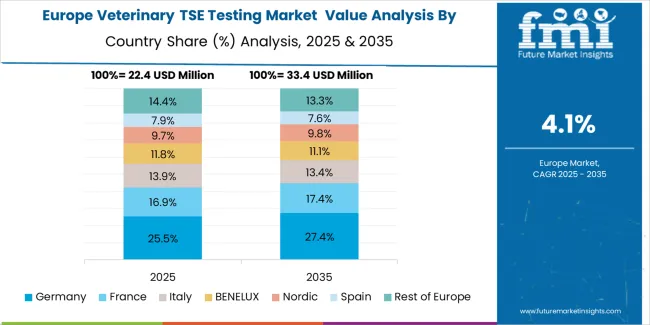
The European veterinary TSE testing market is projected to represent a significant portion of global consumption, with strong regional distribution across major economies. Germany is expected to maintain its leadership position with USD 6.4 million in 2025, accounting for 25.8% European market share, supported by its advanced surveillance infrastructure and major regulatory centers.
Spain follows with USD 3.2 million, representing 13.5% European market share in 2025, driven by comprehensive surveillance programs and testing technology development initiatives. United Kingdom holds USD 4.8 million through specialized surveillance applications and regulatory compliance requirements. France commands USD 2.5 million, while Italy accounts for USD 2.1 million in 2025. BENELUX maintains USD 1.5 million, Nordic Countries hold USD 2.2 million, and the rest of Western Europe region accounts for USD 1.5 million, attributed to increasing testing system adoption in emerging surveillance facilities implementing regulatory modernization programs.
| Stakeholder | What they actually control | Typical strengths | Typical blind spots |
|---|---|---|---|
| Global platforms | Distribution networks, broad testing portfolios, manufacturing facilities | Proven reliability, multi-region support, comprehensive service | Technology refresh cycles; customer lock-in dependency |
| Technology innovators | R&D capabilities; advanced testing systems; digital interfaces | Latest technology first; attractive ROI on specialized applications | Service density outside core regions; customization complexity |
| Regional specialists | Local sourcing, fast delivery, nearby technical support | "Close to site" support; pragmatic pricing; local regulations | Technology gaps; talent retention in diagnostic development |
| Application-focused ecosystems | Surveillance expertise, technical support, specialized solutions | Lowest application variation; comprehensive surveillance support | Scaling costs if overpromised; technology obsolescence |
| Service specialists | Testing programs, diagnostic supply, technical training | Win service-intensive applications; flexible support | Scalability limitations; narrow market focus |
Key Players in the Veterinary TSE Testing Market
| Items | Values |
|---|---|
| Quantitative Units (2025) | USD 87.4 million |
| Test Modality | Rapid ELISA, Western blot, Immunohistochemistry (IHC), Others |
| TSE Type | BSE (cattle), Scrapie (sheep/goats), CWD (cervids) |
| End User | Veterinary Hospitals & Clinics, Government/public veterinary labs & reference networks, Diagnostics Labs, Others |
| Regions Covered | East Asia, Western Europe, South Asia Pacific, North America, Latin America, Middle East & Africa |
| Countries Covered | China, Germany, United States, Japan, India, South Korea, Brazil, France, United Kingdom, and 25+ additional countries |
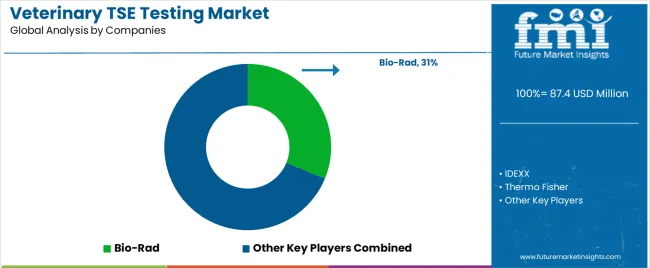
| Key Companies Profiled | Bio-Rad, IDEXX, Thermo Fisher, RT-QuIC |
| Additional Attributes | Dollar sales by test modality and TSE type categories, regional adoption trends across East Asia, Western Europe, and South Asia Pacific, competitive landscape with diagnostic suppliers and laboratory providers, user preferences for testing consistency and operational reliability, integration with surveillance platforms and regulatory monitoring systems, innovations in testing technology and diagnostic enhancement, and development of advanced veterinary TSE testing solutions with enhanced performance and surveillance optimization capabilities. |
The global veterinary TSE testing market is estimated to be valued at USD 87.4 million in 2025.
The market size for the veterinary TSE testing market is projected to reach USD 137.0 million by 2035.
The veterinary TSE testing market is expected to grow at a 4.6% CAGR between 2025 and 2035.
The key product types in veterinary TSE testing market are rapid elisa , western blot, immunohistochemistry (ihc) and others.
In terms of TSE type, bse (cattle) segment to command 46.4% share in the veterinary TSE testing market in 2025.


Full Research Suite comprises of:
Market outlook & trends analysis
Interviews & case studies
Strategic recommendations
Vendor profiles & capabilities analysis
5-year forecasts
8 regions and 60+ country-level data splits
Market segment data splits
12 months of continuous data updates
DELIVERED AS:
PDF EXCEL ONLINE
Veterinary Allergy Diagnostics Market Size and Share Forecast Outlook 2025 to 2035
Veterinary Dermatology Market Forecast Outlook 2025 to 2035
Veterinary Telemedicine Market Size and Share Forecast Outlook 2025 to 2035
Veterinary Dietary Supplements Market Size and Share Forecast Outlook 2025 to 2035
Veterinary Imaging Market Forecast and Outlook 2025 to 2035
Veterinary CRISPR-Based Detection Kits Market Size and Share Forecast Outlook 2025 to 2035
Veterinary Pregnancy Test Kit Market Forecast and Outlook 2025 to 2035
Veterinary X-Ray Illuminators Market Size and Share Forecast Outlook 2025 to 2035
Veterinary Scales Market Size and Share Forecast Outlook 2025 to 2035
Veterinary Grooming Aids Market Size and Share Forecast Outlook 2025 to 2035
Veterinary Micro-fibre Endoscope Market Size and Share Forecast Outlook 2025 to 2035
Veterinary Faecal Filters Market Size and Share Forecast Outlook 2025 to 2035
Veterinary Dental Equipment Market Size and Share Forecast Outlook 2025 to 2035
Veterinary Rapid Test Market Size and Share Forecast Outlook 2025 to 2035
Veterinary Therapeutic Diet Market Size and Share Forecast Outlook 2025 to 2035
Veterinary Glucometers Market Size and Share Forecast Outlook 2025 to 2035
Veterinary Pain Management Drugs Market Size and Share Forecast Outlook 2025 to 2035
Veterinary Anesthesia Machines Market Size and Share Forecast Outlook 2025 to 2035
Veterinary Thermography Market Size and Share Forecast Outlook 2025 to 2035
Veterinary Respiratory Disease Treatment Market Size and Share Forecast Outlook 2025 to 2035

Thank you!
You will receive an email from our Business Development Manager. Please be sure to check your SPAM/JUNK folder too.
Chat With
MaRIA