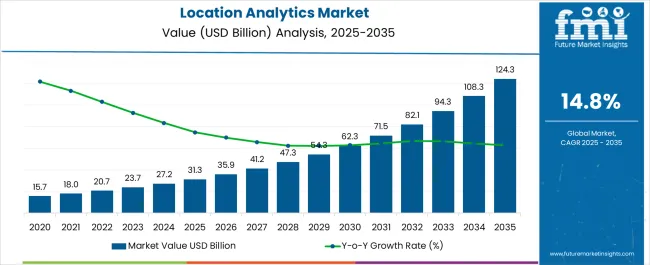
The location analytics market is set to thrive at a strong CAGR of 14.8% during the forecast period. The market holds a share of USD 20.66 billion in 2023, while it is anticipated to cross a value of USD 82.14 billion by 2033.
The research report on the location analytics market explains that the expanding international businesses and advanced location-based enterprise targets are fueling the market growth. The advanced location analytics tools go beyond the basic mapping and add different filters to segregate the data well. These features help businesses in observing the consumer density in any region along with the age, gender, and dimension filters. The location analytics system also helps enterprises in forming predictions, forecasts, and optimizing sales channels. Furthermore, the rising demand to gain a competitive advantage across different industries also flourishes the sales of location analytics systems.
New organizations adopt strategies that focus on different locations and their sales figures in those regions. Small-sized and medium-sized enterprises, along with the BFSI sector adopting location analytics, increase the scalability and agility of the business. The integration of the elements of industries 4.0, such as AI, Machine Learning, Internet of Things with the location analytics platforms makes it more effective
Organizations that work for weather forecasting, population density, the effect of a pandemic, and dynamic geospatial information also adopt location analytic systems. The systems help simplify the complex data and showcase it in laymen’s templates. Rising competition amongst companies across the verticals looks for strong product and service research that could provide them with an edge over each other. Lastly, the rising proficiency and productivity of platforms due to rapid digitization is also flourishing the market growth.
Businesses of different sizes now look for a solution that reduces the research cost while also giving them accurate information about their product’s sale in a specific region. Thus, the expansion of these businesses may cater to the location analytics market. An important vertical of location analytics is the healthcare industry, as it requires location data to regulate and inspect primary care clinics, patient count, and numerous functional hospitals.
Location analytics market outlook states that the future looks promising for the market as it integrates with the latest technology like AI and machine learning. The scope of location analytics in geographical prediction and forecast is likely to support the market assessment. Furthermore, personalized and customized location analytics solution for businesses is anticipated to play a vital role in the market. These customized solutions usually enhance the decision-making power of an organization.
Attributes | Details |
---|---|
Location Analytics Market CAGR (2023 to 2033) | 14.8% |
Location Analytics Market Size (2023) | USD 20.66 billion |
Location Analytics Market Size (2033) | USD 82.14 billion |
From 2017 to 2022, the global location analytics market registered a comparatively higher CAGR of 17.2%. The market was positively affected by the pandemic as corporate and business management extended their service and advanced their consumer-based marketing tactics. The expansion of global positioning systems (GPS) and social media channels has also fueled the demand for location analytics.
Companies adopting advanced business strategies are likely to deliver steady growth during this period. The highly competitive market systems demand powerful solutions for location mapping and regional data analysis. These services are found in the integrated location analytics systems. The market is likely to grow steadily between 2023 and 2028.
The expanding international businesses coupled with the elements introduced by location analytics, such as location sensors and mobile devices. The enhanced capabilities such as location-specific, optimized business practices and predictions. The location analytics market is anticipated to thrive at a CAGR of 14.8% between 2023 and 2033.
The increasing competition and rising application of spatial data are fueling the demand for location analytics tools. Furthermore, the proliferating usage of location-based features and applications is anticipated to drive market growth. Location analytics is widely used as a predictive technology in disaster management applications. The wider range of verticals, coupled with the rising requirement for geographic predictive analytics, is expanding the location analytics market size.
Integration of location-based mapping services with business intelligence modules is also gaining traction in the market. More people installing applications and games that deal with location tracing and analytics is likely to fuel the growth of the location analytics market. Collaboration and mergers between technology giants and location analytics experts to work on research and development and personalized solutions are anticipated to transform the location analytics market.
The main restraints for the market are the limited return on investment (ROI), costly initial deployment, and lower regulatory norms. Furthermore, the lower penetration of 5G, GPS, and smartphone technology in some parts of the world limits the market growth.
Higher Competition across Businesses along with a Large Smartphone Consumer Base is propelling the Regional Growth
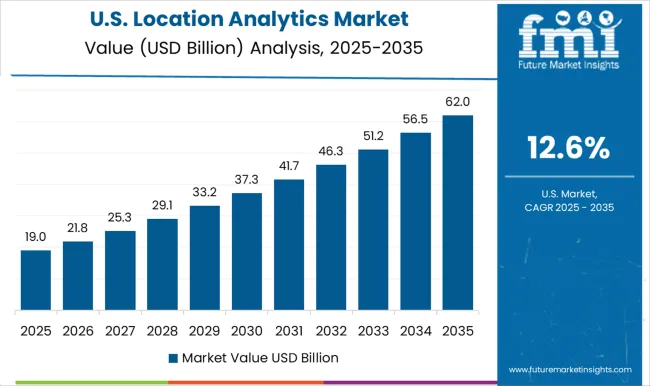
The North American location analytics market is expected to hold the prominent space in 2023.
The United States is expected to dominate the North American region with the higher penetration of smartphones and expanding location-based applications. Risk management and remote monitoring are in high demand across all verticals. The integration of business intelligence systems with location-based analytics tools is delivering fruitful results for enterprises. This further supports the marketing campaigns of companies as they hold more information about the regional market scope.
The application of these systems in analyzing disaster management programs and location-based mapping is helping the government and authorities across the country. Thus, geographical applications are also fueling the demand for location analytics systems.
Expanding Geospatial Applications along with Higher Smartphone Consumer Base is propelling the Regional Growth
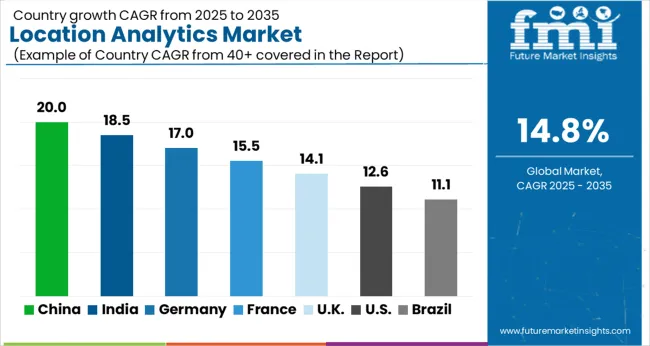
The Asia Pacific region, with its emerging economies like China and India, is penetrating each technologically advanced market. The application of location analytics systems has increased in the region with the proliferating businesses and startups. Furthermore, the government authorities applying these systems in geographical research and climate analysis is likely to fuel the market growth. The huge population of this region is also expected to contribute to location-based markets such as real-time location systems, GPS markets, and location-based analytics markets. The research and development programs integrating the technology with artificial intelligence and IoT are also fueling the sales of location analytics systems.
Increased Tourism with Higher Penetration of Automotive Applications of Location Analytics Are Propelling the Regional Growth
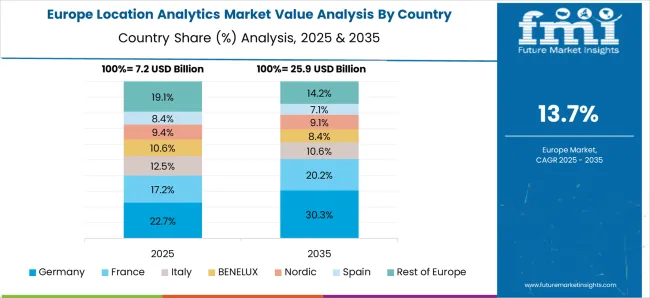
Expanding European businesses and an increased footfall of tourists in countries like Germany, France, Spain, and Poland are fueling the adoption of location analytics systems. Furthermore, the advanced road norms and technology implemented consume a significant chunk of the location analytics market due to its integration with sensory technology that makes traffic management easy. Furthermore, Germany is expected to hold a significant share of the market in the European region. The growth is attributed to expanding transport, communication, delivery system, and logistic services. These elements influence businesses positively.
Segment | Top Application |
---|---|
Top Sub-segment | Remote Monitoring |
Attributes | 10% gains through 2033 |
Segment | Top Industry Vertical |
---|---|
Top Sub-segment | Transportation and Logistics |
Attributes | 25% of the global share |
The remote monitoring segment leads in the application category with an estimated gain of 10% by 2033. This growth is attributed to the higher penetration of remote businesses with locations around the world. International businesses with different locations for different tasks are fueling the demand for remote monitoring applications of location analytics. Utilization of personal spaces for saving the time and space of businesses while saving the workspaces from potential hazards are factors for the growth of this segment.
By industry vertical, the transportation and logistics segment is expected to hold a global share of 25% by 2033. The growth of this segment is directly affected by the increased logistics operations of expanding businesses that use location analytics to figure out the consumer base and delivery options. The systems also help to ensure the delivery status of any package. The location analytics system also helps in finding a courier vehicle, like a truck or a van.
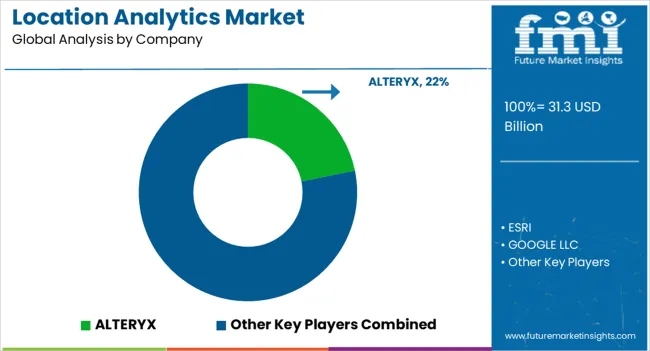
The key players focus on creating a system that can be customized according to the need of the enterprise. Furthermore, the target is to provide an accurate location and add other important elements like density, number, and other data in the analytical report. The market players tie hands with the technology giants to make their products and service more trackable and safer.
Market Developments
Table 1: Global Market Value (US$ Million) Forecast by Region, 2018 to 2033
Table 2: Global Market Value (US$ Million) Forecast by Component, 2018 to 2033
Table 3: Global Market Value (US$ Million) Forecast by Location Type, 2018 to 2033
Table 4: Global Market Value (US$ Million) Forecast by Deployment Mode , 2018 to 2033
Table 5: Global Market Value (US$ Million) Forecast by Application, 2018 to 2033
Table 6: Global Market Value (US$ Million) Forecast by End-User, 2018 to 2033
Table 7: North America Market Value (US$ Million) Forecast by Country, 2018 to 2033
Table 8: North America Market Value (US$ Million) Forecast by Component, 2018 to 2033
Table 9: North America Market Value (US$ Million) Forecast by Location Type, 2018 to 2033
Table 10: North America Market Value (US$ Million) Forecast by Deployment Mode , 2018 to 2033
Table 11: North America Market Value (US$ Million) Forecast by Application, 2018 to 2033
Table 12: North America Market Value (US$ Million) Forecast by End-User, 2018 to 2033
Table 13: Latin America Market Value (US$ Million) Forecast by Country, 2018 to 2033
Table 14: Latin America Market Value (US$ Million) Forecast by Component, 2018 to 2033
Table 15: Latin America Market Value (US$ Million) Forecast by Location Type, 2018 to 2033
Table 16: Latin America Market Value (US$ Million) Forecast by Deployment Mode , 2018 to 2033
Table 17: Latin America Market Value (US$ Million) Forecast by Application, 2018 to 2033
Table 18: Latin America Market Value (US$ Million) Forecast by End-User, 2018 to 2033
Table 19: Europe Market Value (US$ Million) Forecast by Country, 2018 to 2033
Table 20: Europe Market Value (US$ Million) Forecast by Component, 2018 to 2033
Table 21: Europe Market Value (US$ Million) Forecast by Location Type, 2018 to 2033
Table 22: Europe Market Value (US$ Million) Forecast by Deployment Mode , 2018 to 2033
Table 23: Europe Market Value (US$ Million) Forecast by Application, 2018 to 2033
Table 24: Europe Market Value (US$ Million) Forecast by End-User, 2018 to 2033
Table 25: South Asia Market Value (US$ Million) Forecast by Country, 2018 to 2033
Table 26: South Asia Market Value (US$ Million) Forecast by Component, 2018 to 2033
Table 27: South Asia Market Value (US$ Million) Forecast by Location Type, 2018 to 2033
Table 28: South Asia Market Value (US$ Million) Forecast by Deployment Mode , 2018 to 2033
Table 29: South Asia Market Value (US$ Million) Forecast by Application, 2018 to 2033
Table 30: South Asia Market Value (US$ Million) Forecast by End-User, 2018 to 2033
Table 31: East Asia Market Value (US$ Million) Forecast by Country, 2018 to 2033
Table 32: East Asia Market Value (US$ Million) Forecast by Component, 2018 to 2033
Table 33: East Asia Market Value (US$ Million) Forecast by Location Type, 2018 to 2033
Table 34: East Asia Market Value (US$ Million) Forecast by Deployment Mode , 2018 to 2033
Table 35: East Asia Market Value (US$ Million) Forecast by Application, 2018 to 2033
Table 36: East Asia Market Value (US$ Million) Forecast by End-User, 2018 to 2033
Table 37: Oceania Market Value (US$ Million) Forecast by Country, 2018 to 2033
Table 38: Oceania Market Value (US$ Million) Forecast by Component, 2018 to 2033
Table 39: Oceania Market Value (US$ Million) Forecast by Location Type, 2018 to 2033
Table 40: Oceania Market Value (US$ Million) Forecast by Deployment Mode , 2018 to 2033
Table 41: Oceania Market Value (US$ Million) Forecast by Application, 2018 to 2033
Table 42: Oceania Market Value (US$ Million) Forecast by End-User, 2018 to 2033
Table 43: MEA Market Value (US$ Million) Forecast by Country, 2018 to 2033
Table 44: MEA Market Value (US$ Million) Forecast by Component, 2018 to 2033
Table 45: MEA Market Value (US$ Million) Forecast by Location Type, 2018 to 2033
Table 46: MEA Market Value (US$ Million) Forecast by Deployment Mode , 2018 to 2033
Table 47: MEA Market Value (US$ Million) Forecast by Application, 2018 to 2033
Table 48: MEA Market Value (US$ Million) Forecast by End-User, 2018 to 2033
Figure 1: Global Market Value (US$ Million) by Component, 2023 to 2033
Figure 2: Global Market Value (US$ Million) by Location Type, 2023 to 2033
Figure 3: Global Market Value (US$ Million) by Deployment Mode , 2023 to 2033
Figure 4: Global Market Value (US$ Million) by Application, 2023 to 2033
Figure 5: Global Market Value (US$ Million) by End-User, 2023 to 2033
Figure 6: Global Market Value (US$ Million) by Region, 2023 to 2033
Figure 7: Global Market Value (US$ Million) Analysis by Region, 2018 to 2033
Figure 8: Global Market Value Share (%) and BPS Analysis by Region, 2023 to 2033
Figure 9: Global Market Y-o-Y Growth (%) Projections by Region, 2023 to 2033
Figure 10: Global Market Value (US$ Million) Analysis by Component, 2018 to 2033
Figure 11: Global Market Value Share (%) and BPS Analysis by Component, 2023 to 2033
Figure 12: Global Market Y-o-Y Growth (%) Projections by Component, 2023 to 2033
Figure 13: Global Market Value (US$ Million) Analysis by Location Type, 2018 to 2033
Figure 14: Global Market Value Share (%) and BPS Analysis by Location Type, 2023 to 2033
Figure 15: Global Market Y-o-Y Growth (%) Projections by Location Type, 2023 to 2033
Figure 16: Global Market Value (US$ Million) Analysis by Deployment Mode , 2018 to 2033
Figure 17: Global Market Value Share (%) and BPS Analysis by Deployment Mode , 2023 to 2033
Figure 18: Global Market Y-o-Y Growth (%) Projections by Deployment Mode , 2023 to 2033
Figure 19: Global Market Value (US$ Million) Analysis by Application, 2018 to 2033
Figure 20: Global Market Value Share (%) and BPS Analysis by Application, 2023 to 2033
Figure 21: Global Market Y-o-Y Growth (%) Projections by Application, 2023 to 2033
Figure 22: Global Market Value (US$ Million) Analysis by End-User, 2018 to 2033
Figure 23: Global Market Value Share (%) and BPS Analysis by End-User, 2023 to 2033
Figure 24: Global Market Y-o-Y Growth (%) Projections by End-User, 2023 to 2033
Figure 25: Global Market Attractiveness by Component, 2023 to 2033
Figure 26: Global Market Attractiveness by Location Type, 2023 to 2033
Figure 27: Global Market Attractiveness by Deployment Mode , 2023 to 2033
Figure 28: Global Market Attractiveness by Application, 2023 to 2033
Figure 29: Global Market Attractiveness by End-User, 2023 to 2033
Figure 30: Global Market Attractiveness by Region, 2023 to 2033
Figure 31: North America Market Value (US$ Million) by Component, 2023 to 2033
Figure 32: North America Market Value (US$ Million) by Location Type, 2023 to 2033
Figure 33: North America Market Value (US$ Million) by Deployment Mode , 2023 to 2033
Figure 34: North America Market Value (US$ Million) by Application, 2023 to 2033
Figure 35: North America Market Value (US$ Million) by End-User, 2023 to 2033
Figure 36: North America Market Value (US$ Million) by Country, 2023 to 2033
Figure 37: North America Market Value (US$ Million) Analysis by Country, 2018 to 2033
Figure 38: North America Market Value Share (%) and BPS Analysis by Country, 2023 to 2033
Figure 39: North America Market Y-o-Y Growth (%) Projections by Country, 2023 to 2033
Figure 40: North America Market Value (US$ Million) Analysis by Component, 2018 to 2033
Figure 41: North America Market Value Share (%) and BPS Analysis by Component, 2023 to 2033
Figure 42: North America Market Y-o-Y Growth (%) Projections by Component, 2023 to 2033
Figure 43: North America Market Value (US$ Million) Analysis by Location Type, 2018 to 2033
Figure 44: North America Market Value Share (%) and BPS Analysis by Location Type, 2023 to 2033
Figure 45: North America Market Y-o-Y Growth (%) Projections by Location Type, 2023 to 2033
Figure 46: North America Market Value (US$ Million) Analysis by Deployment Mode , 2018 to 2033
Figure 47: North America Market Value Share (%) and BPS Analysis by Deployment Mode , 2023 to 2033
Figure 48: North America Market Y-o-Y Growth (%) Projections by Deployment Mode , 2023 to 2033
Figure 49: North America Market Value (US$ Million) Analysis by Application, 2018 to 2033
Figure 50: North America Market Value Share (%) and BPS Analysis by Application, 2023 to 2033
Figure 51: North America Market Y-o-Y Growth (%) Projections by Application, 2023 to 2033
Figure 52: North America Market Value (US$ Million) Analysis by End-User, 2018 to 2033
Figure 53: North America Market Value Share (%) and BPS Analysis by End-User, 2023 to 2033
Figure 54: North America Market Y-o-Y Growth (%) Projections by End-User, 2023 to 2033
Figure 55: North America Market Attractiveness by Component, 2023 to 2033
Figure 56: North America Market Attractiveness by Location Type, 2023 to 2033
Figure 57: North America Market Attractiveness by Deployment Mode , 2023 to 2033
Figure 58: North America Market Attractiveness by Application, 2023 to 2033
Figure 59: North America Market Attractiveness by End-User, 2023 to 2033
Figure 60: North America Market Attractiveness by Country, 2023 to 2033
Figure 61: Latin America Market Value (US$ Million) by Component, 2023 to 2033
Figure 62: Latin America Market Value (US$ Million) by Location Type, 2023 to 2033
Figure 63: Latin America Market Value (US$ Million) by Deployment Mode , 2023 to 2033
Figure 64: Latin America Market Value (US$ Million) by Application, 2023 to 2033
Figure 65: Latin America Market Value (US$ Million) by End-User, 2023 to 2033
Figure 66: Latin America Market Value (US$ Million) by Country, 2023 to 2033
Figure 67: Latin America Market Value (US$ Million) Analysis by Country, 2018 to 2033
Figure 68: Latin America Market Value Share (%) and BPS Analysis by Country, 2023 to 2033
Figure 69: Latin America Market Y-o-Y Growth (%) Projections by Country, 2023 to 2033
Figure 70: Latin America Market Value (US$ Million) Analysis by Component, 2018 to 2033
Figure 71: Latin America Market Value Share (%) and BPS Analysis by Component, 2023 to 2033
Figure 72: Latin America Market Y-o-Y Growth (%) Projections by Component, 2023 to 2033
Figure 73: Latin America Market Value (US$ Million) Analysis by Location Type, 2018 to 2033
Figure 74: Latin America Market Value Share (%) and BPS Analysis by Location Type, 2023 to 2033
Figure 75: Latin America Market Y-o-Y Growth (%) Projections by Location Type, 2023 to 2033
Figure 76: Latin America Market Value (US$ Million) Analysis by Deployment Mode , 2018 to 2033
Figure 77: Latin America Market Value Share (%) and BPS Analysis by Deployment Mode , 2023 to 2033
Figure 78: Latin America Market Y-o-Y Growth (%) Projections by Deployment Mode , 2023 to 2033
Figure 79: Latin America Market Value (US$ Million) Analysis by Application, 2018 to 2033
Figure 80: Latin America Market Value Share (%) and BPS Analysis by Application, 2023 to 2033
Figure 81: Latin America Market Y-o-Y Growth (%) Projections by Application, 2023 to 2033
Figure 82: Latin America Market Value (US$ Million) Analysis by End-User, 2018 to 2033
Figure 83: Latin America Market Value Share (%) and BPS Analysis by End-User, 2023 to 2033
Figure 84: Latin America Market Y-o-Y Growth (%) Projections by End-User, 2023 to 2033
Figure 85: Latin America Market Attractiveness by Component, 2023 to 2033
Figure 86: Latin America Market Attractiveness by Location Type, 2023 to 2033
Figure 87: Latin America Market Attractiveness by Deployment Mode , 2023 to 2033
Figure 88: Latin America Market Attractiveness by Application, 2023 to 2033
Figure 89: Latin America Market Attractiveness by End-User, 2023 to 2033
Figure 90: Latin America Market Attractiveness by Country, 2023 to 2033
Figure 91: Europe Market Value (US$ Million) by Component, 2023 to 2033
Figure 92: Europe Market Value (US$ Million) by Location Type, 2023 to 2033
Figure 93: Europe Market Value (US$ Million) by Deployment Mode , 2023 to 2033
Figure 94: Europe Market Value (US$ Million) by Application, 2023 to 2033
Figure 95: Europe Market Value (US$ Million) by End-User, 2023 to 2033
Figure 96: Europe Market Value (US$ Million) by Country, 2023 to 2033
Figure 97: Europe Market Value (US$ Million) Analysis by Country, 2018 to 2033
Figure 98: Europe Market Value Share (%) and BPS Analysis by Country, 2023 to 2033
Figure 99: Europe Market Y-o-Y Growth (%) Projections by Country, 2023 to 2033
Figure 100: Europe Market Value (US$ Million) Analysis by Component, 2018 to 2033
Figure 101: Europe Market Value Share (%) and BPS Analysis by Component, 2023 to 2033
Figure 102: Europe Market Y-o-Y Growth (%) Projections by Component, 2023 to 2033
Figure 103: Europe Market Value (US$ Million) Analysis by Location Type, 2018 to 2033
Figure 104: Europe Market Value Share (%) and BPS Analysis by Location Type, 2023 to 2033
Figure 105: Europe Market Y-o-Y Growth (%) Projections by Location Type, 2023 to 2033
Figure 106: Europe Market Value (US$ Million) Analysis by Deployment Mode , 2018 to 2033
Figure 107: Europe Market Value Share (%) and BPS Analysis by Deployment Mode , 2023 to 2033
Figure 108: Europe Market Y-o-Y Growth (%) Projections by Deployment Mode , 2023 to 2033
Figure 109: Europe Market Value (US$ Million) Analysis by Application, 2018 to 2033
Figure 110: Europe Market Value Share (%) and BPS Analysis by Application, 2023 to 2033
Figure 111: Europe Market Y-o-Y Growth (%) Projections by Application, 2023 to 2033
Figure 112: Europe Market Value (US$ Million) Analysis by End-User, 2018 to 2033
Figure 113: Europe Market Value Share (%) and BPS Analysis by End-User, 2023 to 2033
Figure 114: Europe Market Y-o-Y Growth (%) Projections by End-User, 2023 to 2033
Figure 115: Europe Market Attractiveness by Component, 2023 to 2033
Figure 116: Europe Market Attractiveness by Location Type, 2023 to 2033
Figure 117: Europe Market Attractiveness by Deployment Mode , 2023 to 2033
Figure 118: Europe Market Attractiveness by Application, 2023 to 2033
Figure 119: Europe Market Attractiveness by End-User, 2023 to 2033
Figure 120: Europe Market Attractiveness by Country, 2023 to 2033
Figure 121: South Asia Market Value (US$ Million) by Component, 2023 to 2033
Figure 122: South Asia Market Value (US$ Million) by Location Type, 2023 to 2033
Figure 123: South Asia Market Value (US$ Million) by Deployment Mode , 2023 to 2033
Figure 124: South Asia Market Value (US$ Million) by Application, 2023 to 2033
Figure 125: South Asia Market Value (US$ Million) by End-User, 2023 to 2033
Figure 126: South Asia Market Value (US$ Million) by Country, 2023 to 2033
Figure 127: South Asia Market Value (US$ Million) Analysis by Country, 2018 to 2033
Figure 128: South Asia Market Value Share (%) and BPS Analysis by Country, 2023 to 2033
Figure 129: South Asia Market Y-o-Y Growth (%) Projections by Country, 2023 to 2033
Figure 130: South Asia Market Value (US$ Million) Analysis by Component, 2018 to 2033
Figure 131: South Asia Market Value Share (%) and BPS Analysis by Component, 2023 to 2033
Figure 132: South Asia Market Y-o-Y Growth (%) Projections by Component, 2023 to 2033
Figure 133: South Asia Market Value (US$ Million) Analysis by Location Type, 2018 to 2033
Figure 134: South Asia Market Value Share (%) and BPS Analysis by Location Type, 2023 to 2033
Figure 135: South Asia Market Y-o-Y Growth (%) Projections by Location Type, 2023 to 2033
Figure 136: South Asia Market Value (US$ Million) Analysis by Deployment Mode , 2018 to 2033
Figure 137: South Asia Market Value Share (%) and BPS Analysis by Deployment Mode , 2023 to 2033
Figure 138: South Asia Market Y-o-Y Growth (%) Projections by Deployment Mode , 2023 to 2033
Figure 139: South Asia Market Value (US$ Million) Analysis by Application, 2018 to 2033
Figure 140: South Asia Market Value Share (%) and BPS Analysis by Application, 2023 to 2033
Figure 141: South Asia Market Y-o-Y Growth (%) Projections by Application, 2023 to 2033
Figure 142: South Asia Market Value (US$ Million) Analysis by End-User, 2018 to 2033
Figure 143: South Asia Market Value Share (%) and BPS Analysis by End-User, 2023 to 2033
Figure 144: South Asia Market Y-o-Y Growth (%) Projections by End-User, 2023 to 2033
Figure 145: South Asia Market Attractiveness by Component, 2023 to 2033
Figure 146: South Asia Market Attractiveness by Location Type, 2023 to 2033
Figure 147: South Asia Market Attractiveness by Deployment Mode , 2023 to 2033
Figure 148: South Asia Market Attractiveness by Application, 2023 to 2033
Figure 149: South Asia Market Attractiveness by End-User, 2023 to 2033
Figure 150: South Asia Market Attractiveness by Country, 2023 to 2033
Figure 151: East Asia Market Value (US$ Million) by Component, 2023 to 2033
Figure 152: East Asia Market Value (US$ Million) by Location Type, 2023 to 2033
Figure 153: East Asia Market Value (US$ Million) by Deployment Mode , 2023 to 2033
Figure 154: East Asia Market Value (US$ Million) by Application, 2023 to 2033
Figure 155: East Asia Market Value (US$ Million) by End-User, 2023 to 2033
Figure 156: East Asia Market Value (US$ Million) by Country, 2023 to 2033
Figure 157: East Asia Market Value (US$ Million) Analysis by Country, 2018 to 2033
Figure 158: East Asia Market Value Share (%) and BPS Analysis by Country, 2023 to 2033
Figure 159: East Asia Market Y-o-Y Growth (%) Projections by Country, 2023 to 2033
Figure 160: East Asia Market Value (US$ Million) Analysis by Component, 2018 to 2033
Figure 161: East Asia Market Value Share (%) and BPS Analysis by Component, 2023 to 2033
Figure 162: East Asia Market Y-o-Y Growth (%) Projections by Component, 2023 to 2033
Figure 163: East Asia Market Value (US$ Million) Analysis by Location Type, 2018 to 2033
Figure 164: East Asia Market Value Share (%) and BPS Analysis by Location Type, 2023 to 2033
Figure 165: East Asia Market Y-o-Y Growth (%) Projections by Location Type, 2023 to 2033
Figure 166: East Asia Market Value (US$ Million) Analysis by Deployment Mode , 2018 to 2033
Figure 167: East Asia Market Value Share (%) and BPS Analysis by Deployment Mode , 2023 to 2033
Figure 168: East Asia Market Y-o-Y Growth (%) Projections by Deployment Mode , 2023 to 2033
Figure 169: East Asia Market Value (US$ Million) Analysis by Application, 2018 to 2033
Figure 170: East Asia Market Value Share (%) and BPS Analysis by Application, 2023 to 2033
Figure 171: East Asia Market Y-o-Y Growth (%) Projections by Application, 2023 to 2033
Figure 172: East Asia Market Value (US$ Million) Analysis by End-User, 2018 to 2033
Figure 173: East Asia Market Value Share (%) and BPS Analysis by End-User, 2023 to 2033
Figure 174: East Asia Market Y-o-Y Growth (%) Projections by End-User, 2023 to 2033
Figure 175: East Asia Market Attractiveness by Component, 2023 to 2033
Figure 176: East Asia Market Attractiveness by Location Type, 2023 to 2033
Figure 177: East Asia Market Attractiveness by Deployment Mode , 2023 to 2033
Figure 178: East Asia Market Attractiveness by Application, 2023 to 2033
Figure 179: East Asia Market Attractiveness by End-User, 2023 to 2033
Figure 180: East Asia Market Attractiveness by Country, 2023 to 2033
Figure 181: Oceania Market Value (US$ Million) by Component, 2023 to 2033
Figure 182: Oceania Market Value (US$ Million) by Location Type, 2023 to 2033
Figure 183: Oceania Market Value (US$ Million) by Deployment Mode , 2023 to 2033
Figure 184: Oceania Market Value (US$ Million) by Application, 2023 to 2033
Figure 185: Oceania Market Value (US$ Million) by End-User, 2023 to 2033
Figure 186: Oceania Market Value (US$ Million) by Country, 2023 to 2033
Figure 187: Oceania Market Value (US$ Million) Analysis by Country, 2018 to 2033
Figure 188: Oceania Market Value Share (%) and BPS Analysis by Country, 2023 to 2033
Figure 189: Oceania Market Y-o-Y Growth (%) Projections by Country, 2023 to 2033
Figure 190: Oceania Market Value (US$ Million) Analysis by Component, 2018 to 2033
Figure 191: Oceania Market Value Share (%) and BPS Analysis by Component, 2023 to 2033
Figure 192: Oceania Market Y-o-Y Growth (%) Projections by Component, 2023 to 2033
Figure 193: Oceania Market Value (US$ Million) Analysis by Location Type, 2018 to 2033
Figure 194: Oceania Market Value Share (%) and BPS Analysis by Location Type, 2023 to 2033
Figure 195: Oceania Market Y-o-Y Growth (%) Projections by Location Type, 2023 to 2033
Figure 196: Oceania Market Value (US$ Million) Analysis by Deployment Mode , 2018 to 2033
Figure 197: Oceania Market Value Share (%) and BPS Analysis by Deployment Mode , 2023 to 2033
Figure 198: Oceania Market Y-o-Y Growth (%) Projections by Deployment Mode , 2023 to 2033
Figure 199: Oceania Market Value (US$ Million) Analysis by Application, 2018 to 2033
Figure 200: Oceania Market Value Share (%) and BPS Analysis by Application, 2023 to 2033
Figure 201: Oceania Market Y-o-Y Growth (%) Projections by Application, 2023 to 2033
Figure 202: Oceania Market Value (US$ Million) Analysis by End-User, 2018 to 2033
Figure 203: Oceania Market Value Share (%) and BPS Analysis by End-User, 2023 to 2033
Figure 204: Oceania Market Y-o-Y Growth (%) Projections by End-User, 2023 to 2033
Figure 205: Oceania Market Attractiveness by Component, 2023 to 2033
Figure 206: Oceania Market Attractiveness by Location Type, 2023 to 2033
Figure 207: Oceania Market Attractiveness by Deployment Mode , 2023 to 2033
Figure 208: Oceania Market Attractiveness by Application, 2023 to 2033
Figure 209: Oceania Market Attractiveness by End-User, 2023 to 2033
Figure 210: Oceania Market Attractiveness by Country, 2023 to 2033
Figure 211: MEA Market Value (US$ Million) by Component, 2023 to 2033
Figure 212: MEA Market Value (US$ Million) by Location Type, 2023 to 2033
Figure 213: MEA Market Value (US$ Million) by Deployment Mode , 2023 to 2033
Figure 214: MEA Market Value (US$ Million) by Application, 2023 to 2033
Figure 215: MEA Market Value (US$ Million) by End-User, 2023 to 2033
Figure 216: MEA Market Value (US$ Million) by Country, 2023 to 2033
Figure 217: MEA Market Value (US$ Million) Analysis by Country, 2018 to 2033
Figure 218: MEA Market Value Share (%) and BPS Analysis by Country, 2023 to 2033
Figure 219: MEA Market Y-o-Y Growth (%) Projections by Country, 2023 to 2033
Figure 220: MEA Market Value (US$ Million) Analysis by Component, 2018 to 2033
Figure 221: MEA Market Value Share (%) and BPS Analysis by Component, 2023 to 2033
Figure 222: MEA Market Y-o-Y Growth (%) Projections by Component, 2023 to 2033
Figure 223: MEA Market Value (US$ Million) Analysis by Location Type, 2018 to 2033
Figure 224: MEA Market Value Share (%) and BPS Analysis by Location Type, 2023 to 2033
Figure 225: MEA Market Y-o-Y Growth (%) Projections by Location Type, 2023 to 2033
Figure 226: MEA Market Value (US$ Million) Analysis by Deployment Mode , 2018 to 2033
Figure 227: MEA Market Value Share (%) and BPS Analysis by Deployment Mode , 2023 to 2033
Figure 228: MEA Market Y-o-Y Growth (%) Projections by Deployment Mode , 2023 to 2033
Figure 229: MEA Market Value (US$ Million) Analysis by Application, 2018 to 2033
Figure 230: MEA Market Value Share (%) and BPS Analysis by Application, 2023 to 2033
Figure 231: MEA Market Y-o-Y Growth (%) Projections by Application, 2023 to 2033
Figure 232: MEA Market Value (US$ Million) Analysis by End-User, 2018 to 2033
Figure 233: MEA Market Value Share (%) and BPS Analysis by End-User, 2023 to 2033
Figure 234: MEA Market Y-o-Y Growth (%) Projections by End-User, 2023 to 2033
Figure 235: MEA Market Attractiveness by Component, 2023 to 2033
Figure 236: MEA Market Attractiveness by Location Type, 2023 to 2033
Figure 237: MEA Market Attractiveness by Deployment Mode , 2023 to 2033
Figure 238: MEA Market Attractiveness by Application, 2023 to 2033
Figure 239: MEA Market Attractiveness by End-User, 2023 to 2033
Figure 240: MEA Market Attractiveness by Country, 2023 to 2033
The location analytics market held a value of USD 18 billion in 2022.
The market is estimated to hold a value of USD 20.66 billion in 2023.
The location analytics market is anticipated to hold a valuation of USD 82.14 billion by 2033.
The location analytics market thrived at a 17.2% CAGR in the last four years, from 2017 to 2022.
The location analytics market is expected to record a CAGR of 14.8% by 2033.
Remote monitoring is expected to lead the application category with an expected gain of 10% by 2033.
The transportation and logistics segment is anticipated to top the industrial vertical tally with a hold of 25% of global support.
Explore Similar Insights
Thank you!
You will receive an email from our Business Development Manager. Please be sure to check your SPAM/JUNK folder too.