Polyimide Fibers Market Outlook and Forecast 2025 to 2035

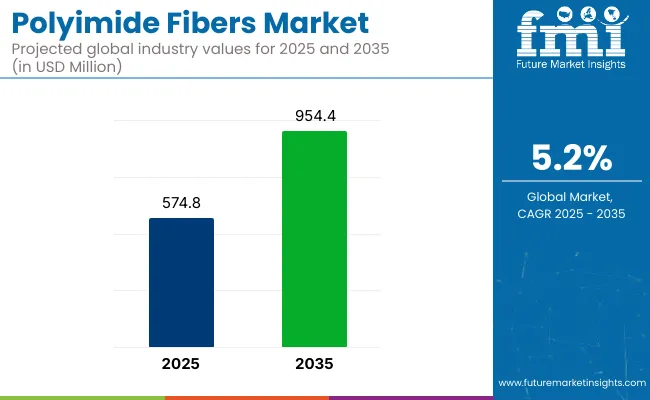
The global polyimide fibers market is valued at USD 574.8 million in 2025 and is slated to be worth USD 954.4 million by 2035, reflecting a CAGR of 5.2%. Market expansion is being driven by increased demand for high-performance, heat-resistant, and chemically stable fibers in sectors such as aerospace, automotive, and industrial filtration.
Quick Stats Polyimide Fibers Market

  • Market Value (2025): USD 574.8 million
  • Forecast Value (2035): USD 954.4 million
  • Forecast CAGR: 5.2%
  • Leading Application Segment in 2025: Filter Media (38% Market Share)
  • Top End Use Segment: Power & Utilities (34% Market Share in 2025)
  • Key Growth Region: Asia Pacific (Japan is the fastest-growing market with 5.4% CAGR)

Polyimide Fibers Market

Metric Value
Market Size (2025) USD 574.8 million
Market Size (2035) USD 954.4 million
CAGR (2025 to 2035) 5.2%

Rising investments in protective clothing for defense and firefighting applications, along with growing needs for sustainable and recyclable materials, are expected to further fuel this demand. Additionally, innovations in smart textiles and nanofiber-based filtration technologies are being prioritized by manufacturers to remain competitive.

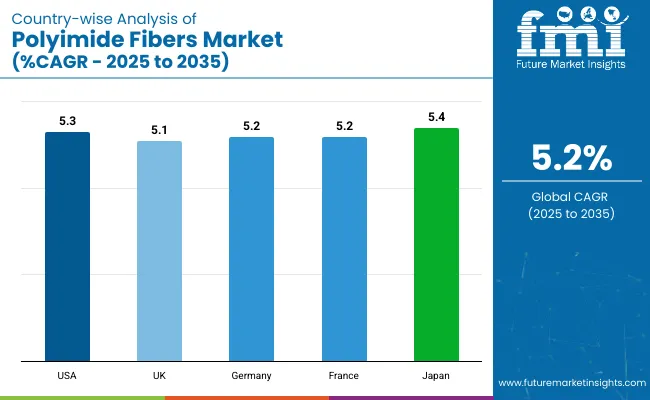
The USA is expected to hold the largest share of the polyimide fibers market, driven by significant usage in aerospace and industrial safety sectors. Japan is anticipated to register the highest CAGR of 5.4% during the study period, supported by rising investments in semiconductors, electric vehicles, and protective textiles. In 2025, filter media is projected to hold approximately 38% of the application share, while power & utilities is estimated to lead the end use segment with around 34% market share.

Significant innovations have been introduced in the polyimide fibers market through the integration of nanotechnology and AI-assisted manufacturing. Smart fibers with self-healing capabilities and enhanced conductivity have been developed to meet the rising demands of the aerospace and wearable electronics sectors.

Bio-based polyimide fibers are being engineered to reduce environmental impact while maintaining high performance. Additionally, advanced coating techniques and hybrid composite technologies have been implemented to extend fiber durability and versatility.

Stringent environmental and industrial safety regulations have been enforced across key markets to ensure compliance with sustainable production standards. In the European Union, carbon-neutral manufacturing mandates and restrictions on hazardous emissions have driven the adoption of eco-friendly polyimide fibers. In the USA and Japan, government grants have been provided to encourage R&D in advanced material technologies, including fire-resistant and recyclable fibers.

Analyzing Polyimide Fibers Market by Top Investment Segments

The polyimide fibers market is segmented based on application, end use, and region. By application, the segments include filter media, protective clothing, insulation material, and others (including fiber-reinforced composites, electrical wrapping, and structural laminates).

Under end use, segmentation includes construction, power & utilities, chemical & processing, mining, and others (such as aerospace, defense, and transportation sectors). Regionally, the market is divided into North America, Latin America, East Asia, South Asia & Pacific, Eastern Europe, Western Europe, and Middle East & Africa.

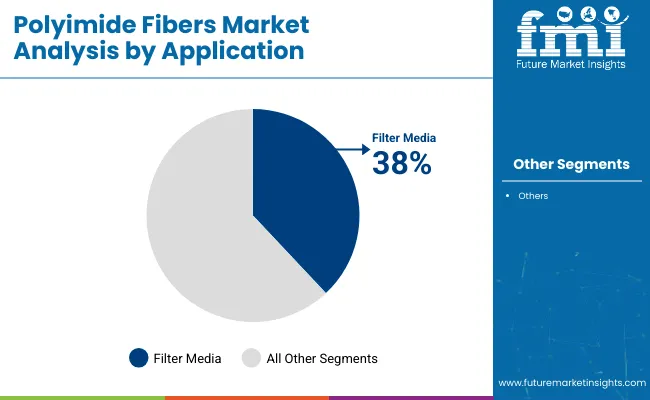
Filter Media to Lead the Application Segment with 38% Market Share in 2025

Filter media is projected to lead the application segment with a 38% share in 2025, driven by high-temperature industrial needs and stricter emission norms. Protective clothing and insulation material have followed, supported by fire safety standards and aerospace demand.
  • Growth has been driven by its use in high-temperature industrial filtration systems.
  • Adoption has been accelerated by automotive exhaust control technologies and stricter environmental regulations.
  • Long operational life and chemical resistance have made polyimide fibers preferable for dust collectors and emission filters.

Polyimide Fibers Market Analysis By Application

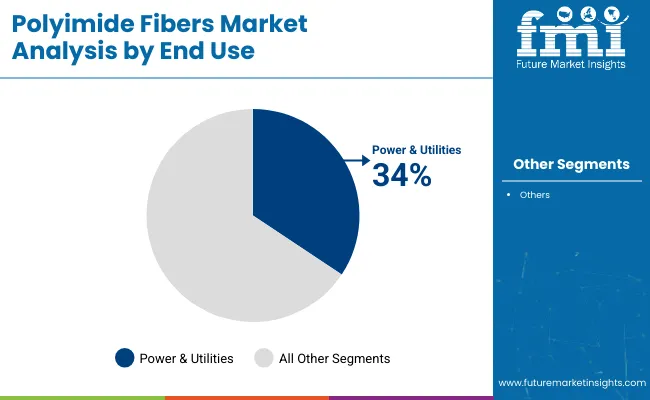
Power & Utilities to Lead the End Use Segment with 34% Market Share in 2025

Power & utilities has been projected to be the most lucrative end use segment, holding an estimated 34% market share in 2025.
  • Growth has been driven by the use of polyimide fibers in high-voltage insulation, transformer windings, and thermal protection for energy systems.
  • Demand has been supported by renewable energy investments, smart grid infrastructure, and next-generation power transmission technologies.
  • The segment’s expansion has been enabled by the fiber’s thermal stability, chemical resistance, and durability in extreme environments.

Polyimide Fibers Market Analysis By End Use

Polyimide Fibers Market Dynamics

The polyimide fibers market is experiencing steady growth, fueled by rising demand for high-performance materials, sustainability-driven innovation, and advancements in fiber processing and automation technologies.

Recent Trends in the Polyimide Fibers Market

  • Smart textiles and nanofiber-enhanced filtration technologies have been increasingly developed.
  • Bio-based and recyclable polyimide fibers have been prioritized by manufacturers.
  • AI-assisted manufacturing and automation have been integrated into fiber production.
  • Customized fiber solutions for aerospace, defense, and electronics have been introduced.
  • Strategic R&D partnerships with research institutions have been actively pursued.

Key Challenges

  • High production costs and complex polymerization processes have hindered scalability.
  • Limited awareness in emerging markets has delayed widespread adoption.
  • Supply chain constraints and raw material availability have disrupted operations.
  • Competition from lower-cost synthetic alternatives has reduced market penetration.
  • Environmental compliance requirements have increased operational burdens for smaller manufacturers.

Analyzing Top Countries Manufacturing and Supplying Polyimide Fibers

Polyimide Fibers Market Country Wise Analysis

USA Polyimide Fibers Market Analysis

Sales of polyimide fibers in the USA have been projected to grow at a CAGR of 5.3% from 2025 to 2035. Growth has been fueled by advanced applications in aerospace, defense, and industrial sectors. Strong government investment in material R&D, along with increasing demand for durable, heat-resistant fibers, has positioned the USA as a market leader.

  • Extensive R&D efforts in aerospace and military-grade fibers have been supported.
  • High-performance applications in filtration and electrical insulation have been prioritized.
  • Leading companies like DuPont have expanded fiber innovation pipelines.
  • Stringent safety regulations have accelerated adoption across industrial settings.
  • Sustainability-driven manufacturing practices have been actively implemented.

Polyimide Fiber Sales Analysis in the UK

The polyimide fiber demand in the UK is estimated to grow at a 5.1% CAGR between 2025 and 2035. Strong demand has been observed in aerospace, defense, and fire safety sectors. Research funding and regulatory enforcement around environmental safety have enhanced fiber adoption and innovation in high-durability and flame-retardant textile solutions.

  • Regulatory frameworks for sustainable fibers have been introduced.
  • Growth in defense contracts for protective gear has been recorded.
  • Industry-academic partnerships for smart textiles have been promoted.
  • Biodegradable and eco-compliant fiber technologies have been advanced.
  • Domestic production capacity has been strengthened through incentives.

Polyimide Fibers Demand Analysis in Germany

Germany’s polyimide fibers market is expected to grow at a CAGR of 5.2% during the forecast period. Industrial innovation, particularly in filtration and automotive exhaust control, has driven consistent demand. Germany’s engineering capabilities and environmental compliance policies have enabled the rapid integration of polyimide fibers across infrastructure and electronic applications.

  • Emission control initiatives have mandated high-performance filtration.
  • Heat-resistant materials for transport and machinery have been developed.
  • Collaboration with EU-wide sustainability programs has been undertaken.
  • Fireproof textiles in public infrastructure have been increasingly adopted.
  • Germany has emerged as a key hub for fiber processing technology.

France Polyimide Fibers Market Analysis

The France polyimide fibers market is poised to witness a 5.2% CAGR from 2025 to 2035. The country has maintained a balanced demand across construction, chemical processing, and defense sectors. Innovation in thermal insulation and industrial protective clothing has been supported by government funding and EU-aligned regulations.

  • Usage in fire-retardant construction materials has been promoted.
  • Local production for energy-efficient fibers has been incentivized.
  • Industrial wearables and insulation products have been scaled.
  • Investments in eco-friendly polymer research have been increased.
  • Fiber adoption in aviation and railway applications has been observed.

Polyimide Fibers Demand Analysis in Japan

Japan’s polyimide fibers industry is projected to register a CAGR of 5.4% through 2035, driven by electronics manufacturing, miniaturization of semiconductors, and automotive innovations. Fiber optimization using automation and smart production lines has been implemented to improve material resilience, making Japan a technology leader in the segment.

  • Integration in high-temperature circuit insulation has been prioritized.
  • Applications in EV battery safety systems have been developed.
  • AI-driven fiber quality control has been deployed.
  • Heat-stable composites for aerospace have been manufactured.
  • National research programs have supported advanced polymer engineering.

Leading Polyimide Fibers Suppliers and Manufacturers

The global polyimide fibers market is characterized by a moderately consolidated structure, with leading players such as Jiangsu Shino New Materials Technology Co., Ltd., Changchun Hipolyking Co., Ltd., and Jiangsu Aoshen Hi-Tech Materials Co., Ltd. holding significant market shares. These companies are actively investing in research and development to enhance product performance and expand their application areas. Strategic collaborations and expansions are also being pursued to strengthen their market positions.

Jiangsu Shino New Materials Technology Co., Ltd. has focused on developing high-performance polyimide fibers with superior thermal stability and chemical resistance. Changchun Hipolyking Co., Ltd. has emphasized the production of polyimide raw materials and nano-products, catering to various industrial needs. Jiangsu Aoshen Hi-Tech Materials Co., Ltd. has made significant strides in producing polyimide fibers using dry spinning methods, achieving large-scale production capabilities.

Recent Polyimide Fibers Market News

  • ABB Group was contracted in mid-2024 to supply the world’s largest production-capacity mine-hoist system to BHP’s Jansen potash project, expanding ABB’s installed base of heavy hoist motors.

Polyimide Fibers Market Report Scope

Report Attributes Details
Current Total Market Size (2025) USD 574.8 million
Projected Market Size (2035) USD 954.4 million
CAGR (2025 to 2035) 5.2%
Base Year for Estimation 2024
Historical Period 2020 to 2024
Projections Period 2025 to 2035
Market Analysis Parameters Revenue in USD million/Volume in kilotons
By Application Filter Media, Protective Clothing, Insulation Material, Others
By End Use Construction, Power & Utilities, Chemical & Processing, Mining, Others
Regions Covered North America, Latin America, Europe, East Asia, South Asia & Pacific, Eastern Europe, Western Europe, Middle East & Africa
Countries Covered United States, Canada, United Kingdom, Germany, France, China, Japan, South Korea, Brazil, Australia
Key Players Jiangsu Shino New Materials Technology Co., Ltd., Jiangsu Aoshen Hi Material Co., Changchun Hipolyking Co., Ltd., Shandong Xingye Environmental Technology Corp., Changchun Hipolyking, and Baoding Sanyuan Textile Technology Co., Ltd.
Additional Attributes Dollar sales by value, market share analysis by region, and country-wise analysis.

Polyimide Fibers Market Segmentation

By Application:

  • Filter Media
  • Protective Clothing
  • Insulation Material
  • Others

By End Use:

  • Construction
  • Power & Utilities
  • Chemical & Processing
  • Mining
  • Others

By Region:

  • North America
  • Latin America
  • East Asia
  • South Asia & Pacific
  • Eastern Europe
  • Western Europe
  • Middle East & Africa

Table of Content

  1. Executive Summary
    • Global Market Outlook
    • Demand-side Trends
    • Supply-side Trends
    • Technology Roadmap Analysis
    • Analysis and Recommendations
  2. Market Overview
    • Market Coverage / Taxonomy
    • Market Definition / Scope / Limitations
  3. Market Background
    • Market Dynamics
      • Drivers
      • Restraints
      • Opportunity
      • Trends
    • Scenario Forecast
      • Demand in Optimistic Scenario
      • Demand in Likely Scenario
      • Demand in Conservative Scenario
    • Opportunity Map Analysis
    • Product Life Cycle Analysis
    • Supply Chain Analysis
      • Supply Side Participants and their Roles
        • Producers
        • Mid-Level Participants (Traders/ Agents/ Brokers)
        • Wholesalers and Distributors
      • Value Added and Value Created at Node in the Supply Chain
      • List of Raw Material Suppliers
      • List of Existing and Potential Buyer’s
    • Investment Feasibility Matrix
    • Value Chain Analysis
      • Profit Margin Analysis
      • Wholesalers and Distributors
      • Retailers
    • PESTLE and Porter’s Analysis
    • Regulatory Landscape
      • By Key Regions
      • By Key Countries
    • Regional Parent Market Outlook
    • Production and Consumption Statistics
    • Import and Export Statistics
  4. Global Market Analysis 2020 to 2024 and Forecast, 2025 to 2035
    • Historical Market Size Value (USD Million) & Volume (Kilotons) Analysis, 2020 to 2024
    • Current and Future Market Size Value (USD Million) & Volume (Kilotons) Projections, 2025 to 2035
      • Y-o-Y Growth Trend Analysis
      • Absolute $ Opportunity Analysis
  5. Global Market Pricing Analysis 2020 to 2024 and Forecast 2025 to 2035
  6. Global Market Analysis 2020 to 2024 and Forecast 2025 to 2035, By Application
    • Introduction / Key Findings
    • Historical Market Size Value (USD Million) & Volume (Kilotons) Analysis By Application, 2020 to 2024
    • Current and Future Market Size Value (USD Million) & Volume (Kilotons) Analysis and Forecast By Application, 2025 to 2035
      • Filter Media
      • Protective Clothing
      • Insulation Material
      • Others
        • Fiber-reinforced Composites
        • Electrical Wrapping
        • Structural Laminates
        • Advanced Sealing Fabrics
    • Y-o-Y Growth Trend Analysis By Application, 2020 to 2024
    • Absolute $ Opportunity Analysis By Application, 2025 to 2035
  7. Global Market Analysis 2020 to 2024 and Forecast 2025 to 2035, By End Use
    • Introduction / Key Findings
    • Historical Market Size Value (USD Million) & Volume (Kilotons) Analysis By End Use, 2020 to 2024
    • Current and Future Market Size Value (USD Million) & Volume (Kilotons) Analysis and Forecast By End Use, 2025 to 2035
      • Construction
      • Power & Utilities
      • Chemical & Processing
      • Mining
      • Others
        • Aerospace
        • Defense
        • Transportation
        • Electronics Manufacturing
    • Y-o-Y Growth Trend Analysis By End Use, 2020 to 2024
    • Absolute $ Opportunity Analysis By End Use, 2025 to 2035
  8. Global Market Analysis 2020 to 2024 and Forecast 2025 to 2035, By Region
    • Introduction
    • Historical Market Size Value (USD Million) & Volume (Kilotons) Analysis By Region, 2020 to 2024
    • Current Market Size Value (USD Million) & Volume (Kilotons) Analysis and Forecast By Region, 2025 to 2035
      • North America
      • Latin America
      • Western Europe
      • Eastern Europe
      • East Asia
      • South Asia & Pacific
      • Middle East and Africa
    • Market Attractiveness Analysis By Region
  9. North America Market Analysis 2020 to 2024 and Forecast 2025 to 2035, By Country
    • Historical Market Size Value (USD Million) & Volume (Kilotons) Trend Analysis By Market Taxonomy, 2020 to 2024
    • Market Size Value (USD Million) & Volume (Kilotons) Forecast By Market Taxonomy, 2025 to 2035
      • By Country
        • USA
        • Canada
        • Mexico
      • By Application
      • By End Use
    • Market Attractiveness Analysis
      • By Country
      • By Application
      • By End Use
    • Key Takeaways
  10. Latin America Market Analysis 2020 to 2024 and Forecast 2025 to 2035, By Country
    • Historical Market Size Value (USD Million) & Volume (Kilotons) Trend Analysis By Market Taxonomy, 2020 to 2024
    • Market Size Value (USD Million) & Volume (Kilotons) Forecast By Market Taxonomy, 2025 to 2035
      • By Country
        • Brazil
        • Argentina
        • Rest of LATAM
      • By Application
      • By End Use
    • Market Attractiveness Analysis
      • By Country
      • By Application
      • By End Use
    • Key Takeaways
  11. Western Europe Market Analysis 2020 to 2024 and Forecast 2025 to 2035, By Country
    • Historical Market Size Value (USD Million) & Volume (Kilotons) Trend Analysis By Market Taxonomy, 2020 to 2024
    • Market Size Value (USD Million) & Volume (Kilotons) Forecast By Market Taxonomy, 2025 to 2035
      • By Country
        • Germany
        • Italy
        • France
        • UK
        • Spain
        • BENELUX
        • Nordic
        • Rest of W.Europe
      • By Application
      • By End Use
    • Market Attractiveness Analysis
      • By Country
      • By Application
      • By End Use
    • Key Takeaways
  12. Eastern Europe Market Analysis 2020 to 2024 and Forecast 2025 to 2035, By Country
    • Historical Market Size Value (USD Million) & Volume (Kilotons) Trend Analysis By Market Taxonomy, 2020 to 2024
    • Market Size Value (USD Million) & Volume (Kilotons) Forecast By Market Taxonomy, 2025 to 2035
      • By Country
        • Russia
        • Hungary
        • Poland
        • Balkan & Baltics
        • Rest of E. Europe
      • By Application
      • By End Use
    • Market Attractiveness Analysis
      • By Country
      • By Application
      • By End Use
    • Key Takeaways
  13. East Asia Market Analysis 2020 to 2024 and Forecast 2025 to 2035, By Country
    • Historical Market Size Value (USD Million) & Volume (Kilotons) Trend Analysis By Market Taxonomy, 2020 to 2024
    • Market Size Value (USD Million) & Volume (Kilotons) Forecast By Market Taxonomy, 2025 to 2035
      • By Country
        • China
        • Japan
        • South Korea
      • By Application
      • By End Use
    • Market Attractiveness Analysis
      • By Country
      • By Application
      • By End Use
    • Key Takeaways
  14. South Asia & Pacific Market Analysis 2020 to 2024 and Forecast 2025 to 2035, By Country
    • Historical Market Size Value (USD Million) & Volume (Kilotons) Trend Analysis By Market Taxonomy, 2020 to 2024
    • Market Size Value (USD Million) & Volume (Kilotons) Forecast By Market Taxonomy, 2025 to 2035
      • By Country
        • India
        • Australia & New Zealand
        • ASEAN
        • Rest of SAP
      • By Application
      • By End Use
    • Market Attractiveness Analysis
      • By Country
      • By Application
      • By End Use
    • Key Takeaways
  15. Middle East and Africa Market Analysis 2020 to 2024 and Forecast 2025 to 2035, By Country
    • Historical Market Size Value (USD Million) & Volume (Kilotons) Trend Analysis By Market Taxonomy, 2020 to 2024
    • Market Size Value (USD Million) & Volume (Kilotons) Forecast By Market Taxonomy, 2025 to 2035
      • By Country
        • GCC Countries
        • Northern Africa
        • South Africa
        • Turkiye
        • Rest of MEA
      • By Application
      • By End Use
    • Market Attractiveness Analysis
      • By Country
      • By Application
      • By End Use
    • Key Takeaways
  16. Key Countries Market Analysis
    • USA
      • Pricing Analysis
      • Market Share Analysis, 2024
        • By Application
        • By End Use
    • Canada
      • Pricing Analysis
      • Market Share Analysis, 2024
        • By Application
        • By End Use
    • Brazil
      • Pricing Analysis
      • Market Share Analysis, 2024
        • By Application
        • By End Use
    • Mexico
      • Pricing Analysis
      • Market Share Analysis, 2024
        • By Application
        • By End Use
    • Argentina
      • Pricing Analysis
      • Market Share Analysis, 2024
        • By Application
        • By End Use
  17. Market Structure Analysis
    • Competition Dashboard
    • Competition Benchmarking
    • Market Share Analysis of Top Players
      • By Regional
      • By Application
      • By End Use
  18. Competition Analysis
    • Competition Deep Dive
      • Jiangsu Shino New Materials Technology Co., Ltd.
        • Overview
        • Product Portfolio
        • Profitability by Market Segments (Product/Age /Sales Channel/Region)
        • Sales Footprint
        • Strategy Overview
          • Marketing Strategy
          • Product Strategy
          • Channel Strategy
      • Jiangsu Aoshen Hi Material Co.
        • Overview
        • Product Portfolio
        • Profitability by Market Segments (Product/Age /Sales Channel/Region)
        • Sales Footprint
        • Strategy Overview
          • Marketing Strategy
          • Product Strategy
          • Channel Strategy
      • Changchun Hipolyking Co., Ltd.
        • Overview
        • Product Portfolio
        • Profitability by Market Segments (Product/Age /Sales Channel/Region)
        • Sales Footprint
        • Strategy Overview
          • Marketing Strategy
          • Product Strategy
          • Channel Strategy
      • Ningbo Yide Fine Chemical Co., Ltd.
        • Overview
        • Product Portfolio
        • Profitability by Market Segments (Product/Age /Sales Channel/Region)
        • Sales Footprint
        • Strategy Overview
          • Marketing Strategy
          • Product Strategy
          • Channel Strategy
      • Lirsot Ltd.
        • Overview
        • Product Portfolio
        • Profitability by Market Segments (Product/Age /Sales Channel/Region)
        • Sales Footprint
        • Strategy Overview
          • Marketing Strategy
          • Product Strategy
          • Channel Strategy
      • Swicofil
        • Overview
        • Product Portfolio
        • Profitability by Market Segments (Product/Age /Sales Channel/Region)
        • Sales Footprint
        • Strategy Overview
          • Marketing Strategy
          • Product Strategy
          • Channel Strategy
      • Shandong Xingye Environmental Technology Corp.
        • Overview
        • Product Portfolio
        • Profitability by Market Segments (Product/Age /Sales Channel/Region)
        • Sales Footprint
        • Strategy Overview
          • Marketing Strategy
          • Product Strategy
          • Channel Strategy
      • Jiangsu Jinqiao Salt International Trade Co. Ltd.
        • Overview
        • Product Portfolio
        • Profitability by Market Segments (Product/Age /Sales Channel/Region)
        • Sales Footprint
        • Strategy Overview
          • Marketing Strategy
          • Product Strategy
          • Channel Strategy
      • Baoding Sanyuan Textile Technology Co. Ltd.
        • Overview
        • Product Portfolio
        • Profitability by Market Segments (Product/Age /Sales Channel/Region)
        • Sales Footprint
        • Strategy Overview
          • Marketing Strategy
          • Product Strategy
          • Channel Strategy
      • Shanghai Easun Group Imp & Exp Co., Ltd.
        • Overview
        • Product Portfolio
        • Profitability by Market Segments (Product/Age /Sales Channel/Region)
        • Sales Footprint
        • Strategy Overview
          • Marketing Strategy
          • Product Strategy
          • Channel Strategy
  19. Assumptions & Acronyms Used
  20. Research Methodology

List of Tables

  • Table 1: Global Market Value (USD Million) Forecast by Region, 2020-2035
  • Table 2: Global Market Volume (Kilotons) Forecast by Region, 2020-2035
  • Table 3: Global Market Value (USD Million) Forecast by Application, 2020-2035
  • Table 4: Global Market Volume (Kilotons) Forecast by Application, 2020-2035
  • Table 5: Global Market Value (USD Million) Forecast by End Use, 2020-2035
  • Table 6: Global Market Volume (Kilotons) Forecast by End Use, 2020-2035
  • Table 7: North America Market Value (USD Million) Forecast by Country, 2020-2035
  • Table 8: North America Market Volume (Kilotons) Forecast by Country, 2020-2035
  • Table 9: North America Market Value (USD Million) Forecast by Application, 2020-2035
  • Table 10: North America Market Volume (Kilotons) Forecast by Application, 2020-2035
  • Table 11: North America Market Value (USD Million) Forecast by End Use, 2020-2035
  • Table 12: North America Market Volume (Kilotons) Forecast by End Use, 2020-2035
  • Table 13: Latin America Market Value (USD Million) Forecast by Country, 2020-2035
  • Table 14: Latin America Market Volume (Kilotons) Forecast by Country, 2020-2035
  • Table 15: Latin America Market Value (USD Million) Forecast by Application, 2020-2035
  • Table 16: Latin America Market Volume (Kilotons) Forecast by Application, 2020-2035
  • Table 17: Latin America Market Value (USD Million) Forecast by End Use, 2020-2035
  • Table 18: Latin America Market Volume (Kilotons) Forecast by End Use, 2020-2035
  • Table 19: Western Europe Market Value (USD Million) Forecast by Country, 2020-2035
  • Table 20: Western Europe Market Volume (Kilotons) Forecast by Country, 2020-2035
  • Table 21: Western Europe Market Value (USD Million) Forecast by Application, 2020-2035
  • Table 22: Western Europe Market Volume (Kilotons) Forecast by Application, 2020-2035
  • Table 23: Western Europe Market Value (USD Million) Forecast by End Use, 2020-2035
  • Table 24: Western Europe Market Volume (Kilotons) Forecast by End Use, 2020-2035
  • Table 25: Eastern Europe Market Value (USD Million) Forecast by Country, 2020-2035
  • Table 26: Eastern Europe Market Volume (Kilotons) Forecast by Country, 2020-2035
  • Table 27: Eastern Europe Market Value (USD Million) Forecast by Application, 2020-2035
  • Table 28: Eastern Europe Market Volume (Kilotons) Forecast by Application, 2020-2035
  • Table 29: Eastern Europe Market Value (USD Million) Forecast by End Use, 2020-2035
  • Table 30: Eastern Europe Market Volume (Kilotons) Forecast by End Use, 2020-2035
  • Table 31: East Asia Market Value (USD Million) Forecast by Country, 2020-2035
  • Table 32: East Asia Market Volume (Kilotons) Forecast by Country, 2020-2035
  • Table 33: East Asia Market Value (USD Million) Forecast by Application, 2020-2035
  • Table 34: East Asia Market Volume (Kilotons) Forecast by Application, 2020-2035
  • Table 35: East Asia Market Value (USD Million) Forecast by End Use, 2020-2035
  • Table 36: East Asia Market Volume (Kilotons) Forecast by End Use, 2020-2035
  • Table 37: South Asia & Pacific Market Value (USD Million) Forecast by Country, 2020-2035
  • Table 38: South Asia & Pacific Market Volume (Kilotons) Forecast by Country, 2020-2035
  • Table 39: South Asia & Pacific Market Value (USD Million) Forecast by Application, 2020-2035
  • Table 40: South Asia & Pacific Market Volume (Kilotons) Forecast by Application, 2020-2035
  • Table 41: South Asia & Pacific Market Value (USD Million) Forecast by End Use, 2020-2035
  • Table 42: South Asia & Pacific Market Volume (Kilotons) Forecast by End Use, 2020-2035
  • Table 43: Middle East and Africa Market Value (USD Million) Forecast by Country, 2020-2035
  • Table 44: Middle East and Africa Market Volume (Kilotons) Forecast by Country, 2020-2035
  • Table 45: Middle East and Africa Market Value (USD Million) Forecast by Application, 2020-2035
  • Table 46: Middle East and Africa Market Volume (Kilotons) Forecast by Application, 2020-2035
  • Table 47: Middle East and Africa Market Value (USD Million) Forecast by End Use, 2020-2035
  • Table 48: Middle East and Africa Market Volume (Kilotons) Forecast by End Use, 2020-2035

List of Figures

  • Figure 1: Global Market Volume (kilotons) Forecast 2020-2035
  • Figure 2: Global Market Pricing Analysis
  • Figure 3: Global Market Value (USD Million) Forecast 2020-2035
  • Figure 4: Global Market Value Share and BPS Analysis by Application, 2025 and 2035
  • Figure 5: Global Market Y-o-Y Growth Comparison by Application, 2025-2035
  • Figure 6: Global Market Attractiveness Analysis by Application
  • Figure 7: Global Market Value Share and BPS Analysis by End Use, 2025 and 2035
  • Figure 8: Global Market Y-o-Y Growth Comparison by End Use, 2025-2035
  • Figure 9: Global Market Attractiveness Analysis by End Use
  • Figure 10: Global Market Value (USD Million) Share and BPS Analysis by Region, 2025 and 2035
  • Figure 11: Global Market Y-o-Y Growth Comparison by Region, 2025-2035
  • Figure 12: Global Market Attractiveness Analysis by Region
  • Figure 13: North America Market Incremental $ Opportunity, 2025-2035
  • Figure 14: Latin America Market Incremental $ Opportunity, 2025-2035
  • Figure 15: Western Europe Market Incremental $ Opportunity, 2025-2035
  • Figure 16: Eastern Europe Market Incremental $ Opportunity, 2025-2035
  • Figure 17: East Asia Market Incremental $ Opportunity, 2025-2035
  • Figure 18: South Asia & Pacific Market Incremental $ Opportunity, 2025-2035
  • Figure 19: Middle East and Africa Market Incremental $ Opportunity, 2025-2035
  • Figure 20: North America Market Value Share and BPS Analysis by Country, 2025 and 2035
  • Figure 21: North America Market Value Share and BPS Analysis by Application, 2025 and 2035
  • Figure 22: North America Market Y-o-Y Growth Comparison by Application, 2025-2035
  • Figure 23: North America Market Attractiveness Analysis by Application
  • Figure 24: North America Market Value Share and BPS Analysis by End Use, 2025 and 2035
  • Figure 25: North America Market Y-o-Y Growth Comparison by End Use, 2025-2035
  • Figure 26: North America Market Attractiveness Analysis by End Use
  • Figure 27: Latin America Market Value Share and BPS Analysis by Country, 2025 and 2035
  • Figure 28: Latin America Market Value Share and BPS Analysis by Application, 2025 and 2035
  • Figure 29: Latin America Market Y-o-Y Growth Comparison by Application, 2025-2035
  • Figure 30: Latin America Market Attractiveness Analysis by Application
  • Figure 31: Latin America Market Value Share and BPS Analysis by End Use, 2025 and 2035
  • Figure 32: Latin America Market Y-o-Y Growth Comparison by End Use, 2025-2035
  • Figure 33: Latin America Market Attractiveness Analysis by End Use
  • Figure 34: Western Europe Market Value Share and BPS Analysis by Country, 2025 and 2035
  • Figure 35: Western Europe Market Value Share and BPS Analysis by Application, 2025 and 2035
  • Figure 36: Western Europe Market Y-o-Y Growth Comparison by Application, 2025-2035
  • Figure 37: Western Europe Market Attractiveness Analysis by Application
  • Figure 38: Western Europe Market Value Share and BPS Analysis by End Use, 2025 and 2035
  • Figure 39: Western Europe Market Y-o-Y Growth Comparison by End Use, 2025-2035
  • Figure 40: Western Europe Market Attractiveness Analysis by End Use
  • Figure 41: Eastern Europe Market Value Share and BPS Analysis by Country, 2025 and 2035
  • Figure 42: Eastern Europe Market Value Share and BPS Analysis by Application, 2025 and 2035
  • Figure 43: Eastern Europe Market Y-o-Y Growth Comparison by Application, 2025-2035
  • Figure 44: Eastern Europe Market Attractiveness Analysis by Application
  • Figure 45: Eastern Europe Market Value Share and BPS Analysis by End Use, 2025 and 2035
  • Figure 46: Eastern Europe Market Y-o-Y Growth Comparison by End Use, 2025-2035
  • Figure 47: Eastern Europe Market Attractiveness Analysis by End Use
  • Figure 48: East Asia Market Value Share and BPS Analysis by Country, 2025 and 2035
  • Figure 49: East Asia Market Value Share and BPS Analysis by Application, 2025 and 2035
  • Figure 50: East Asia Market Y-o-Y Growth Comparison by Application, 2025-2035
  • Figure 51: East Asia Market Attractiveness Analysis by Application
  • Figure 52: East Asia Market Value Share and BPS Analysis by End Use, 2025 and 2035
  • Figure 53: East Asia Market Y-o-Y Growth Comparison by End Use, 2025-2035
  • Figure 54: East Asia Market Attractiveness Analysis by End Use
  • Figure 55: South Asia & Pacific Market Value Share and BPS Analysis by Country, 2025 and 2035
  • Figure 56: South Asia & Pacific Market Value Share and BPS Analysis by Application, 2025 and 2035
  • Figure 57: South Asia & Pacific Market Y-o-Y Growth Comparison by Application, 2025-2035
  • Figure 58: South Asia & Pacific Market Attractiveness Analysis by Application
  • Figure 59: South Asia & Pacific Market Value Share and BPS Analysis by End Use, 2025 and 2035
  • Figure 60: South Asia & Pacific Market Y-o-Y Growth Comparison by End Use, 2025-2035
  • Figure 61: South Asia & Pacific Market Attractiveness Analysis by End Use
  • Figure 62: Middle East and Africa Market Value Share and BPS Analysis by Country, 2025 and 2035
  • Figure 63: Middle East and Africa Market Value Share and BPS Analysis by Application, 2025 and 2035
  • Figure 64: Middle East and Africa Market Y-o-Y Growth Comparison by Application, 2025-2035
  • Figure 65: Middle East and Africa Market Attractiveness Analysis by Application
  • Figure 66: Middle East and Africa Market Value Share and BPS Analysis by End Use, 2025 and 2035
  • Figure 67: Middle East and Africa Market Y-o-Y Growth Comparison by End Use, 2025-2035
  • Figure 68: Middle East and Africa Market Attractiveness Analysis by End Use
  • Figure 69: Global Market - Tier Structure Analysis
  • Figure 70: Global Market - Company Share Analysis

Frequently Asked Questions

What is the size of the polyimide fibers market in 2025?

The market is valued at USD 574.8 million in 2025.

What is the outlook on polyimide fiber demand by 2035?

By 2035, the market is projected to reach USD 954.4 million.

At what CAGR is the polyimide fibers market expected to grow during 2025 to 2035?

The market is expected to grow at a CAGR of 5.2% from 2025 to 2035.

Which country is the fastest-growing in the polyimide fibers market?

Japan is expected to grow the fastest, with a CAGR of 5.4%.

Which application segment dominates the polyimide fibers market?

Filter media leads with an estimated 38% share in 2025.

Explore Similar Insights

Future Market Insights

Polyimide Fibers Market