The polyimide film and tape market is witnessing consistent expansion, driven by the rising demand for high-performance materials in electronics, automotive, and aerospace applications. These materials are valued for their exceptional thermal stability, dielectric strength, and chemical resistance, enabling superior performance in high-temperature and high-voltage environments.
Growing adoption in flexible printed circuits, insulation layers, and high-frequency communication devices has reinforced market relevance. Rapid miniaturization in consumer electronics and the proliferation of 5G technology have further stimulated demand for polyimide-based substrates.
The current market environment is marked by technological innovation and capacity expansion by key producers to cater to increasing electronic component consumption in Asia-Pacific. With advancements in lightweight materials and sustainability-focused product development, the market outlook remains positive, supported by stable demand from critical industries requiring durable and reliable film solutions..
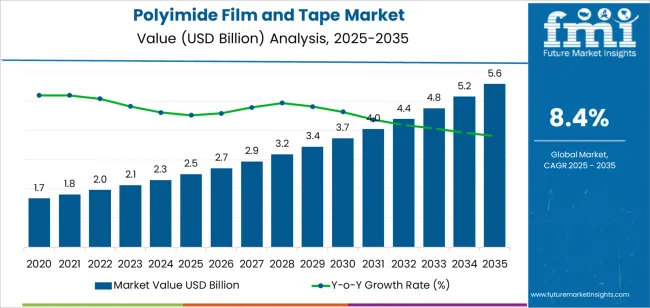
| Metric | Value |
|---|---|
| Polyimide Film and Tape Market Estimated Value in (2025 E) | USD 2.5 billion |
| Polyimide Film and Tape Market Forecast Value in (2035 F) | USD 5.6 billion |
| Forecast CAGR (2025 to 2035) | 8.4% |
The market is segmented by Type and End Use Industry and region. By Type, the market is divided into Flexible Printed Circuits, Specialty Fabricated Products, Pressure Sensitive Tapes, Wires & Cables, and Others. In terms of End Use Industry, the market is classified into Electronics, Automotive, Aerospace, Labeling, and Others. Regionally, the market is classified into North America, Latin America, Western Europe, Eastern Europe, Balkan & Baltic Countries, Russia & Belarus, Central Asia, East Asia, South Asia & Pacific, and the Middle East & Africa.
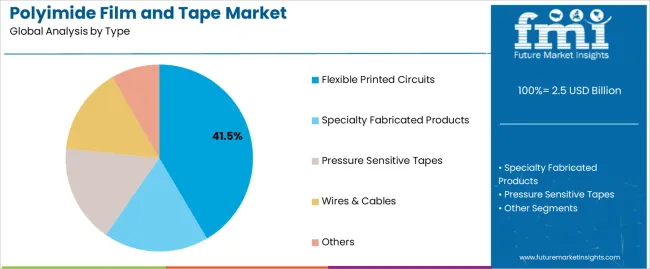
The flexible printed circuits segment leads the type category, accounting for approximately 41.5% share of the polyimide film and tape market. This dominance is attributed to the material’s ability to maintain mechanical integrity under flexing and thermal stress, making it essential for modern electronic assemblies.
Polyimide-based circuits are extensively utilized in smartphones, wearable devices, automotive sensors, and aerospace electronics due to their lightweight and space-saving characteristics. The segment’s growth is further supported by the shift toward flexible and foldable consumer electronics, where high flexibility and reliability are paramount.
Continuous technological advancements in etching and lamination processes have enhanced production efficiency, further strengthening segment adoption. As demand for compact, high-performance electronic components continues to rise, flexible printed circuits are expected to remain a core growth driver in the polyimide film and tape market..
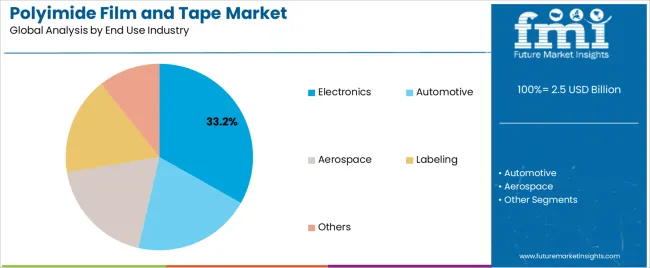
The electronics segment dominates the end-use industry category with approximately 33.2% share, reflecting its significant consumption of polyimide films and tapes in insulation, circuit boards, and protective applications. The segment’s leadership is reinforced by rapid innovation in consumer and industrial electronics, particularly in displays, sensors, and semiconductor manufacturing.
Polyimide materials are integral to ensuring device reliability under high heat and voltage conditions. Expansion of electric vehicle electronics and advanced driver-assistance systems has further elevated demand.
Additionally, increasing production of flexible displays and compact electronic components in Asia-Pacific manufacturing hubs continues to drive consumption. With continued miniaturization trends and emphasis on thermal management, the electronics segment is projected to sustain its leading position in the years ahead..
Rising Demand for Specialized Materials for Space Exploration Creates Opportunities in the Market
The booming space exploration sector offers a unique opportunity for enterprises to pioneer new polyimide coatings that can resist the harsh conditions of space. Companies that develop flexible circuit materials with improved thermal stability, endurance, and radiation resistance are positioned to contribute significantly to space technology breakthroughs.
Businesses that carve out a position in the space sector can acquire high-value contracts, build strategic relationships with aerospace stakeholders, and benefit from the expanding need for flexible substrate materials that can withstand the rigors of space applications.
For instance, the ultra-thin Kapton polyimide sheets, manufactured by DuPont technology, are the key component that shields the James Web Space Telescope (JWST) from solar heat and light so that it can operate as intended in orbit. The JWST is worth USD 10 billion and is the largest space telescope built.
Emergence of Flexible Electronics Boosts Innovation in the Market
The introduction of flexible electronics offers new opportunities for innovation across various sectors. It signifies a paradigm change in product design and production. Because polyimide films are lightweight, flexible, and durable, they are essential for creating flexible electronic devices, such as wearables, sensors, and displays.
The demand for polyimide films is expected to rise as companies investigate new uses for flexible electronics, motivated by consumer desire for wearable and smart gadgets. Companies can satisfy the demands of emerging markets, create new income streams, and keep a competitive advantage in the fast-paced electronics sector by investing in flexible electronics research and development.
The market for electric vehicles (EVs) displays tremendous potential due to the worldwide trend towards sustainable transportation options. Since polyimide adhesive tapes are lightweight and have excellent thermal stability, they are essential to producing electric vehicles (EVs) and are used in battery systems, thermal management, and electronic components.
Electric vehicles (EVs) demand is rising as governments impose harsher pollution rules and customers adopt eco-friendly alternatives. Automotive manufacturers can fulfill the growing demand for electric mobility solutions, improve vehicle performance, and expand their market reach by integrating polyimide sheets into their EV design and production processes. This can additionally result in increased revenue growth.
| Attribute | Details |
|---|---|
| Trends |
|
| Opportunities |
|
| Challenges |
|
| Segment | Flexible Printed Circuits (Application) |
|---|---|
| Value CAGR (2025 to 2035) | 8.2% |
Based on application, flexible printed circuits segment is anticipated to rise at an 8.2% CAGR through 2035.
| Segment | Electronics (End-use Industry) |
|---|---|
| Value CAGR (2025 to 2035) | 8.0% |
Based on end-user, the electronics segment is projected to thrive at an 8.0% CAGR through 2035.
| Countries | Value CAGR (2025 to 2035) |
|---|---|
| United States | 8.7% |
| United Kingdom | 9.5% |
| China | 8.9% |
| Japan | 9.4% |
| South Korea | 10.2% |
The demand for polyimide films and tapes in the United States is projected to rise at an 8.7% CAGR through 2035.
The sales of polyimide films and tapes in the United Kingdom are anticipated to surge at a 9.5% CAGR through 2035.
The polyimide film and tape market growth in China is estimated at an 8.9% CAGR through 2035.
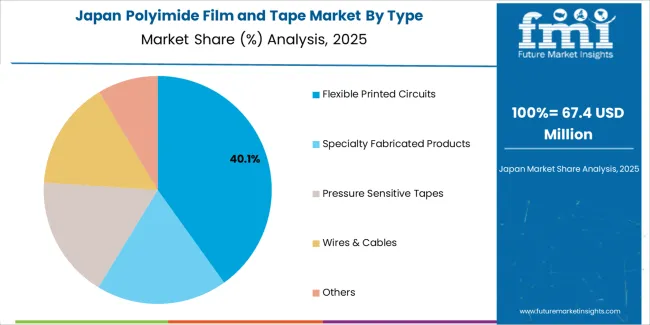
The demand for polyimide films and tapes in Japan is projected to surge at a 9.4% CAGR through 2035.
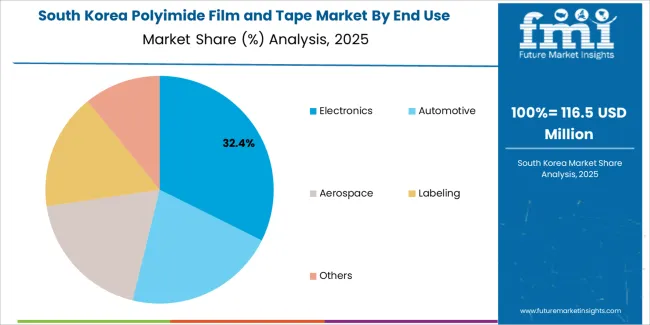
The sales of polyimide films and tapes in South Korea are expected to rise at a 10.2% CAGR through 2035.
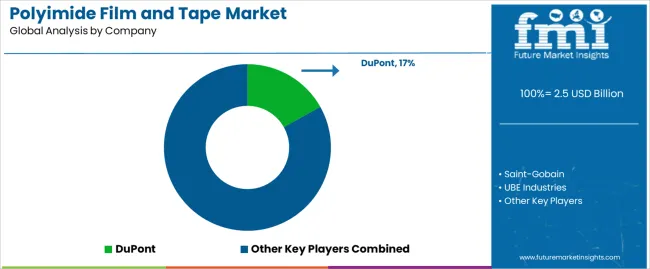
The polyimide film and tape market is highly competitive, with big global companies, specialist providers, and new entrants. Established industry titans like DuPont, Saint-Gobain, and UBE Industries hold significant market power due to vertically integrated operations, diverse product portfolios, and vast distribution networks.
These market leaders use economies of scale to serve various industrial sectors, including electronics, automotive, aerospace, and healthcare, reinforcing their status as significant revenue producers.
Recent Developments
The global polyimide film and tape market is estimated to be valued at USD 2.5 billion in 2025.
The market size for the polyimide film and tape market is projected to reach USD 5.6 billion by 2035.
The polyimide film and tape market is expected to grow at a 8.4% CAGR between 2025 and 2035.
The key product types in polyimide film and tape market are flexible printed circuits, specialty fabricated products, pressure sensitive tapes, wires & cables and others.
In terms of end use industry, electronics segment to command 33.2% share in the polyimide film and tape market in 2025.


Our Research Products

The "Full Research Suite" delivers actionable market intel, deep dives on markets or technologies, so clients act faster, cut risk, and unlock growth.

The Leaderboard benchmarks and ranks top vendors, classifying them as Established Leaders, Leading Challengers, or Disruptors & Challengers.

Locates where complements amplify value and substitutes erode it, forecasting net impact by horizon

We deliver granular, decision-grade intel: market sizing, 5-year forecasts, pricing, adoption, usage, revenue, and operational KPIs—plus competitor tracking, regulation, and value chains—across 60 countries broadly.

Spot the shifts before they hit your P&L. We track inflection points, adoption curves, pricing moves, and ecosystem plays to show where demand is heading, why it is changing, and what to do next across high-growth markets and disruptive tech

Real-time reads of user behavior. We track shifting priorities, perceptions of today’s and next-gen services, and provider experience, then pace how fast tech moves from trial to adoption, blending buyer, consumer, and channel inputs with social signals (#WhySwitch, #UX).

Partner with our analyst team to build a custom report designed around your business priorities. From analysing market trends to assessing competitors or crafting bespoke datasets, we tailor insights to your needs.
Supplier Intelligence
Discovery & Profiling
Capacity & Footprint
Performance & Risk
Compliance & Governance
Commercial Readiness
Who Supplies Whom
Scorecards & Shortlists
Playbooks & Docs
Category Intelligence
Definition & Scope
Demand & Use Cases
Cost Drivers
Market Structure
Supply Chain Map
Trade & Policy
Operating Norms
Deliverables
Buyer Intelligence
Account Basics
Spend & Scope
Procurement Model
Vendor Requirements
Terms & Policies
Entry Strategy
Pain Points & Triggers
Outputs
Pricing Analysis
Benchmarks
Trends
Should-Cost
Indexation
Landed Cost
Commercial Terms
Deliverables
Brand Analysis
Positioning & Value Prop
Share & Presence
Customer Evidence
Go-to-Market
Digital & Reputation
Compliance & Trust
KPIs & Gaps
Outputs
Full Research Suite comprises of:
Market outlook & trends analysis
Interviews & case studies
Strategic recommendations
Vendor profiles & capabilities analysis
5-year forecasts
8 regions and 60+ country-level data splits
Market segment data splits
12 months of continuous data updates
DELIVERED AS:
PDF EXCEL ONLINE
Filmic Tapes Market
Labels, Tapes And Films Market Size and Share Forecast Outlook 2025 to 2035
Protective Films Tapes Market
Colourless Polyimide Films Market
Double Coated Film Tapes Market Size and Share Forecast Outlook 2025 to 2035
Film and TV IP Peripherals Market Size and Share Forecast Outlook 2025 to 2035
Film Wrapped Wire Market Size and Share Forecast Outlook 2025 to 2035
Film-Insulated Wire Market Size and Share Forecast Outlook 2025 to 2035
Film Forming Starches Market Size and Share Forecast Outlook 2025 to 2035
Tape Unwinder Market Size and Share Forecast Outlook 2025 to 2035
Tape Dispenser Market Size and Share Forecast Outlook 2025 to 2035
Film Formers Market Size and Share Forecast Outlook 2025 to 2035
Tape Dispenser Industry Analysis in Japan Size and Share Forecast Outlook 2025 to 2035
Tape Dispenser Industry Analysis in Western Europe Size and Share Forecast Outlook 2025 to 2035
Tape Measure Market Size and Share Forecast Outlook 2025 to 2035
Polyimide Fibers Market Analysis - Size, Share, and Forecast Outlook 2025 to 2035
Tape Backing Materials Market Analysis by Material Type, Application, and Region through 2025 to 2035
Tape Stretching Line Market Analysis – Growth & Trends 2025 to 2035
Tapes Market Insights – Growth & Demand 2025 to 2035
Tape Banding Machine Market Overview - Demand & Growth Forecast 2025 to 2035

Thank you!
You will receive an email from our Business Development Manager. Please be sure to check your SPAM/JUNK folder too.
Chat With
MaRIA