This site uses cookies, including third-party cookies, that help us to provide and improve our services.

Privacy Policy
- Global Locations -
Headquarters
Future Market Insights, Inc.
Christiana Corporate, 200 Continental Drive, Suite 401, Newark, Delaware - 19713, United States
T: +1-845-579-5705
MEA
Market Access DMCC

1602-6 Jumeirah Bay X2 Tower, Plot No: JLT-PH2-X2A,

Jumeirah Lakes Towers, Dubai,

United Arab Emirates

Americas
Future Market Insights
616 Corporate Way, Suite 2-9018,
Valley Cottage, NY 10989,
United States
T: +1-347-918-3531
Europe
Future Market Insights
3rd Floor, 207 Regent Street,
London W1B 3HH
United Kingdom
T: + 44 (0) 20 8123 9659
D: +44 (0) 20 3287 4268
APAC
Future Market Insights
Office No. 401-A, 4th Floor,
VANTAGE 9, S.No. 36/1/1,
Baner, Pune 411045 India

Flexible Electronics Market

Market Insights on Flexible Electronics covering sales outlook, demand forecast & up-to-date key trends

Flexible Electronics Market by Circuit Structure, Application, Component & Region - Forecast 2022 - 2032

Flexible Electronics Market Overview (2022-2032)

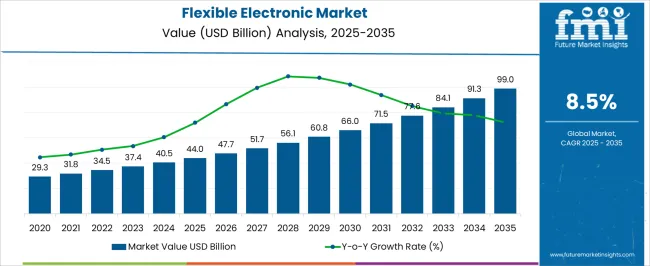
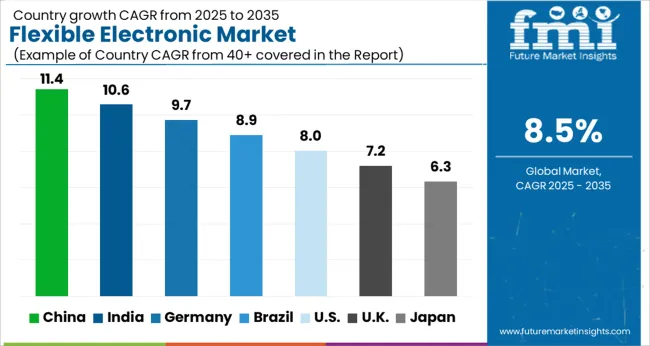
[250 Pages Report] The global flexible electronics market is growing at a modest pace to record a CAGR of 8.5% from 2022 to 2032.

Flexible electronics are the new class of electronics that are bendable, stretchable, and twistable that enables the manufacturing and enhancing of the capabilities and features of new digital products. The wide range of products on the market is both consumer-oriented and industrial.

The wider application goes from cellphone screens to security tags and sensor componentry in cars and airplanes. This advanced electronics technology is also used in agricultural and environmental sensors, strain gauges in bridges, escalators, etc.

The meaning of flexibility differs with applications. From bending and rolling for easier handling of large area photovoltaics, to conforming onto irregular shapes, folding, twisting, stretching, and deforming are required for devices in electronic skin.

The material used in building this flexible technology is generally plastic but metal foil, flex glass, and metal foil are also used in some instances. Flexible electronics can be defined with the explanation of its components:

  • Flexible Hybrid Electronics (FHE):

FHE is nothing but printed flexible electronics combined with silicon-based integrated circuits on a conformable substrate. For instance, major elements in Si CMOS processes include microcontrollers, digital signal processes, RF Chips along with high-density memories.

  • Organic Electronics (OE):

OE is a unique circuit that deals with design, characterization, synthesis, and small organic molecules. Other than this the OE is also known as plastic electronics as it shows desirable electronic properties like conductivity. Its applications vary from cellphone touch to lift sensors, fueling the overall demand for flexible electronics in new regions.

  • Printed Electronics (PE)

Products like gravure, inkjet, screen, and flexography use printed electronics. Even the biometric system uses flexible technology. Functional electronics are fabricated by laying conductive lines and applying several printing options. Often confused with printed circuit boards, which also often use printing methods to connect discrete active and passive components.

The lightweight and malleable flexible electronics are anticipated to be the game changer in the world of technology. Now let’s look at witch what factors helps any integrated technology and reshapes it:

  • Affordable

Though any new invention or cutting-edge technology comes with a high-end cost but due to the higher mainstream use of flexible electronics, the vendor companies have limited the cost of these Fes circuits. For instance, the prominent US university of North Carolina has discovered that the use of flexible electronics fuel reduces cost while enhancing performance.

  • Customizable

The flexible circuit technology is flexible in its application course too, managing a mix of systems with sensors and displays. For instance, products like smart bands rely on flexible electronics in their displays. In a smart band, you have a mix of systems, sensors, and displays that track and communicate data to users.

These devices deliver vital information such as steps, and calories consumed and burnt. Flex electronics technology only makes it possible for the smartwatches to operate around your wrist.

The research report on the flexible electronics market suggests that the modern-age flexible electronics open gates for a wide range of applications such as flexible lighting, display technology, and sensory identification. The market has grabbed industries such as consumer electronics, textiles, and wearables with sensors, and architecture. Its application in healthcare is important as it delivers services like medical imaging and diagnostics.

The flexible electronic technology work not only through conventional method but majorly focuses on expanding the mechanical features to adhere to novel factors through hybrid strategies. These hybrid strategies involve the amalgam of flexible and conventional electronics.

Now the most recent AI-based robotics technology has also started adopting flexible electronics to add the human touch to the robots. This fuels the sales of flexible electronics while advancing multiple sectors.

“As consumer devices are turning more compact, retaining their smarter and more integrated functioning, the demand for flex circuits is anticipated to escalate”.

In addition to offering transformational advantages in terms of product shape, weight, and durability, flex circuits also provide 3D configurations to product designs. Flex circuits have also had a significant impact on allied industries, including wearable electronics, smart medical devices, cell phones, connectors, and IoT.

Attributes

Details

Flexible Electronics Market CAGR (2022-2032)

8.5%

Flexible Electronics Market Size (2032)

US$ 79.1 Bn

Customize this Report

Let us know your requirement to get
100% FREE customization

What Contributes to the Growth of the Flexible Electronics Market?

“The market is expected to grow due to the superiority of compact, flexible devices, as well as the preference for light weight, portable devices and higher energy efficiency”.

Preference for portable devices those are light and flexible are growing, which is primarily contributing to the growth of the flexible electronics market. For the convenience of portability, consumers increasingly prefer light weight devices over conventional ones.

Flexible electronics are made of Kapton or similar materials, which can support more than 70% of their weight and provide a great deal of flexibility. Flex circuits are printed on ultra-thin substrates, such as plastic, which impart them the foldable, rollable, and bendable characteristics without affecting the functionality.

Devices based on the flexible electronics technology consume lesser energy compared to conventional electronics devices, and generate lesser heat while being used. This property is crucial in popularizing flex circuits in the market.

Consumers are increasingly using devices such as smart phones, smart glasses, smart watches, and e-books or newspapers, which is propelling the demand for flexible electronics.

Which Factors are Bringing Major Opportunities to the Flexible Electronics Market?

“Research has indicated that semiconductors and electronics are highly suitable for the development of waterproof and durability devices.”

Flex circuits have been serving novel applications in the medical and healthcare sector since the past few years. Flexible organic electronics can be used in organ implants in the near future, owing to their high compatibility with major biological systems.

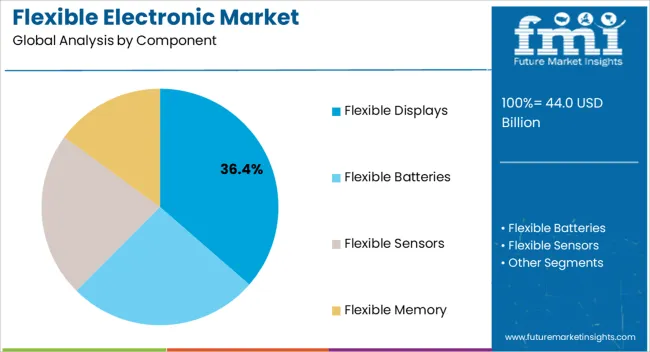
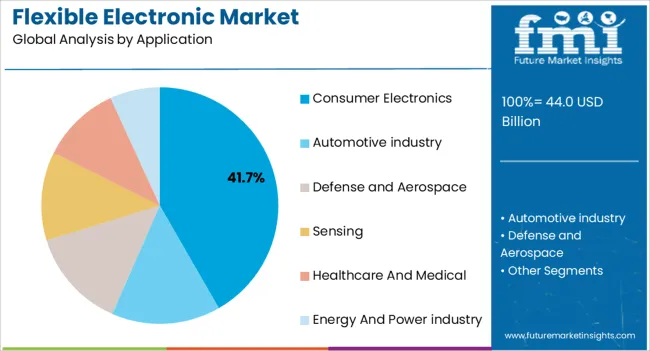
The market on the basis of components is segmented into flexible electronics and displays, flexible batteries, flexible sensors, and flexible memory. On the basis of application, the market is segmented into consumer electronics, automotive industry, defense and aerospace, sensing, healthcare and medical, energy and power industry.

Flexible electronics uses are broad with multiple applications. The applications of flexible electronics in manufacturing flexible, non-breakable, waterproof computing displays is expected to attract major revenue opportunities in the near future.

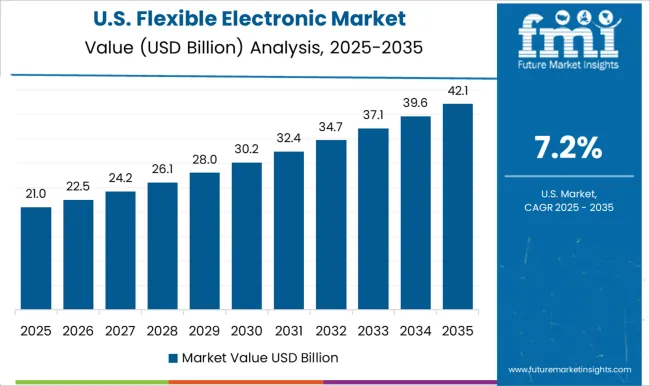
North America is currently a significant market for flex circuits, with the United States leading the way, followed by Canada and Mexico. However, Asia Pacific is a growing market for flexible electronics, with Singapore, Thailand, Malaysia, South Korea, Taiwan, Hong Kong, and the Philippines leading the way.

Sudip Saha
Sudip Saha
Principal Consultant
LinkedIn
Talk to Analyst

Find your sweet spots for generating winning opportunities in this market.

Talk to Analyst

What are the Key Flexible Electronics Market Trends?

“Investment and effective strategies have a major role in the development of the flexible electronics market”.

Apple and its iPhone screen supplier LG Electronics launched the arrival of a new, ultrathin, low-power iPhone with flexible OLED screen, somewhere between 2017 and 2018. However, LG has already launched a smart phone that can be bent to a certain degree - G Flex2, in 2015.

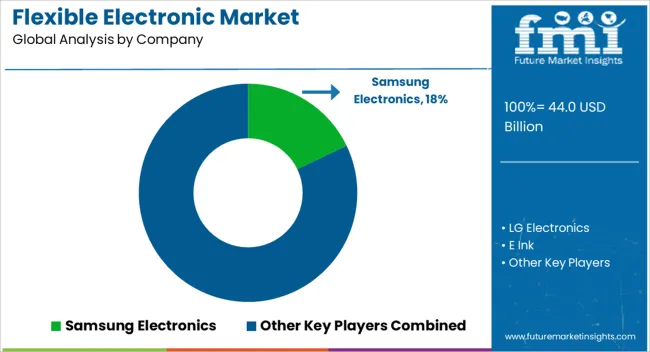
Recently in 2016, Samsung filed two patents with the United States Patent and Trademark Office (USPTO), for an ‘artificial muscle’ system, allowing smart phones to bend in a variety of shapes without getting damaged.

Companies are investing more in R&D to enhance their market positions, and FMI's market research predicts that as technology advances, the competitive landscape will see an influx of viable income generation options. Multiple functionalities, such as microphones, speakers, and batteries, can be incorporated into a single device using this technology.

Introduction of flexible electronics to new applications is projected to offer remunerative opportunities to the global market. Growth in printed electronics further accelerates the flexible electronics market growth, creating lucrative opportunities for various applications.

Key Segments

Attributes

Details

Forecast period

2022-2032

Historical data available for

2014-2020

Market Analysis

US$ Million for Value

By Component

  • Flexible displays
  • Flexible batteries
  • Flexible sensors
  • Flexible memory

By Application

  • Consumer Electronics
  • Automotive industry
  • Defense and Aerospace
  • Sensing
  • Healthcare and Medical
  • Energy and Power industry

By Circuit Structure

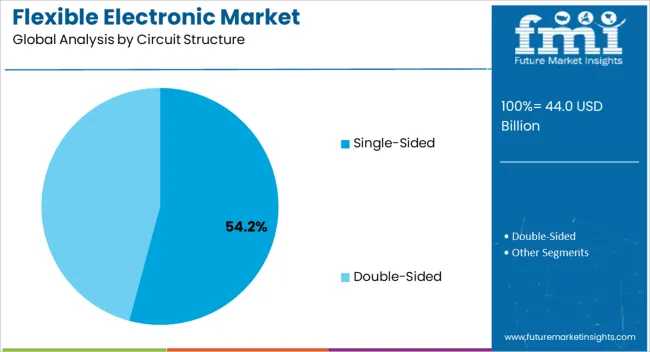
  • Single-sided
  • Double-sided

By Region

  • North America
  • Latin America
  • Japan
  • Asia-Pacific
  • Western Europe
  • Eastern Europe
  • Middle East & Africa

Key Players

MarketNage
Become a MarketNgage Insider

A unified Market Research Subscription Platform, built for today's disparate research needs.

Frequently Asked Questions

The market is likely to register a CAGR of 8.5% through 2032.

The market is likely to grow to a valuation of US$ 79.1 Bn by 2032.

North America is likely to be a leading market during the forecast period.

Table of Content

1. Executive Summary

    1.1. Global Market Outlook

    1.2. Demand-side Trends

    1.3. Supply-side Trends

    1.4. Technology Roadmap Analysis

    1.5. Analysis and Recommendations

2. Market Overview

    2.1. Market Coverage / Taxonomy

    2.2. Market Definition / Scope / Limitations

3. Market Background

    3.1. Market Dynamics

        3.1.1. Drivers

        3.1.2. Restraints

        3.1.3. Opportunity 

        3.1.4. Trends

    3.2. Scenario Forecast

        3.2.1. Demand in Optimistic Scenario

        3.2.2. Demand in Likely Scenario

        3.2.3. Demand in Conservative Scenario

    3.3. Opportunity Map Analysis

    3.4. Product Life Cycle Analysis

    3.5. Supply Chain Analysis

        3.5.1. Supply Side Participants and their Roles

            3.5.1.1. Producers

            3.5.1.2. Mid-Level Participants (Traders/ Agents/ Brokers)

            3.5.1.3. Wholesalers and Distributors

        3.5.2. Value Added and Value Created at Node in the Supply Chain

        3.5.3. List of Raw Material Suppliers

        3.5.4. List of Existing and Potential Buyer's

    3.6. Investment Feasibility Matrix

    3.7. Value Chain Analysis

        3.7.1. Profit Margin Analysis

        3.7.2. Wholesalers and Distributors

        3.7.3. Retailers

    3.8. PESTLE and Porter's Analysis

    3.9. Regulatory Landscape

        3.9.1. By Key Regions

        3.9.2. By Key Countries

    3.10. Regional Parent Market Outlook

    3.11. Production and Consumption Statistics

    3.12. Import and Export Statistics

4. Global Market Analysis 2017-2021 and Forecast, 2022-2032

    4.1. Historical Market Size Value (US$ Mn) & Volume (Units) Analysis, 2017-2021

    4.2. Current and Future Market Size Value (US$ Mn) & Volume (Units) Projections, 2022-2032

        4.2.1. Y-o-Y Growth Trend Analysis

        4.2.2. Absolute $ Opportunity Analysis

5. Global Market Analysis 2017-2021 and Forecast 2022-2032, By Circuit Structure 

    5.1. Introduction / Key Findings

    5.2. Historical Market Size Value (US$ Mn) & Volume (Units) Analysis By Circuit Structure , 2017-2021

    5.3. Current and Future Market Size Value (US$ Mn) & Volume (Units) Analysis and Forecast By Circuit Structure , 2022-2032

        5.3.1. Single-sided Flex Circuits 

        5.3.2. Double Access/back Bared Flex Circuits 

        5.3.3. Sculptured Flex Circuits

        5.3.4. Double-sided Flex Circuits 

        5.3.5. Multilayer Flex Circuits 

        5.3.6. Rigid-flex Circuits 

        5.3.7. Polymer Thick Film Flex Circuits 

    5.4. Y-o-Y Growth Trend Analysis By Circuit Structure , 2017-2021

    5.5. Absolute $ Opportunity Analysis By Circuit Structure , 2022-2032

Deep-dive segmentation will be available in the sample on request

6. Global Market Analysis 2017-2021 and Forecast 2022-2032, By Component

    6.1. Introduction / Key Findings

    6.2. Historical Market Size Value (US$ Mn) & Volume (Units) Analysis By Component, 2017-2021

    6.3. Current and Future Market Size Value (US$ Mn) & Volume (Units) Analysis and Forecast By Component, 2022-2032

        6.3.1. Displays

        6.3.2. Batteries 

        6.3.3. Sensors 

        6.3.4. Memory 

        6.3.5. Other Components 

    6.4. Y-o-Y Growth Trend Analysis By Component, 2017-2021

    6.5. Absolute $ Opportunity Analysis By Component, 2022-2032

Deep-dive segmentation will be available in the sample on request

7. Global Market Analysis 2017-2021 and Forecast 2022-2032, By Application

    7.1. Introduction / Key Findings

    7.2. Historical Market Size Value (US$ Mn) & Volume (Units) Analysis By Application, 2017-2021

    7.3. Current and Future Market Size Value (US$ Mn) & Volume (Units) Analysis and Forecast By Application, 2022-2032

        7.3.1. Consumer Electronics 

        7.3.2. Automotive Electronics 

        7.3.3. Biometrics

        7.3.4. Medical Devices 

        7.3.5. Industrial Electronics 

    7.4. Y-o-Y Growth Trend Analysis By Application, 2017-2021

    7.5. Absolute $ Opportunity Analysis By Application, 2022-2032

Deep-dive segmentation will be available in the sample on request

8. Global Market Analysis 2017-2021 and Forecast 2022-2032, By Region

    8.1. Introduction

    8.2. Historical Market Size Value (US$ Mn) & Volume (Units) Analysis By Region, 2017-2021

    8.3. Current Market Size Value (US$ Mn) & Volume (Units) Analysis and Forecast By Region, 2022-2032

        8.3.1. North America

        8.3.2. Latin America

        8.3.3. Europe

        8.3.4. East Asia

        8.3.5. South Asia & Pacific

        8.3.6. MEA

    8.4. Market Attractiveness Analysis By Region

9. North America Market Analysis 2017-2021 and Forecast 2022-2032, By Country

    9.1. Historical Market Size Value (US$ Mn) & Volume (Units) Trend Analysis By Market Taxonomy, 2017-2021

    9.2. Market Size Value (US$ Mn) & Volume (Units) Forecast By Market Taxonomy, 2022-2032

        9.2.1. By Country

            9.2.1.1. U.S.

            9.2.1.2. Canada

        9.2.2. By Circuit Structure 

        9.2.3. By Component

        9.2.4. By Application

    9.3. Market Attractiveness Analysis

        9.3.1. By Country

        9.3.2. By Circuit Structure 

        9.3.3. By Component

        9.3.4. By Application

    9.4. Key Takeaways

10. Latin America Market Analysis 2017-2021 and Forecast 2022-2032, By Country

    10.1. Historical Market Size Value (US$ Mn) & Volume (Units) Trend Analysis By Market Taxonomy, 2017-2021

    10.2. Market Size Value (US$ Mn) & Volume (Units) Forecast By Market Taxonomy, 2022-2032

        10.2.1. By Country

            10.2.1.1. Mexico

            10.2.1.2. Brazil

            10.2.1.3. Rest of Latin America

        10.2.2. By Circuit Structure 

        10.2.3. By Component

        10.2.4. By Application

    10.3. Market Attractiveness Analysis

        10.3.1. By Country

        10.3.2. By Circuit Structure 

        10.3.3. By Component

        10.3.4. By Application

    10.4. Key Takeaways

11. Europe Market Analysis 2017-2021 and Forecast 2022-2032, By Country

    11.1. Historical Market Size Value (US$ Mn) & Volume (Units) Trend Analysis By Market Taxonomy, 2017-2021

    11.2. Market Size Value (US$ Mn) & Volume (Units) Forecast By Market Taxonomy, 2022-2032

        11.2.1. By Country

            11.2.1.1. Germany

            11.2.1.2. Italy

            11.2.1.3. France

            11.2.1.4. U.K.

            11.2.1.5. Spain

            11.2.1.6. BENELUX

            11.2.1.7. Russia

            11.2.1.8. Rest of Europe

        11.2.2. By Circuit Structure 

        11.2.3. By Component

        11.2.4. By Application

    11.3. Market Attractiveness Analysis

        11.3.1. By Country

        11.3.2. By Circuit Structure 

        11.3.3. By Component

        11.3.4. By Application

    11.4. Key Takeaways

12. East Asia Market Analysis 2017-2021 and Forecast 2022-2032, By Country

    12.1. Historical Market Size Value (US$ Mn) & Volume (Units) Trend Analysis By Market Taxonomy, 2017-2021

    12.2. Market Size Value (US$ Mn) & Volume (Units) Forecast By Market Taxonomy, 2022-2032

        12.2.1. By Country

            12.2.1.1. China

            12.2.1.2. Japan

            12.2.1.3. South Korea

        12.2.2. By Circuit Structure 

        12.2.3. By Component

        12.2.4. By Application

    12.3. Market Attractiveness Analysis

        12.3.1. By Country

        12.3.2. By Circuit Structure 

        12.3.3. By Component

        12.3.4. By Application

    12.4. Key Takeaways

13. South Asia & Pacific Market Analysis 2017-2021 and Forecast 2022-2032, By Country

    13.1. Historical Market Size Value (US$ Mn) & Volume (Units) Trend Analysis By Market Taxonomy, 2017-2021

    13.2. Market Size Value (US$ Mn) & Volume (Units) Forecast By Market Taxonomy, 2022-2032

        13.2.1. By Country

            13.2.1.1. India

            13.2.1.2. ASEAN

            13.2.1.3. Australia and New Zealand

            13.2.1.4. Rest of South Asia & Pacific

        13.2.2. By Circuit Structure 

        13.2.3. By Component

        13.2.4. By Application

    13.3. Market Attractiveness Analysis

        13.3.1. By Country

        13.3.2. By Circuit Structure 

        13.3.3. By Component

        13.3.4. By Application

    13.4. Key Takeaways

14. MEA Market Analysis 2017-2021 and Forecast 2022-2032, By Country

    14.1. Historical Market Size Value (US$ Mn) & Volume (Units) Trend Analysis By Market Taxonomy, 2017-2021

    14.2. Market Size Value (US$ Mn) & Volume (Units) Forecast By Market Taxonomy, 2022-2032

        14.2.1. By Country

            14.2.1.1. GCC Countries

            14.2.1.2. Turkey

            14.2.1.3. South Africa

            14.2.1.4. Rest of MEA

        14.2.2. By Circuit Structure 

        14.2.3. By Component

        14.2.4. By Application

    14.3. Market Attractiveness Analysis

        14.3.1. By Country

        14.3.2. By Circuit Structure 

        14.3.3. By Component

        14.3.4. By Application

    14.4. Key Takeaways

15. Key Countries Market Analysis

    15.1. U.S.

        15.1.1. Pricing Analysis

        15.1.2. Market Share Analysis, 2021

            15.1.2.1. By Circuit Structure 

            15.1.2.2. By Component

            15.1.2.3. By Application

    15.2. Canada

        15.2.1. Pricing Analysis

        15.2.2. Market Share Analysis, 2021

            15.2.2.1. By Circuit Structure 

            15.2.2.2. By Component

            15.2.2.3. By Application

    15.3. Mexico

        15.3.1. Pricing Analysis

        15.3.2. Market Share Analysis, 2021

            15.3.2.1. By Circuit Structure 

            15.3.2.2. By Component

            15.3.2.3. By Application

    15.4. Brazil

        15.4.1. Pricing Analysis

        15.4.2. Market Share Analysis, 2021

            15.4.2.1. By Circuit Structure 

            15.4.2.2. By Component

            15.4.2.3. By Application

    15.5. Germany

        15.5.1. Pricing Analysis

        15.5.2. Market Share Analysis, 2021

            15.5.2.1. By Circuit Structure 

            15.5.2.2. By Component

            15.5.2.3. By Application

    15.6. Italy

        15.6.1. Pricing Analysis

        15.6.2. Market Share Analysis, 2021

            15.6.2.1. By Circuit Structure 

            15.6.2.2. By Component

            15.6.2.3. By Application

    15.7. France

        15.7.1. Pricing Analysis

        15.7.2. Market Share Analysis, 2021

            15.7.2.1. By Circuit Structure 

            15.7.2.2. By Component

            15.7.2.3. By Application

    15.8. U.K.

        15.8.1. Pricing Analysis

        15.8.2. Market Share Analysis, 2021

            15.8.2.1. By Circuit Structure 

            15.8.2.2. By Component

            15.8.2.3. By Application

    15.9. Spain

        15.9.1. Pricing Analysis

        15.9.2. Market Share Analysis, 2021

            15.9.2.1. By Circuit Structure 

            15.9.2.2. By Component

            15.9.2.3. By Application

    15.10. BENELUX

        15.10.1. Pricing Analysis

        15.10.2. Market Share Analysis, 2021

            15.10.2.1. By Circuit Structure 

            15.10.2.2. By Component

            15.10.2.3. By Application

    15.11. Russia

        15.11.1. Pricing Analysis

        15.11.2. Market Share Analysis, 2021

            15.11.2.1. By Circuit Structure 

            15.11.2.2. By Component

            15.11.2.3. By Application

    15.12. China

        15.12.1. Pricing Analysis

        15.12.2. Market Share Analysis, 2021

            15.12.2.1. By Circuit Structure 

            15.12.2.2. By Component

            15.12.2.3. By Application

    15.13. Japan

        15.13.1. Pricing Analysis

        15.13.2. Market Share Analysis, 2021

            15.13.2.1. By Circuit Structure 

            15.13.2.2. By Component

            15.13.2.3. By Application

    15.14. South Korea

        15.14.1. Pricing Analysis

        15.14.2. Market Share Analysis, 2021

            15.14.2.1. By Circuit Structure 

            15.14.2.2. By Component

            15.14.2.3. By Application

    15.15. India

        15.15.1. Pricing Analysis

        15.15.2. Market Share Analysis, 2021

            15.15.2.1. By Circuit Structure 

            15.15.2.2. By Component

            15.15.2.3. By Application

    15.16. ASEAN

        15.16.1. Pricing Analysis

        15.16.2. Market Share Analysis, 2021

            15.16.2.1. By Circuit Structure 

            15.16.2.2. By Component

            15.16.2.3. By Application

    15.17. Australia and New Zealand

        15.17.1. Pricing Analysis

        15.17.2. Market Share Analysis, 2021

            15.17.2.1. By Circuit Structure 

            15.17.2.2. By Component

            15.17.2.3. By Application

    15.18. GCC Countries

        15.18.1. Pricing Analysis

        15.18.2. Market Share Analysis, 2021

            15.18.2.1. By Circuit Structure 

            15.18.2.2. By Component

            15.18.2.3. By Application

    15.19. Turkey

        15.19.1. Pricing Analysis

        15.19.2. Market Share Analysis, 2021

            15.19.2.1. By Circuit Structure 

            15.19.2.2. By Component

            15.19.2.3. By Application

    15.20. South Africa

        15.20.1. Pricing Analysis

        15.20.2. Market Share Analysis, 2021

            15.20.2.1. By Circuit Structure 

            15.20.2.2. By Component

            15.20.2.3. By Application

16. Market Structure Analysis

    16.1. Competition Dashboard

    16.2. Competition Benchmarking

    16.3. Market Share Analysis of Top Players

        16.3.1. By Regional

        16.3.2. By Circuit Structure 

        16.3.3. By Component

        16.3.4. By Application

17. Competition Analysis

    17.1. Competition Deep Dive

        17.1.1. 3M Company

            17.1.1.1. Overview

            17.1.1.2. Product Portfolio

            17.1.1.3. Profitability by Market Segments

            17.1.1.4. Sales Footprint

            17.1.1.5. Strategy Overview

                17.1.1.5.1. Marketing Strategy

                17.1.1.5.2. Product Strategy

                17.1.1.5.3. Channel Strategy

        17.1.2. Cymbet Corporation, Inc. 

            17.1.2.1. Overview

            17.1.2.2. Product Portfolio

            17.1.2.3. Profitability by Market Segments

            17.1.2.4. Sales Footprint

            17.1.2.5. Strategy Overview

                17.1.2.5.1. Marketing Strategy

                17.1.2.5.2. Product Strategy

                17.1.2.5.3. Channel Strategy

        17.1.3. E Ink Holdings Inc. 

            17.1.3.1. Overview

            17.1.3.2. Product Portfolio

            17.1.3.3. Profitability by Market Segments

            17.1.3.4. Sales Footprint

            17.1.3.5. Strategy Overview

                17.1.3.5.1. Marketing Strategy

                17.1.3.5.2. Product Strategy

                17.1.3.5.3. Channel Strategy

        17.1.4. First Solar, Inc. 

            17.1.4.1. Overview

            17.1.4.2. Product Portfolio

            17.1.4.3. Profitability by Market Segments

            17.1.4.4. Sales Footprint

            17.1.4.5. Strategy Overview

                17.1.4.5.1. Marketing Strategy

                17.1.4.5.2. Product Strategy

                17.1.4.5.3. Channel Strategy

        17.1.5. GE Measurement & Control Solutions 

            17.1.5.1. Overview

            17.1.5.2. Product Portfolio

            17.1.5.3. Profitability by Market Segments

            17.1.5.4. Sales Footprint

            17.1.5.5. Strategy Overview

                17.1.5.5.1. Marketing Strategy

                17.1.5.5.2. Product Strategy

                17.1.5.5.3. Channel Strategy

        17.1.6. ITN Energy Systems Inc. 

            17.1.6.1. Overview

            17.1.6.2. Product Portfolio

            17.1.6.3. Profitability by Market Segments

            17.1.6.4. Sales Footprint

            17.1.6.5. Strategy Overview

                17.1.6.5.1. Marketing Strategy

                17.1.6.5.2. Product Strategy

                17.1.6.5.3. Channel Strategy

        17.1.7. LG Electronics 

            17.1.7.1. Overview

            17.1.7.2. Product Portfolio

            17.1.7.3. Profitability by Market Segments

            17.1.7.4. Sales Footprint

            17.1.7.5. Strategy Overview

                17.1.7.5.1. Marketing Strategy

                17.1.7.5.2. Product Strategy

                17.1.7.5.3. Channel Strategy

        17.1.8. PARC

            17.1.8.1. Overview

            17.1.8.2. Product Portfolio

            17.1.8.3. Profitability by Market Segments

            17.1.8.4. Sales Footprint

            17.1.8.5. Strategy Overview

                17.1.8.5.1. Marketing Strategy

                17.1.8.5.2. Product Strategy

                17.1.8.5.3. Channel Strategy

        17.1.9. Samsung Electronics 

            17.1.9.1. Overview

            17.1.9.2. Product Portfolio

            17.1.9.3. Profitability by Market Segments

            17.1.9.4. Sales Footprint

            17.1.9.5. Strategy Overview

                17.1.9.5.1. Marketing Strategy

                17.1.9.5.2. Product Strategy

                17.1.9.5.3. Channel Strategy

        17.1.10. Corning Inc. 

            17.1.10.1. Overview

            17.1.10.2. Product Portfolio

            17.1.10.3. Profitability by Market Segments

            17.1.10.4. Sales Footprint

            17.1.10.5. Strategy Overview

                17.1.10.5.1. Marketing Strategy

                17.1.10.5.2. Product Strategy

                17.1.10.5.3. Channel Strategy

18. Assumptions & Acronyms Used

19. Research Methodology
Customize this Report

Let us know your requirement to get
100% FREE customization

List of Tables

Table 1: Global Market Value (US$ Mn) Forecast by Region, 2017-2032

Table 2: Global Market Volume (Units) Forecast by Region, 2017-2032

Table 3: Global Market Value (US$ Mn) Forecast by Circuit Structure , 2017-2032

Table 4: Global Market Volume (Units) Forecast by Circuit Structure , 2017-2032

Table 5: Global Market Value (US$ Mn) Forecast by Component, 2017-2032

Table 6: Global Market Volume (Units) Forecast by Component, 2017-2032

Table 7: Global Market Value (US$ Mn) Forecast by Application, 2017-2032

Table 8: Global Market Volume (Units) Forecast by Application, 2017-2032

Table 9: North America Market Value (US$ Mn) Forecast by Country, 2017-2032

Table 10: North America Market Volume (Units) Forecast by Country, 2017-2032

Table 11: North America Market Value (US$ Mn) Forecast by Circuit Structure , 2017-2032

Table 12: North America Market Volume (Units) Forecast by Circuit Structure , 2017-2032

Table 13: North America Market Value (US$ Mn) Forecast by Component, 2017-2032

Table 14: North America Market Volume (Units) Forecast by Component, 2017-2032

Table 15: North America Market Value (US$ Mn) Forecast by Application, 2017-2032

Table 16: North America Market Volume (Units) Forecast by Application, 2017-2032

Table 17: Latin America Market Value (US$ Mn) Forecast by Country, 2017-2032

Table 18: Latin America Market Volume (Units) Forecast by Country, 2017-2032

Table 19: Latin America Market Value (US$ Mn) Forecast by Circuit Structure , 2017-2032

Table 20: Latin America Market Volume (Units) Forecast by Circuit Structure , 2017-2032

Table 21: Latin America Market Value (US$ Mn) Forecast by Component, 2017-2032

Table 22: Latin America Market Volume (Units) Forecast by Component, 2017-2032

Table 23: Latin America Market Value (US$ Mn) Forecast by Application, 2017-2032

Table 24: Latin America Market Volume (Units) Forecast by Application, 2017-2032

Table 25: Europe Market Value (US$ Mn) Forecast by Country, 2017-2032

Table 26: Europe Market Volume (Units) Forecast by Country, 2017-2032

Table 27: Europe Market Value (US$ Mn) Forecast by Circuit Structure , 2017-2032

Table 28: Europe Market Volume (Units) Forecast by Circuit Structure , 2017-2032

Table 29: Europe Market Value (US$ Mn) Forecast by Component, 2017-2032

Table 30: Europe Market Volume (Units) Forecast by Component, 2017-2032

Table 31: Europe Market Value (US$ Mn) Forecast by Application, 2017-2032

Table 32: Europe Market Volume (Units) Forecast by Application, 2017-2032

Table 33: East Asia Market Value (US$ Mn) Forecast by Country, 2017-2032

Table 34: East Asia Market Volume (Units) Forecast by Country, 2017-2032

Table 35: East Asia Market Value (US$ Mn) Forecast by Circuit Structure , 2017-2032

Table 36: East Asia Market Volume (Units) Forecast by Circuit Structure , 2017-2032

Table 37: East Asia Market Value (US$ Mn) Forecast by Component, 2017-2032

Table 38: East Asia Market Volume (Units) Forecast by Component, 2017-2032

Table 39: East Asia Market Value (US$ Mn) Forecast by Application, 2017-2032

Table 40: East Asia Market Volume (Units) Forecast by Application, 2017-2032

Table 41: South Asia & Pacific Market Value (US$ Mn) Forecast by Country, 2017-2032

Table 42: South Asia & Pacific Market Volume (Units) Forecast by Country, 2017-2032

Table 43: South Asia & Pacific Market Value (US$ Mn) Forecast by Circuit Structure , 2017-2032

Table 44: South Asia & Pacific Market Volume (Units) Forecast by Circuit Structure , 2017-2032

Table 45: South Asia & Pacific Market Value (US$ Mn) Forecast by Component, 2017-2032

Table 46: South Asia & Pacific Market Volume (Units) Forecast by Component, 2017-2032

Table 47: South Asia & Pacific Market Value (US$ Mn) Forecast by Application, 2017-2032

Table 48: South Asia & Pacific Market Volume (Units) Forecast by Application, 2017-2032

Table 49: MEA Market Value (US$ Mn) Forecast by Country, 2017-2032

Table 50: MEA Market Volume (Units) Forecast by Country, 2017-2032

Table 51: MEA Market Value (US$ Mn) Forecast by Circuit Structure , 2017-2032

Table 52: MEA Market Volume (Units) Forecast by Circuit Structure , 2017-2032

Table 53: MEA Market Value (US$ Mn) Forecast by Component, 2017-2032

Table 54: MEA Market Volume (Units) Forecast by Component, 2017-2032

Table 55: MEA Market Value (US$ Mn) Forecast by Application, 2017-2032

Table 56: MEA Market Volume (Units) Forecast by Application, 2017-2032
Sudip Saha
Principal Consultant
LinkedIn
Talk to Analyst

Find your sweet spots for generating winning opportunities in this market.

Talk to Analyst

List of Charts

Figure 1: Global Market Value (US$ Mn) by Circuit Structure , 2022-2032

Figure 2: Global Market Value (US$ Mn) by Component, 2022-2032

Figure 3: Global Market Value (US$ Mn) by Application, 2022-2032

Figure 4: Global Market Value (US$ Mn) by Region, 2022-2032

Figure 5: Global Market Value (US$ Mn) Analysis by Region, 2017-2032

Figure 6: Global Market Volume (Units) Analysis by Region, 2017-2032

Figure 7: Global Market Value Share (%) and BPS Analysis by Region, 2022-2032

Figure 8: Global Market Y-o-Y Growth (%) Projections by Region, 2022-2032

Figure 9: Global Market Value (US$ Mn) Analysis by Circuit Structure , 2017-2032

Figure 10: Global Market Volume (Units) Analysis by Circuit Structure , 2017-2032

Figure 11: Global Market Value Share (%) and BPS Analysis by Circuit Structure , 2022-2032

Figure 12: Global Market Y-o-Y Growth (%) Projections by Circuit Structure , 2022-2032

Figure 13: Global Market Value (US$ Mn) Analysis by Component, 2017-2032

Figure 14: Global Market Volume (Units) Analysis by Component, 2017-2032

Figure 15: Global Market Value Share (%) and BPS Analysis by Component, 2022-2032

Figure 16: Global Market Y-o-Y Growth (%) Projections by Component, 2022-2032

Figure 17: Global Market Value (US$ Mn) Analysis by Application, 2017-2032

Figure 18: Global Market Volume (Units) Analysis by Application, 2017-2032

Figure 19: Global Market Value Share (%) and BPS Analysis by Application, 2022-2032

Figure 20: Global Market Y-o-Y Growth (%) Projections by Application, 2022-2032

Figure 21: Global Market Attractiveness by Circuit Structure , 2022-2032

Figure 22: Global Market Attractiveness by Component, 2022-2032

Figure 23: Global Market Attractiveness by Application, 2022-2032

Figure 24: Global Market Attractiveness by Region, 2022-2032

Figure 25: North America Market Value (US$ Mn) by Circuit Structure , 2022-2032

Figure 26: North America Market Value (US$ Mn) by Component, 2022-2032

Figure 27: North America Market Value (US$ Mn) by Application, 2022-2032

Figure 28: North America Market Value (US$ Mn) by Country, 2022-2032

Figure 29: North America Market Value (US$ Mn) Analysis by Country, 2017-2032

Figure 30: North America Market Volume (Units) Analysis by Country, 2017-2032

Figure 31: North America Market Value Share (%) and BPS Analysis by Country, 2022-2032

Figure 32: North America Market Y-o-Y Growth (%) Projections by Country, 2022-2032

Figure 33: North America Market Value (US$ Mn) Analysis by Circuit Structure , 2017-2032

Figure 34: North America Market Volume (Units) Analysis by Circuit Structure , 2017-2032

Figure 35: North America Market Value Share (%) and BPS Analysis by Circuit Structure , 2022-2032

Figure 36: North America Market Y-o-Y Growth (%) Projections by Circuit Structure , 2022-2032

Figure 37: North America Market Value (US$ Mn) Analysis by Component, 2017-2032

Figure 38: North America Market Volume (Units) Analysis by Component, 2017-2032

Figure 39: North America Market Value Share (%) and BPS Analysis by Component, 2022-2032

Figure 40: North America Market Y-o-Y Growth (%) Projections by Component, 2022-2032

Figure 41: North America Market Value (US$ Mn) Analysis by Application, 2017-2032

Figure 42: North America Market Volume (Units) Analysis by Application, 2017-2032

Figure 43: North America Market Value Share (%) and BPS Analysis by Application, 2022-2032

Figure 44: North America Market Y-o-Y Growth (%) Projections by Application, 2022-2032

Figure 45: North America Market Attractiveness by Circuit Structure , 2022-2032

Figure 46: North America Market Attractiveness by Component, 2022-2032

Figure 47: North America Market Attractiveness by Application, 2022-2032

Figure 48: North America Market Attractiveness by Country, 2022-2032

Figure 49: Latin America Market Value (US$ Mn) by Circuit Structure , 2022-2032

Figure 50: Latin America Market Value (US$ Mn) by Component, 2022-2032

Figure 51: Latin America Market Value (US$ Mn) by Application, 2022-2032

Figure 52: Latin America Market Value (US$ Mn) by Country, 2022-2032

Figure 53: Latin America Market Value (US$ Mn) Analysis by Country, 2017-2032

Figure 54: Latin America Market Volume (Units) Analysis by Country, 2017-2032

Figure 55: Latin America Market Value Share (%) and BPS Analysis by Country, 2022-2032

Figure 56: Latin America Market Y-o-Y Growth (%) Projections by Country, 2022-2032

Figure 57: Latin America Market Value (US$ Mn) Analysis by Circuit Structure , 2017-2032

Figure 58: Latin America Market Volume (Units) Analysis by Circuit Structure , 2017-2032

Figure 59: Latin America Market Value Share (%) and BPS Analysis by Circuit Structure , 2022-2032

Figure 60: Latin America Market Y-o-Y Growth (%) Projections by Circuit Structure , 2022-2032

Figure 61: Latin America Market Value (US$ Mn) Analysis by Component, 2017-2032

Figure 62: Latin America Market Volume (Units) Analysis by Component, 2017-2032

Figure 63: Latin America Market Value Share (%) and BPS Analysis by Component, 2022-2032

Figure 64: Latin America Market Y-o-Y Growth (%) Projections by Component, 2022-2032

Figure 65: Latin America Market Value (US$ Mn) Analysis by Application, 2017-2032

Figure 66: Latin America Market Volume (Units) Analysis by Application, 2017-2032

Figure 67: Latin America Market Value Share (%) and BPS Analysis by Application, 2022-2032

Figure 68: Latin America Market Y-o-Y Growth (%) Projections by Application, 2022-2032

Figure 69: Latin America Market Attractiveness by Circuit Structure , 2022-2032

Figure 70: Latin America Market Attractiveness by Component, 2022-2032

Figure 71: Latin America Market Attractiveness by Application, 2022-2032

Figure 72: Latin America Market Attractiveness by Country, 2022-2032

Figure 73: Europe Market Value (US$ Mn) by Circuit Structure , 2022-2032

Figure 74: Europe Market Value (US$ Mn) by Component, 2022-2032

Figure 75: Europe Market Value (US$ Mn) by Application, 2022-2032

Figure 76: Europe Market Value (US$ Mn) by Country, 2022-2032

Figure 77: Europe Market Value (US$ Mn) Analysis by Country, 2017-2032

Figure 78: Europe Market Volume (Units) Analysis by Country, 2017-2032

Figure 79: Europe Market Value Share (%) and BPS Analysis by Country, 2022-2032

Figure 80: Europe Market Y-o-Y Growth (%) Projections by Country, 2022-2032

Figure 81: Europe Market Value (US$ Mn) Analysis by Circuit Structure , 2017-2032

Figure 82: Europe Market Volume (Units) Analysis by Circuit Structure , 2017-2032

Figure 83: Europe Market Value Share (%) and BPS Analysis by Circuit Structure , 2022-2032

Figure 84: Europe Market Y-o-Y Growth (%) Projections by Circuit Structure , 2022-2032

Figure 85: Europe Market Value (US$ Mn) Analysis by Component, 2017-2032

Figure 86: Europe Market Volume (Units) Analysis by Component, 2017-2032

Figure 87: Europe Market Value Share (%) and BPS Analysis by Component, 2022-2032

Figure 88: Europe Market Y-o-Y Growth (%) Projections by Component, 2022-2032

Figure 89: Europe Market Value (US$ Mn) Analysis by Application, 2017-2032

Figure 90: Europe Market Volume (Units) Analysis by Application, 2017-2032

Figure 91: Europe Market Value Share (%) and BPS Analysis by Application, 2022-2032

Figure 92: Europe Market Y-o-Y Growth (%) Projections by Application, 2022-2032

Figure 93: Europe Market Attractiveness by Circuit Structure , 2022-2032

Figure 94: Europe Market Attractiveness by Component, 2022-2032

Figure 95: Europe Market Attractiveness by Application, 2022-2032

Figure 96: Europe Market Attractiveness by Country, 2022-2032

Figure 97: East Asia Market Value (US$ Mn) by Circuit Structure , 2022-2032

Figure 98: East Asia Market Value (US$ Mn) by Component, 2022-2032

Figure 99: East Asia Market Value (US$ Mn) by Application, 2022-2032

Figure 100: East Asia Market Value (US$ Mn) by Country, 2022-2032

Figure 101: East Asia Market Value (US$ Mn) Analysis by Country, 2017-2032

Figure 102: East Asia Market Volume (Units) Analysis by Country, 2017-2032

Figure 103: East Asia Market Value Share (%) and BPS Analysis by Country, 2022-2032

Figure 104: East Asia Market Y-o-Y Growth (%) Projections by Country, 2022-2032

Figure 105: East Asia Market Value (US$ Mn) Analysis by Circuit Structure , 2017-2032

Figure 106: East Asia Market Volume (Units) Analysis by Circuit Structure , 2017-2032

Figure 107: East Asia Market Value Share (%) and BPS Analysis by Circuit Structure , 2022-2032

Figure 108: East Asia Market Y-o-Y Growth (%) Projections by Circuit Structure , 2022-2032

Figure 109: East Asia Market Value (US$ Mn) Analysis by Component, 2017-2032

Figure 110: East Asia Market Volume (Units) Analysis by Component, 2017-2032

Figure 111: East Asia Market Value Share (%) and BPS Analysis by Component, 2022-2032

Figure 112: East Asia Market Y-o-Y Growth (%) Projections by Component, 2022-2032

Figure 113: East Asia Market Value (US$ Mn) Analysis by Application, 2017-2032

Figure 114: East Asia Market Volume (Units) Analysis by Application, 2017-2032

Figure 115: East Asia Market Value Share (%) and BPS Analysis by Application, 2022-2032

Figure 116: East Asia Market Y-o-Y Growth (%) Projections by Application, 2022-2032

Figure 117: East Asia Market Attractiveness by Circuit Structure , 2022-2032

Figure 118: East Asia Market Attractiveness by Component, 2022-2032

Figure 119: East Asia Market Attractiveness by Application, 2022-2032

Figure 120: East Asia Market Attractiveness by Country, 2022-2032

Figure 121: South Asia & Pacific Market Value (US$ Mn) by Circuit Structure , 2022-2032

Figure 122: South Asia & Pacific Market Value (US$ Mn) by Component, 2022-2032

Figure 123: South Asia & Pacific Market Value (US$ Mn) by Application, 2022-2032

Figure 124: South Asia & Pacific Market Value (US$ Mn) by Country, 2022-2032

Figure 125: South Asia & Pacific Market Value (US$ Mn) Analysis by Country, 2017-2032

Figure 126: South Asia & Pacific Market Volume (Units) Analysis by Country, 2017-2032

Figure 127: South Asia & Pacific Market Value Share (%) and BPS Analysis by Country, 2022-2032

Figure 128: South Asia & Pacific Market Y-o-Y Growth (%) Projections by Country, 2022-2032

Figure 129: South Asia & Pacific Market Value (US$ Mn) Analysis by Circuit Structure , 2017-2032

Figure 130: South Asia & Pacific Market Volume (Units) Analysis by Circuit Structure , 2017-2032

Figure 131: South Asia & Pacific Market Value Share (%) and BPS Analysis by Circuit Structure , 2022-2032

Figure 132: South Asia & Pacific Market Y-o-Y Growth (%) Projections by Circuit Structure , 2022-2032

Figure 133: South Asia & Pacific Market Value (US$ Mn) Analysis by Component, 2017-2032

Figure 134: South Asia & Pacific Market Volume (Units) Analysis by Component, 2017-2032

Figure 135: South Asia & Pacific Market Value Share (%) and BPS Analysis by Component, 2022-2032

Figure 136: South Asia & Pacific Market Y-o-Y Growth (%) Projections by Component, 2022-2032

Figure 137: South Asia & Pacific Market Value (US$ Mn) Analysis by Application, 2017-2032

Figure 138: South Asia & Pacific Market Volume (Units) Analysis by Application, 2017-2032

Figure 139: South Asia & Pacific Market Value Share (%) and BPS Analysis by Application, 2022-2032

Figure 140: South Asia & Pacific Market Y-o-Y Growth (%) Projections by Application, 2022-2032

Figure 141: South Asia & Pacific Market Attractiveness by Circuit Structure , 2022-2032

Figure 142: South Asia & Pacific Market Attractiveness by Component, 2022-2032

Figure 143: South Asia & Pacific Market Attractiveness by Application, 2022-2032

Figure 144: South Asia & Pacific Market Attractiveness by Country, 2022-2032

Figure 145: MEA Market Value (US$ Mn) by Circuit Structure , 2022-2032

Figure 146: MEA Market Value (US$ Mn) by Component, 2022-2032

Figure 147: MEA Market Value (US$ Mn) by Application, 2022-2032

Figure 148: MEA Market Value (US$ Mn) by Country, 2022-2032

Figure 149: MEA Market Value (US$ Mn) Analysis by Country, 2017-2032

Figure 150: MEA Market Volume (Units) Analysis by Country, 2017-2032

Figure 151: MEA Market Value Share (%) and BPS Analysis by Country, 2022-2032

Figure 152: MEA Market Y-o-Y Growth (%) Projections by Country, 2022-2032

Figure 153: MEA Market Value (US$ Mn) Analysis by Circuit Structure , 2017-2032

Figure 154: MEA Market Volume (Units) Analysis by Circuit Structure , 2017-2032

Figure 155: MEA Market Value Share (%) and BPS Analysis by Circuit Structure , 2022-2032

Figure 156: MEA Market Y-o-Y Growth (%) Projections by Circuit Structure , 2022-2032

Figure 157: MEA Market Value (US$ Mn) Analysis by Component, 2017-2032

Figure 158: MEA Market Volume (Units) Analysis by Component, 2017-2032

Figure 159: MEA Market Value Share (%) and BPS Analysis by Component, 2022-2032

Figure 160: MEA Market Y-o-Y Growth (%) Projections by Component, 2022-2032

Figure 161: MEA Market Value (US$ Mn) Analysis by Application, 2017-2032

Figure 162: MEA Market Volume (Units) Analysis by Application, 2017-2032

Figure 163: MEA Market Value Share (%) and BPS Analysis by Application, 2022-2032

Figure 164: MEA Market Y-o-Y Growth (%) Projections by Application, 2022-2032

Figure 165: MEA Market Attractiveness by Circuit Structure , 2022-2032

Figure 166: MEA Market Attractiveness by Component, 2022-2032

Figure 167: MEA Market Attractiveness by Application, 2022-2032

Figure 168: MEA Market Attractiveness by Country, 2022-2032

Need specific information?

Request Customization

Explore Technology Insights

View Reports

Recommendations

Technology

Printed Electronics Market

Published : June 2016

Technology

Power Electronics Market

Published : March 2022

Technology

Organic Electronics Market

Published : January 1970

Technology

Wearable Electronics Market

Published : January 1970

Google translate

Flexible Electronics Market