India Steel Drum & IBC Market Outlook (2023 to 2033)

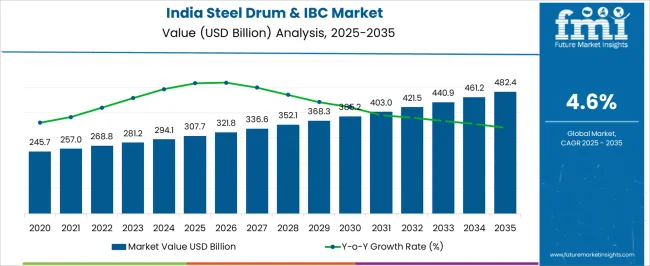
India steel drum market is set to gain a valuation of US$ 281.2 million while India IBC market size is estimated to reach US$ 170.5 million in 2023. Over the next ten years, sales of steel drums and IBCs across India are likely to soar at 4.6% and 3.8% CAGRs respectively.

By 2033, India steel drum industry is projected to reach a valuation of US$ 468.7 million. India IBC market value on the other hand is forecast to reach US$ 260.5 million.

India steel drum & IBC sales are expected to witness a steady growth rate with the top 5 companies projected to hold around 40 to 50% of the market by the end of 2023.

The need for material handling solutions that adhere to strict safety standards is growing as more organizations handle and transport hazardous products. This is creating a high demand for steel drums and IBCs across India.

Demand for better product protection and authenticity among the chemical industries is likely to bolster steel drum & IBC sales. The India steel drums and IBC markets are anticipated to expand 1.7x & 1.6x times respectively of the current market value during the forecast period.

India steel drum sales are projected to generate an attractive incremental growth opportunity of US$ 187.9 million. Subsequently, IBC sales in the country are projected to generate an incremental growth opportunity of US$ 90 million.

Transport & logistics companies have been majorly utilizing steel drums & IBC. They employ steel drums & IBCs for shipping various goods & materials overseas.

Key Trends Shaping Growth in the Market:

  • Robust expansion of industries such as chemicals, petroleum, food & beverages, etc. will elevate steel drum & IBC demand
  • Growing awareness about the impact of packaging solutions on product life span will encourage the adoption of steel drums and IBCs
  • Increasing import and export activities across India will fuel steel drum & IBC sales
  • Integration of novel technologies such as RFID in steel drums and intermediate bulk containers will boost the market
  • Rising demand for customized bulk packaging solutions will fuel market expansion

IBCs and steel drums are standard bulk-packaging solutions or shipping containers used for transportation of industrial and non-industrial products. These solutions are designed to safely store and transport large quantities of both hazardous and non-hazardous solid, liquid, and semi-liquid products.

Usage of steel drums and IBC allows end users to effectively protect their products during storage and transportation while saving transportation costs.

Bulk packaging solutions such as intermediate bulk containers (IBCs), also known as IBC totes, are gaining wider popularity across India. This is due to their ability to provide an optimal hygienic environment for the packed products, extend their shelf life, and reduce the chances of spillage.

Steel drums and IBCs store materials in less space than several standard packaging solutions. Their pallet-mounted shape makes them ideal for storage and transportation applications. These packaging solutions are known for their hygiene, sturdiness, and ability to handle pressure during transportation through long distances.

Rising usage across various industries for transporting large masses of essential commodities such as chemicals, pharmaceuticals, food & beverages, petroleum, etc. is expected to boost the market.

IBCs are reusable and are thus considered environmentally friendly. IBCs such as flexible intermediate bulk containers (FIBCs) and rigid intermediate bulk containers (RIBCs) are being widely used across chemical and food & beverages sectors.

Rise in cross-country trade due to open trade policies will play a key role in boosting India steel drum & IBC market during the assessment period.

Another key factor that is expected to boost the market is the rising demand for sustainable and eco-friendly packaging solutions.

Leading steel drum & IBC manufacturers are investing in novel technologies and processes that minimize their carbon footprint and reduce waste. They are also introducing new solutions to meet end user demand.

India Steel Drums Market:

Attributes Key Insights
Estimated India Steel Drums Market Size (2023) US$ 281.2 million
Projected India Steel Drums Market Value (2033) US$ 468.7 million
Value-based CAGR (2023 to 2033) 4.6%
Collective Value Share: Top 5 Companies (2022A) 35 to 40%

India IBC Market:

Attributes Key Insights
Estimated India IBC Market Value (2023) US$ 170.5 million
Projected India IBC Market Size (2033) US$ 260.5 million
Value-based CAGR (2023 to 2033) 3.8%
Collective Value Share: Top 5 Companies (2022A) 40 to 50%

Don't pay for what you don't need

Customize your report by selecting specific countries or regions and save 30%!

2014 to 2022 India Steel Drum & IBC Sales Outlook Compared to Demand Forecast from 2023 to 2033

India steel drum & IBC sales increased at around 3.0% and 2.6% CAGRs respectively during the historic period. Over the next decade, Future Market Insights (FMI) predicts steel drum & IBC demand across India to rise at 4.6% and 3.8% CAGR respectively.

Rising applications of steel drums & IBCs across diverse industries is driving India market forward.

Many industrial items, including chemicals, oils, solvents, and hazardous compounds, are stored and transported in steel drums. These drums are made to last, be strong, and survive the demanding industrial circumstances.

Steel drums are normally constructed of steel that is sufficiently thick to resist the weight of the products they hold as well as any impacts they may experience during storage & transportation.

Little industrial steel barrels that hold a few gallons to big drums that can carry more than 50 gallons are all available in a variety of sizes and capacities. To maintain the security of the goods, they are frequently needed to adhere to particular laws and norms.

IBCs are reusable industrial containers that are used for the transportation and storage of bulk liquids, powders, and granulated materials. They are made with a standardized shape and size that enables them to be conveniently stacked, carried, and handled by forklifts or pallet jacks.

IBCs are designed to have a volume of between 500 and 3,000 liters (132 and 793 gallons). They typically consist of a pallet foundation, a top cover or lid, and a rigid or flexible container.

For the transportation and storage of diverse products, IBCs are frequently used in industries such as agriculture, food and beverage, pharmaceuticals, and chemicals.

Key Factors Driving the India Steel Drum & IBC Market

Increasing Demand for Industrial Packaging Solutions to Boost the Market

Steel barrels are a practical solution for material storage and transportation because they endure for a long time and have minimal influence on the environment.

Steel drums & IBC are among the industrial packaging items that are more in demand as a result of India's expanding industrialization. India's top steel drum & IBC users include the chemical, pharmaceutical, and food processing industries.

Compared to other materials, steel is stronger and more durable. The growth of industries, such as pharmaceutical, food & beverage, and chemical is expected to scale up steel drum & IBC demand.

Steel drums are more resilient to collisions, leaks, and punctures. This makes it a popular option for transporting hazardous materials and hefty solid objects.

Various industries are using packaging solutions such as barrel drums, steel barrels, metal drums, and metal drum containers to transport hazardous & nonhazardous liquids or semi-liquids. Similarly, popularity of flexitanks or flexi tank containers is rising across India.

Growing usage of industrial steel drums for transporting various products will create lucrative opportunities for steel drum & IBC manufacturers.

Rapid Expansion of FMCG Sector in India to Elevate IBC Demand

One of the leading users of IBCs in India is the FMCG sector, especially for the storage and transportation of liquid and powder products. IBCs can aid in enhancing the effectiveness of logistics processes in the FMCG sector.

IBCs, for instance, can be made to fit onto pallets, which makes them simple to transport and stack. As a result, transporting FMCG goods from one place to another takes less time and money.

IBCs are a perfect choice for the FMCG business because they are made to adhere to high safety and hygiene regulations. They can be created from anti-contamination materials and are simple to clean and sterilize in between usage. This helps stop the spread of germs and other contaminants.

Demand for IBCs from the FMCG sector is predicted to boost the market as the FMCG market in India is anticipated to rise at a CAGR of 14.9% to reach US$ 220 billion by 2025.

Rising Usage in Pharma Sector to Create Growth Opportunities for Steel Drums & IBC Manufacturers

Industrial steel barrels are widely used by the pharmaceutical industry. Pharmaceutical products, including both raw materials and finished goods, are stored and transported in these containers.

Several pharmaceutical items include dangerous components that demand unique handling and storage. Such materials are best stored in industrial steel drums because they are made to withstand the corrosive nature of these materials.

Pharmaceutical businesses use industrial steel barrels to assist them to meet regulatory criteria because the pharmaceutical industry is highly regulated. For instance, industrial steel barrels can be used to meet the requirements for airtight storage for some medicinal goods.

Industrial steel barrels offer a barrier against external contamination, which is a necessity for pharmaceutical items that need to be shielded from contamination. The drums are made to be airtight, preventing the entry of impurities such as moisture, dust, and others.

The supply chain for the pharmaceutical business is not complete without industrial steel drums. They contribute to making sure that pharmaceutical items are transported and stored safely and securely, which is essential to ensuring the effectiveness and quality of these medicines. The pharmaceutical business is anticipated to expand, which will benefit the target market's success.

Ismail Sutaria
Ismail Sutaria

Principal Consultant

Talk to Analyst

Find your sweet spots for generating winning opportunities in this market.

Category-wise Insights

Which is the Most Commonly Used Material for Manufacturing Steel Drums?

Both Manufacturers and End-users Prefer Steel Drums Made from Carbon Steel

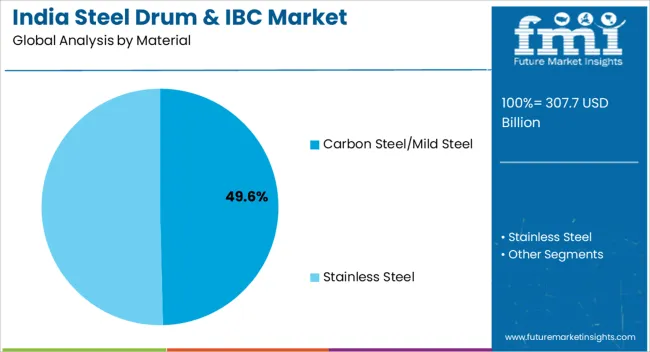
With a safe and secure packaging solution outlook, the carbon steel segment is enjoying astonishing demand in the market. Manufacturers are increasingly using carbon steel for manufacturing steel drums on account of its various benefits.

Carbon steel is a strong and durable material that is often used to store or transport heavy or abrasive products, such as sand, cement, or gravel. The target segment currently holds more than 93% of the market share.

Growing end user preference for steel drums made from carbon steel is another key factor driving growth of the target segment. The same segment is projected to create an incremental opportunity of US$ 179.9 million during the assessment period.

Stainless steel drums demand is also likely to rise at a significant pace across India during the next ten years. This is due to rising adoption of these stainless steel drums across various industries.

Why are Open-Head Steel Drums Rising in Popularity across India?

Attractive Features of Open-head Steel Drums Aiding Popularity

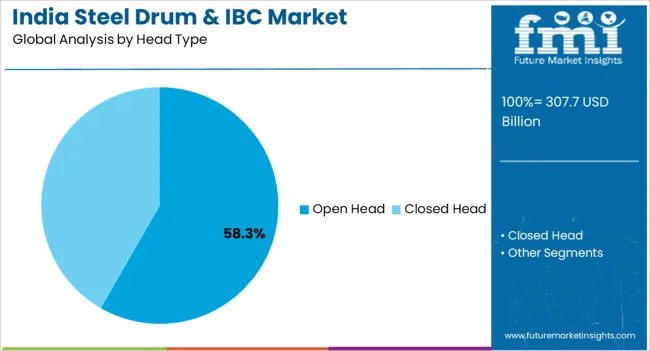
The open-head steel drums segment is estimated to progress at 6.5% CAGR. It is likely to create an incremental opportunity of US$ 41.4 million in the next ten years. This is due to rising popularity of these open top steel drums on account of their various features.

Open-head steel drums, also known as open-top drums, feature a removable lid. They are commonly used for storing and transporting solids and liquids that require easy access and frequent filling or emptying.

Why is Demand for Composite IBCs Rising in India?

Need for Lightweight, Durable, & Hygienic Packaging Fueling Composite IBC Demand

Composite IBCs are a durable, lightweight, stackable, and hygienic solution for transportation and storage. They are versatile as they can be used for a wide range of applications, including the storage and transport of chemicals, food products, and pharmaceuticals.

As per Future Market Insights (FMI), the target segment is anticipated to hold more than 99.5% share in India IBC industry in 2023. Further, it is expected to create an incremental opportunity of US$ 95.1 million during the forecast period.

Which is the Leading End-use Industry for Steel Drums and IBC in India?

Steel Drum and IBC Sales to Remain Highly Concentrated in Industrial Chemicals Sector

In terms of demand and market share, industrial chemicals segment leads the market from the forefront. Industrial chemicals segment is projected to hold around 60.9% of India steel drums industry. Similarly, it is expected to account for 55.1% share of India IBC industry in 2023.

Rising need for highly protective packaging solutions for the safe transport of harmful chemicals is encouraging the adoption of steel drums and IBCs in industrial chemicals sector.

On the other hand, food segment in India's steel drums & IBC markets is projected to register a CAGR of 6.7% and 6.9% in the forecast years respectively.
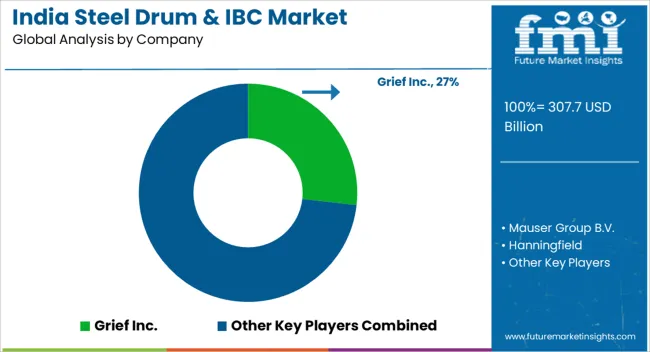
Competitive Landscape

Leading manufacturers of steel drums and IBCs are focusing on increasing their sales and strengthening their presence across India by employing various strategies. This includes new product launches, mergers, acquisitions, facility expansions, price reductions, collaborations, and agreements.

For instance:

  • In February 2023, Nippon Steel announced that it had agreed to acquire equity and royalty interests in Elk Valley Resources Ltd with Teck Resources Limited.
  • In December 2022, Grief Inc. announced that they have completed the acquisition of Lee Container Corporation, Inc.
  • In April 2021, Mauser Packaging Solutions announced its expansion by acquiring Global Tank Srl to extend its product offerings of industrial packaging in the Italian market.

Get the data you need at a Fraction of the cost

Personalize your report by choosing insights you need
and save 40%!

Scope of the Report

Attribute Details
Estimated Valuation for Steel Drums Market (2023) US$ 281.2 million
Estimated Valuation for IBC Market (2023) US$ 170.5 million
Projected Market Value (2033) US$ 468.7 million (India Steel Drums Industry) US$ 260.5 million (India IBC Industry)
Anticipated Growth Rate (2023 to 2033) 4.6% (India Steel Drums Industry) 3.8% (India IBC Industry)
Historical Data 2014 to 2022
Forecast Period 2023 to 2033
Quantitative Units Revenue in US$ Million, Volume in Units and CAGR from 2023 to 2033
Report Coverage Revenue Forecast, Volume Forecast, Company Ranking, Competitive Landscape, Growth Factors, Trends and Pricing Analysis
Segments Covered Material, Capacity, Content, Head Type, End Use
Key Companies Profiled Grief Inc.; Mauser Group B.V.; Hanningfield; Pyramid Technoplast Pvt. Ltd; TPL Plastech Limited; Vizag Chemical International; Shree Dwarkesh Chem Industries; Balmer Lawrie & Co. Limited; Metal Seam Co. Pvt. Ltd; The East India Drums & Barrels Mfg. Co.; Sicagen India Limited; Industrial Engineering Corporation; Tripura Containers Private Limited; ABCD Drums & Barrels Industries; Pearson Drums & Barrels Private Limited; Vimal Barrels Pvt. Ltd.; Kumar Containers Pvt. Ltd; Scoya Pharmatech; Agarwal Packaging Pvt. Ltd; Nakoda Containers Private Limited; Gujarat Polythene; Supreme Industries; MAHIMA Drums Manufacturing Co.

India Steel Drum & IBC Market Category

India Steel Drum Market by Category:

By Material:

  • Carbon Steel/Mild Steel
  • Stainless Steel

By Head Type:

  • Open Head
  • Closed head

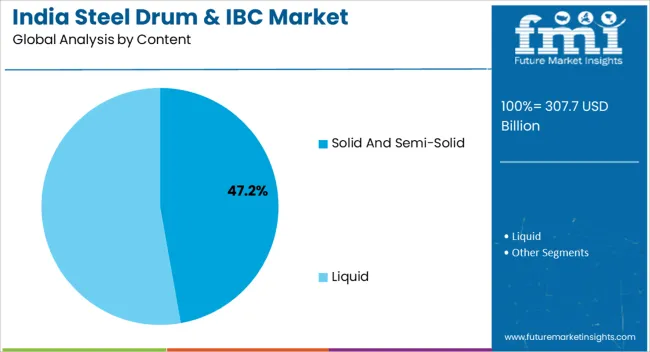
By Content:

  • Solid and Semi-solid
  • Liquid

By End Use:

  • Industrial Chemicals
  • Petroleum & Lubricants
  • Food
  • Beverages
  • Building & Construction
  • Healthcare & Pharmaceutical
  • Agricultural & Allied Products
  • Others Industrial Uses

India IBC Market by Category:

By Material:

  • Composite IBCs
  • Cardboard IBCs

By Content:

  • Solid and Semi-solid
  • Liquid

By End Use:

  • Industrial Chemicals
  • Petroleum & Lubricants
  • Food
  • Beverages
  • Building & Construction
  • Healthcare & Pharmaceutical
  • Agricultural & Allied Products
  • Others Industrial Uses

Frequently Asked Questions

What is the Current Market India Steel Drum & IBC Valuation?

The market is estimated to secure a valuation of US$ 281.2 million in 2023.

What is the Growth Potential of the India Steel Drug & IBC Market?

The growth potential of the market is 4.6% through 2033.

What is the Projected Size of the Market by 2033?

The global market size is estimated to reach US$ 468.7 million by 2033.

Who are the Key Players in the India Steel Drum & IBC Market?

Grief Inc., Mauser Group B.V., and Hanningfield are the key market players.

What is the Key Trend of the Market?

Rising cross-border trade is likely to boost market demand.

Table of Content

India Steel Drum Market

1. Executive Summary     1.1. Market Outlook     1.2. Market Analysis     1.3. Analysis and Recommendations 2. Market Overview     2.1. Market Coverage / Taxonomy     2.2. Market Definition / Scope / Limitations 3. Key Market Trends     3.1. Key Trends Impacting the Market     3.2. Product Innovation / Development Trends 4. Key Success Factors     4.1. Product Adoption / Usage Analysis     4.2. Product USP’s / Features     4.3. Strategic Promotional Strategies 5. Market Demand Analysis 2014 to 2022 and Forecast, 2023 to 2033     5.1. Historical Market Volume (Units) Analysis, 2014 to 2022     5.2. Current and Future Market Volume (Units) Projections, 2023 to 2033     5.3. Y-o-Y Growth Trend Analysis 6. Market - Pricing Analysis     6.1. Pricing Analysis     6.2. Average Pricing Analysis Benchmark 7. Market Demand (in Value or Size in US$ Million) Analysis 2014 to 2022 and Forecast, 2023 to 2033     7.1. Historical Market Value (US$ Million) Analysis, 2014 to 2022     7.2. Current and Future Market Value (US$ Million) Projections, 2023 to 2033         7.2.1. Y-o-Y Growth Trend Analysis         7.2.2. Absolute $ Opportunity Analysis 8. Market Background     8.1. Global Packaging Industry Overview     8.2. India Chemical Industry Overview     8.3. India Petroleum & Lubricants Overview     8.4. India Logistics Market Overview     8.5. India Industrial Packaging Market Overview     8.6. Macro-Economic Factors     8.7. Forecast Factors - Relevance & Impact     8.8. Value Chain         8.8.1. Raw Material Suppliers         8.8.2. Steel Drum Manufacturers         8.8.3. End Users     8.9. COVID-19 Crisis – Impact Assessment         8.9.1. Current Statistics         8.9.2. Short-Mid-Long Term Outlook         8.9.3. Likely Rebound     8.10. Market Dynamics         8.10.1. Drivers         8.10.2. Restraints         8.10.3. Opportunity Analysis 9. Market Analysis 2014 to 2022 and Forecast 2023 to 2033, By Material     9.1. Introduction / Key Findings     9.2. Historical Market Size Value (US$ Million) & Volume (Units) Analysis By Material, 2014 to 2022     9.3. Current and Future Market Size Value (US$ Million) & Volume (Units) Analysis and Forecast By Material, 2023 to 2033         9.3.1. Carbon Steel         9.3.2. Stainless Steel     9.4. Y-o-Y Growth Trend Analysis By Material, 2014 to 2022     9.5. Absolute $ Opportunity Analysis By Material, 2023 to 2033 10. Market Analysis 2014 to 2022 and Forecast 2023 to 2033, By Head Type     10.1. Introduction / Key Findings     10.2. Historical Market Size Value (US$ Million) & Volume (Units) Analysis By Head Type, 2014 to 2022     10.3. Current and Future Market Size Value (US$ Million) & Volume (Units) Analysis and Forecast By Head Type, 2023 to 2033         10.3.1. Open Head         10.3.2. Closed Head     10.4. Y–o–Y Growth Trend Analysis By Head Type, 2014 to 2022     10.5. Absolute $ Opportunity Analysis By Head Type, 2023 to 2033 11. Market Analysis 2014 to 2022 and Forecast 2023 to 2033, By Content Type     11.1. Introduction / Key Findings     11.2. Historical Market Size Value (US$ Million) & Volume (Units) Analysis By Content Type, 2014 to 2022     11.3. Current and Future Market Size Value (US$ Million) & Volume (Units) Analysis and Forecast By Content Type, 2023 to 2033         11.3.1. Solid and Semi-solid         11.3.2. Liquid     11.4. Y–o–Y Growth Trend Analysis By Content Type, 2014 to 2022     11.5. Absolute $ Opportunity Analysis By Content Type, 2023 to 2033 12. Market Analysis 2014 to 2022 and Forecast 2023 to 2033, By End Use     12.1. Introduction / Key Findings     12.2. Historical Market Size Value (US$ Million) & Volume (Units) Analysis By End Use, 2014 to 2022     12.3. Current and Future Market Size Value (US$ Million) & Volume (Units) Analysis and Forecast By End Use, 2023 to 2033         12.3.1. Industrial Chemicals         12.3.2. Petroleum & Lubricants         12.3.3. Food         12.3.4. Beverages         12.3.5. Building & Construction         12.3.6. Healthcare & Pharmaceutical         12.3.7. Agricultural & Allied Products         12.3.8. Other Industrial Uses     12.4. Y-o-Y Growth Trend Analysis By End Use, 2014 to 2022     12.5. Absolute $ Opportunity Analysis By End Use, 2023 to 2033 13. Market Structure Analysis     13.1. Market Analysis by Tier of Companies (Steel Drum)     13.2. Market Share Analysis of Top Players     13.3. Market Presence Analysis 14. Competition Analysis     14.1. Competition Dashboard     14.2. Competition Benchmarking     14.3. Competition Deep Dive         14.3.1. Grief Inc.             14.3.1.1. Overview             14.3.1.2. Product Portfolio             14.3.1.3. Profitability by Market Segments (Material/Head Type/Content/End Use/Country)             14.3.1.4. Sales Footprint             14.3.1.5. Strategy Overview                 14.3.1.5.1. Marketing Strategy                 14.3.1.5.2. Product Strategy                 14.3.1.5.3. Channel Strategy         14.3.2. Mauser Group B.V.             14.3.2.1. Overview             14.3.2.2. Product Portfolio             14.3.2.3. Profitability by Market Segments (Material/Head Type/Content/End Use/Country)             14.3.2.4. Sales Footprint             14.3.2.5. Strategy Overview                 14.3.2.5.1. Marketing Strategy                 14.3.2.5.2. Product Strategy                 14.3.2.5.3. Channel Strategy         14.3.3. Hanningfield             14.3.3.1. Overview             14.3.3.2. Product Portfolio             14.3.3.3. Profitability by Market Segments (Material/Head Type/Content/End Use/Country)             14.3.3.4. Sales Footprint             14.3.3.5. Strategy Overview                 14.3.3.5.1. Marketing Strategy                 14.3.3.5.2. Product Strategy                 14.3.3.5.3. Channel Strategy         14.3.4. Sintex Plastics Technology Ltd             14.3.4.1. Overview             14.3.4.2. Product Portfolio             14.3.4.3. Profitability by Market Segments (Material/Head Type/Content/End Use/Country)             14.3.4.4. Sales Footprint             14.3.4.5. Strategy Overview                 14.3.4.5.1. Marketing Strategy                 14.3.4.5.2. Product Strategy                 14.3.4.5.3. Channel Strategy         14.3.5. Pyramid Technoplast Pvt. Ltd             14.3.5.1. Overview             14.3.5.2. Product Portfolio             14.3.5.3. Profitability by Market Segments (Material/Head Type/Content/End Use/Country)             14.3.5.4. Sales Footprint             14.3.5.5. Strategy Overview                 14.3.5.5.1. Marketing Strategy                 14.3.5.5.2. Product Strategy                 14.3.5.5.3. Channel Strategy         14.3.6. Vizag Chemicals Private Limited             14.3.6.1. Overview             14.3.6.2. Product Portfolio             14.3.6.3. Profitability by Market Segments (Material/Head Type/Content/End Use/Country)             14.3.6.4. Sales Footprint             14.3.6.5. Strategy Overview                 14.3.6.5.1. Marketing Strategy                 14.3.6.5.2. Product Strategy                 14.3.6.5.3. Channel Strategy         14.3.7. Shree Dwarkesh Chem Industries             14.3.7.1. Overview             14.3.7.2. Product Portfolio             14.3.7.3. Profitability by Market Segments (Material/Head Type/Content/End Use/Country)             14.3.7.4. Sales Footprint             14.3.7.5. Strategy Overview                 14.3.7.5.1. Marketing Strategy                 14.3.7.5.2. Product Strategy                 14.3.7.5.3. Channel Strategy         14.3.8. Balmer Lawrie & Co. Limited             14.3.8.1. Overview             14.3.8.2. Product Portfolio             14.3.8.3. Profitability by Market Segments (Material/Head Type/Content/End Use/Country)             14.3.8.4. Sales Footprint             14.3.8.5. Strategy Overview                 14.3.8.5.1. Marketing Strategy                 14.3.8.5.2. Product Strategy                 14.3.8.5.3. Channel Strategy         14.3.9. Metal Seam Co. Pvt. Ltd             14.3.9.1. Overview             14.3.9.2. Product Portfolio             14.3.9.3. Profitability by Market Segments (Material/Head Type/Content/End Use/Country)             14.3.9.4. Sales Footprint             14.3.9.5. Strategy Overview                 14.3.9.5.1. Marketing Strategy                 14.3.9.5.2. Product Strategy                 14.3.9.5.3. Channel Strategy         14.3.10. The East India Drums & Barrels Mfg. Co.             14.3.10.1. Overview             14.3.10.2. Product Portfolio             14.3.10.3. Profitability by Market Segments (Material/Head Type/Content/End Use/Country)             14.3.10.4. Sales Footprint             14.3.10.5. Strategy Overview                 14.3.10.5.1. Marketing Strategy                 14.3.10.5.2. Product Strategy                 14.3.10.5.3. Channel Strategy         14.3.11. Sicagen India Limited             14.3.11.1. Overview             14.3.11.2. Product Portfolio             14.3.11.3. Profitability by Market Segments (Material/Head Type/Content/End Use/Country)             14.3.11.4. Sales Footprint             14.3.11.5. Strategy Overview                 14.3.11.5.1. Marketing Strategy                 14.3.11.5.2. Product Strategy                 14.3.11.5.3. Channel Strategy         14.3.12. Industrial Engineering Corporation             14.3.12.1. Overview             14.3.12.2. Product Portfolio             14.3.12.3. Profitability by Market Segments (Material/Head Type/Content/End Use/Country)             14.3.12.4. Sales Footprint             14.3.12.5. Strategy Overview                 14.3.12.5.1. Marketing Strategy                 14.3.12.5.2. Product Strategy                 14.3.12.5.3. Channel Strategy         14.3.13. Tripura Containers Private Limited             14.3.13.1. Overview             14.3.13.2. Product Portfolio             14.3.13.3. Profitability by Market Segments (Material/Head Type/Content/End Use/Country)             14.3.13.4. Sales Footprint             14.3.13.5. Strategy Overview                 14.3.13.5.1. Marketing Strategy                 14.3.13.5.2. Product Strategy                 14.3.13.5.3. Channel Strategy         14.3.14. ABCD Drums & Barrels Industries             14.3.14.1. Overview             14.3.14.2. Product Portfolio             14.3.14.3. Profitability by Market Segments (Material/Head Type/Content/End Use/Country)             14.3.14.4. Sales Footprint             14.3.14.5. Strategy Overview                 14.3.14.5.1. Marketing Strategy                 14.3.14.5.2. Product Strategy                 14.3.14.5.3. Channel Strategy         14.3.15. Pearson Drums & Barrels Private Limited             14.3.15.1. Overview             14.3.15.2. Product Portfolio             14.3.15.3. Profitability by Market Segments (Material/Head Type/Content/End Use/Country)             14.3.15.4. Sales Footprint             14.3.15.5. Strategy Overview                 14.3.15.5.1. Marketing Strategy                 14.3.15.5.2. Product Strategy                 14.3.15.5.3. Channel Strategy         14.3.16. Vimal Barrels Pvt. Ltd.             14.3.16.1. Overview             14.3.16.2. Product Portfolio             14.3.16.3. Profitability by Market Segments (Material/Head Type/Content/End Use/Country)             14.3.16.4. Sales Footprint             14.3.16.5. Strategy Overview                 14.3.16.5.1. Marketing Strategy                 14.3.16.5.2. Product Strategy                 14.3.16.5.3. Channel Strategy         14.3.17. Kumar Containers Pvt. Ltd             14.3.17.1. Overview             14.3.17.2. Product Portfolio             14.3.17.3. Profitability by Market Segments (Material/Head Type/Content/End Use/Country)             14.3.17.4. Sales Footprint             14.3.17.5. Strategy Overview                 14.3.17.5.1. Marketing Strategy                 14.3.17.5.2. Product Strategy                 14.3.17.5.3. Channel Strategy         14.3.18. Scoya Pharmatech             14.3.18.1. Overview             14.3.18.2. Product Portfolio             14.3.18.3. Profitability by Market Segments (Material/Head Type/Content/End Use/Country)             14.3.18.4. Sales Footprint             14.3.18.5. Strategy Overview                 14.3.18.5.1. Marketing Strategy                 14.3.18.5.2. Product Strategy                 14.3.18.5.3. Channel Strategy         14.3.19. Agarwal Packaging Pvt. Ltd             14.3.19.1. Overview             14.3.19.2. Product Portfolio             14.3.19.3. Profitability by Market Segments (Material/Head Type/Content/End Use/Country)             14.3.19.4. Sales Footprint             14.3.19.5. Strategy Overview                 14.3.19.5.1. Marketing Strategy                 14.3.19.5.2. Product Strategy                 14.3.19.5.3. Channel Strategy         14.3.20. Nakoda Containers Private Limited             14.3.20.1. Overview             14.3.20.2. Product Portfolio             14.3.20.3. Profitability by Market Segments (Material/Head Type/Content/End Use/Country)             14.3.20.4. Sales Footprint             14.3.20.5. Strategy Overview                 14.3.20.5.1. Marketing Strategy                 14.3.20.5.2. Product Strategy                 14.3.20.5.3. Channel Strategy         14.3.21. Gujarat Polythene             14.3.21.1. Overview             14.3.21.2. Product Portfolio             14.3.21.3. Profitability by Market Segments (Material/Head Type/Content/End Use/Country)             14.3.21.4. Sales Footprint             14.3.21.5. Strategy Overview                 14.3.21.5.1. Marketing Strategy                 14.3.21.5.2. Product Strategy                 14.3.21.5.3. Channel Strategy         14.3.22. Supreme Industries             14.3.22.1. Overview             14.3.22.2. Product Portfolio             14.3.22.3. Profitability by Market Segments (Material/Head Type/Content/End Use/Country)             14.3.22.4. Sales Footprint             14.3.22.5. Strategy Overview                 14.3.22.5.1. Marketing Strategy                 14.3.22.5.2. Product Strategy                 14.3.22.5.3. Channel Strategy         14.3.23. MAHIMA Drums Manufacturing Co.             14.3.23.1. Overview             14.3.23.2. Product Portfolio             14.3.23.3. Profitability by Market Segments (Material/Head Type/Content/End Use/Country)             14.3.23.4. Sales Footprint             14.3.23.5. Strategy Overview                 14.3.23.5.1. Marketing Strategy                 14.3.23.5.2. Product Strategy                 14.3.23.5.3. Channel Strategy *The above list is indicative in nature and is subject to change during the course of research 15. Assumptions and Acronyms Used 16. Research Methodology

IBC Market

1. Executive Summary     1.1. Market Outlook     1.2. Market Analysis     1.3. Analysis and Recommendations 2. Market Overview     2.1. Market Coverage / Taxonomy     2.2. Market Definition / Scope / Limitations 3. Key Market Trends     3.1. Key Trends Impacting the Market     3.2. Product Innovation / Development Trends 4. Key Success Factors     4.1. Product Adoption / Usage Analysis     4.2. Product USP’s / Features     4.3. Strategic Promotional Strategies 5. Market Demand Analysis 2014 to 2022 and Forecast, 2023 to 2033     5.1. Historical Market Volume (Units) Analysis, 2014 to 2022     5.2. Current and Future Market Volume (Units) Projections, 2023 to 2033     5.3. Y-o-Y Growth Trend Analysis 6. Market - Pricing Analysis     6.1. Pricing Analysis     6.2. Average Pricing Analysis Benchmark 7. Market Demand (in Value or Size in US$ Million) Analysis 2014 to 2022 and Forecast, 2023 to 2033     7.1. Historical Market Value (US$ Million) Analysis, 2014 to 2022     7.2. Current and Future Market Value (US$ Million) Projections, 2023 to 2033         7.2.1. Y-o-Y Growth Trend Analysis         7.2.2. Absolute $ Opportunity Analysis 8. Market Background     8.1. Global Packaging Industry Overview     8.2. India Chemical Industry Overview     8.3. India Petroleum & Lubricants Overview     8.4. India Logistics Market Overview     8.5. India Industrial Packaging Market Overview     8.6. Macro-Economic Factors     8.7. Forecast Factors - Relevance & Impact     8.8. Value Chain         8.8.1. Raw Material Suppliers         8.8.2. IBC Manufacturers         8.8.3. End Users     8.9. COVID-19 Crisis – Impact Assessment         8.9.1. Current Statistics         8.9.2. Short-Mid-Long Term Outlook         8.9.3. Likely Rebound     8.10. Market Dynamics         8.10.1. Drivers         8.10.2. Restraints         8.10.3. Opportunity Analysis 9. Market Analysis 2014 to 2022 and Forecast 2023 to 2033, By Material     9.1. Introduction / Key Findings     9.2. Historical Market Size Value (US$ Million) & Volume (Units) Analysis By Material, 2014 to 2022     9.3. Current and Future Market Size Value (US$ Million) & Volume (Units) Analysis and Forecast By Material, 2023 to 2033         9.3.1. Cardboard         9.3.2. Composite     9.4. Y-o-Y Growth Trend Analysis By Material, 2014 to 2022     9.5. Absolute $ Opportunity Analysis By Material, 2023 to 2033 10. Market Analysis 2014 to 2022 and Forecast 2023 to 2033, By Content Type     10.1. Introduction / Key Findings     10.2. Historical Market Size Value (US$ Million) & Volume (Units) Analysis By Content Type, 2014 to 2022     10.3. Current and Future Market Size Value (US$ Million) & Volume (Units) Analysis and Forecast By Content Type, 2023 to 2033         10.3.1. Solid and Semi-solid         10.3.2. Liquid     10.4. Y–o–Y Growth Trend Analysis By Content Type, 2014 to 2022     10.5. Absolute $ Opportunity Analysis By Content Type, 2023 to 2033 11. Market Analysis 2014 to 2022 and Forecast 2023 to 2033, By End Use     11.1. Introduction / Key Findings     11.2. Historical Market Size Value (US$ Million) & Volume (Units) Analysis By End Use, 2014 to 2022     11.3. Current and Future Market Size Value (US$ Million) & Volume (Units) Analysis and Forecast By End Use, 2023 to 2033         11.3.1. Industrial Chemicals         11.3.2. Petroleum & Lubricants         11.3.3. Food         11.3.4. Beverages         11.3.5. Building & Construction         11.3.6. Healthcare & Pharmaceutical         11.3.7. Agricultural & Allied Products         11.3.8. Other Industrial Uses     11.4. Y-o-Y Growth Trend Analysis By End Use, 2014 to 2022     11.5. Absolute $ Opportunity Analysis By End Use, 2023 to 2033 12. Market Structure Analysis     12.1. Market Analysis by Tier of Companies (IBC)     12.2. Market Share Analysis of Top Players     12.3. Market Presence Analysis 13. Competition Analysis     13.1. Competition Dashboard     13.2. Competition Benchmarking     13.3. Competition Deep Dive         13.3.1. Grief Inc.             13.3.1.1. Overview             13.3.1.2. Product Portfolio             13.3.1.3. Profitability by Market Segments (Material/Content/End Use/Country)             13.3.1.4. Sales Footprint             13.3.1.5. Strategy Overview                 13.3.1.5.1. Marketing Strategy                 13.3.1.5.2. Product Strategy                 13.3.1.5.3. Channel Strategy         13.3.2. Mauser Group B.V.             13.3.2.1. Overview             13.3.2.2. Product Portfolio             13.3.2.3. Profitability by Market Segments (Material/Content/End Use/Country)             13.3.2.4. Sales Footprint             13.3.2.5. Strategy Overview                 13.3.2.5.1. Marketing Strategy                 13.3.2.5.2. Product Strategy                 13.3.2.5.3. Channel Strategy         13.3.3. Hanningfield             13.3.3.1. Overview             13.3.3.2. Product Portfolio             13.3.3.3. Profitability by Market Segments (Material/Content/End Use/Country)             13.3.3.4. Sales Footprint             13.3.3.5. Strategy Overview                 13.3.3.5.1. Marketing Strategy                 13.3.3.5.2. Product Strategy                 13.3.3.5.3. Channel Strategy         13.3.4. Sintex Plastics Technology Ltd             13.3.4.1. Overview             13.3.4.2. Product Portfolio             13.3.4.3. Profitability by Market Segments (Material/Content/End Use/Country)             13.3.4.4. Sales Footprint             13.3.4.5. Strategy Overview                 13.3.4.5.1. Marketing Strategy                 13.3.4.5.2. Product Strategy                 13.3.4.5.3. Channel Strategy         13.3.5. Pyramid Technoplast Pvt. Ltd             13.3.5.1. Overview             13.3.5.2. Product Portfolio             13.3.5.3. Profitability by Market Segments (Material/Content/End Use/Country)             13.3.5.4. Sales Footprint             13.3.5.5. Strategy Overview                 13.3.5.5.1. Marketing Strategy                 13.3.5.5.2. Product Strategy                 13.3.5.5.3. Channel Strategy         13.3.6. Vizag Chemicals Private Limited             13.3.6.1. Overview             13.3.6.2. Product Portfolio             13.3.6.3. Profitability by Market Segments (Material/Content/End Use/Country)             13.3.6.4. Sales Footprint             13.3.6.5. Strategy Overview                 13.3.6.5.1. Marketing Strategy                 13.3.6.5.2. Product Strategy                 13.3.6.5.3. Channel Strategy         13.3.7. Shree Dwarkesh Chem Industries             13.3.7.1. Overview             13.3.7.2. Product Portfolio             13.3.7.3. Profitability by Market Segments (Material/Content/End Use/Country)             13.3.7.4. Sales Footprint             13.3.7.5. Strategy Overview                 13.3.7.5.1. Marketing Strategy                 13.3.7.5.2. Product Strategy                 13.3.7.5.3. Channel Strategy         13.3.8. Balmer Lawrie & Co. Limited             13.3.8.1. Overview             13.3.8.2. Product Portfolio             13.3.8.3. Profitability by Market Segments (Material/Content/End Use/Country)             13.3.8.4. Sales Footprint             13.3.8.5. Strategy Overview                 13.3.8.5.1. Marketing Strategy                 13.3.8.5.2. Product Strategy                 13.3.8.5.3. Channel Strategy         13.3.9. Metal Seam Co. Pvt. Ltd             13.3.9.1. Overview             13.3.9.2. Product Portfolio             13.3.9.3. Profitability by Market Segments (Material/Content/End Use/Country)             13.3.9.4. Sales Footprint             13.3.9.5. Strategy Overview                 13.3.9.5.1. Marketing Strategy                 13.3.9.5.2. Product Strategy                 13.3.9.5.3. Channel Strategy         13.3.10. The East India Drums & Barrels Mfg. Co.             13.3.10.1. Overview             13.3.10.2. Product Portfolio             13.3.10.3. Profitability by Market Segments (Material/Content/End Use/Country)             13.3.10.4. Sales Footprint             13.3.10.5. Strategy Overview                 13.3.10.5.1. Marketing Strategy                 13.3.10.5.2. Product Strategy                 13.3.10.5.3. Channel Strategy         13.3.11. Sicagen India Limited             13.3.11.1. Overview             13.3.11.2. Product Portfolio             13.3.11.3. Profitability by Market Segments (Material/Content/End Use/Country)             13.3.11.4. Sales Footprint             13.3.11.5. Strategy Overview                 13.3.11.5.1. Marketing Strategy                 13.3.11.5.2. Product Strategy                 13.3.11.5.3. Channel Strategy         13.3.12. Industrial Engineering Corporation             13.3.12.1. Overview             13.3.12.2. Product Portfolio             13.3.12.3. Profitability by Market Segments (Material/Content/End Use/Country)             13.3.12.4. Sales Footprint             13.3.12.5. Strategy Overview                 13.3.12.5.1. Marketing Strategy                 13.3.12.5.2. Product Strategy                 13.3.12.5.3. Channel Strategy         13.3.13. Tripura Containers Private Limited             13.3.13.1. Overview             13.3.13.2. Product Portfolio             13.3.13.3. Profitability by Market Segments (Material/Content/End Use/Country)             13.3.13.4. Sales Footprint             13.3.13.5. Strategy Overview                 13.3.13.5.1. Marketing Strategy                 13.3.13.5.2. Product Strategy                 13.3.13.5.3. Channel Strategy         13.3.14. ABCD Drums & Barrels Industries             13.3.14.1. Overview             13.3.14.2. Product Portfolio             13.3.14.3. Profitability by Market Segments (Material/Content/End Use/Country)             13.3.14.4. Sales Footprint             13.3.14.5. Strategy Overview                 13.3.14.5.1. Marketing Strategy                 13.3.14.5.2. Product Strategy                 13.3.14.5.3. Channel Strategy         13.3.15. Pearson Drums & Barrels Private Limited             13.3.15.1. Overview             13.3.15.2. Product Portfolio             13.3.15.3. Profitability by Market Segments (Material/Head Type/Content/End Use/Country)             13.3.15.4. Sales Footprint             13.3.15.5. Strategy Overview                 13.3.15.5.1. Marketing Strategy                 13.3.15.5.2. Product Strategy                 13.3.15.5.3. Channel Strategy         13.3.16. Vimal Barrels Pvt. Ltd.             13.3.16.1. Overview             13.3.16.2. Product Portfolio             13.3.16.3. Profitability by Market Segments (Material/Content/End Use/Country)             13.3.16.4. Sales Footprint             13.3.16.5. Strategy Overview                 13.3.16.5.1. Marketing Strategy                 13.3.16.5.2. Product Strategy                 13.3.16.5.3. Channel Strategy         13.3.17. Kumar Containers Pvt. Ltd             13.3.17.1. Overview             13.3.17.2. Product Portfolio             13.3.17.3. Profitability by Market Segments (Material/Content/End Use/Country)             13.3.17.4. Sales Footprint             13.3.17.5. Strategy Overview                 13.3.17.5.1. Marketing Strategy                 13.3.17.5.2. Product Strategy                 13.3.17.5.3. Channel Strategy         13.3.18. Scoya Pharmatech             13.3.18.1. Overview             13.3.18.2. Product Portfolio             13.3.18.3. Profitability by Market Segments (Material/Content/End Use/Country)             13.3.18.4. Sales Footprint             13.3.18.5. Strategy Overview                 13.3.18.5.1. Marketing Strategy                 13.3.18.5.2. Product Strategy                 13.3.18.5.3. Channel Strategy         13.3.19. Agarwal Packaging Pvt. Ltd             13.3.19.1. Overview             13.3.19.2. Product Portfolio             13.3.19.3. Profitability by Market Segments (Material/Content/End Use/Country)             13.3.19.4. Sales Footprint             13.3.19.5. Strategy Overview                 13.3.19.5.1. Marketing Strategy                 13.3.19.5.2. Product Strategy                 13.3.19.5.3. Channel Strategy         13.3.20. Nakoda Containers Private Limited             13.3.20.1. Overview             13.3.20.2. Product Portfolio             13.3.20.3. Profitability by Market Segments (Material/Content/End Use/Country)             13.3.20.4. Sales Footprint             13.3.20.5. Strategy Overview                 13.3.20.5.1. Marketing Strategy                 13.3.20.5.2. Product Strategy                 13.3.20.5.3. Channel Strategy         13.3.21. Gujarat Polythene             13.3.21.1. Overview             13.3.21.2. Product Portfolio             13.3.21.3. Profitability by Market Segments (Material/Content/End Use/Country)             13.3.21.4. Sales Footprint             13.3.21.5. Strategy Overview                 13.3.21.5.1. Marketing Strategy                 13.3.21.5.2. Product Strategy                 13.3.21.5.3. Channel Strategy         13.3.22. Supreme Industries             13.3.22.1. Overview             13.3.22.2. Product Portfolio             13.3.22.3. Profitability by Market Segments (Material/Content/End Use/Country)             13.3.22.4. Sales Footprint             13.3.22.5. Strategy Overview                 13.3.22.5.1. Marketing Strategy                 13.3.22.5.2. Product Strategy                 13.3.22.5.3. Channel Strategy         13.3.23. MAHIMA Drums Manufacturing Co.             13.3.23.1. Overview             13.3.23.2. Product Portfolio             13.3.23.3. Profitability by Market Segments (Material/Content/End Use/Country)             13.3.23.4. Sales Footprint             13.3.23.5. Strategy Overview                 13.3.23.5.1. Marketing Strategy                 13.3.23.5.2. Product Strategy                 13.3.23.5.3. Channel Strategy *The above list is indicative in nature and is subject to change during the course of research 14. Assumptions and Acronyms Used 15. Research Methodology

Explore Packaging Insights

View Reports
Future Market Insights

India Steel Drum & IBC Market

Schedule a Call