India Outbound Tourism Market Size and Share Forecast Outlook (2024 to 2034)

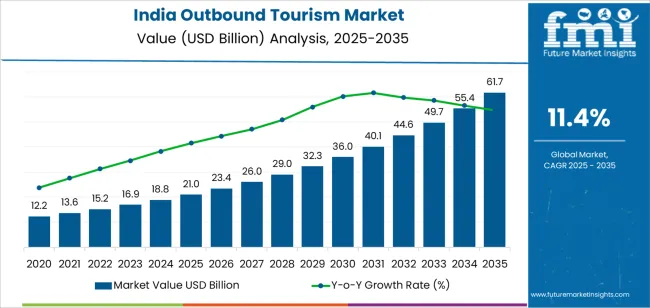
India's outbound tourism market is projected to reach USD 18817.72 million in 2024 and expand at 11.4% CAGR between 2024 and 2034.

The growth in the market is primarily attributed to the increasing desire of Indians, especially millennials, to visit international destinations. The market value is projected to reach USD 55388.41 million by 2034.

Key Market Drivers

Regions such as Europe and Latin America are improving tourism to enhance their businesses. This is considered to aid the growth of India's outbound tourism market over the forecast period. Several other reasons are also leading to the growth of India’s outbound tourism market:

  • Expanding global connectivity, with more direct flight routes and competitive airfares, making international travel more accessible and affordable for Indians
  • Increasing affluence and discretionary spending power among the Indian population, driving demand for international travel experiences
  • Growing desire for experiential travel and cultural exploration among Indian travelers, especially millennials, fuelling the demand for outbound tourism.
  • Rising internet penetration, facilitating easier access to travel information and booking platforms and encouraging more Indians to venture abroad
  • Government initiatives promoting international tourism and easing visa restrictions, pushing Indians to explore foreign destinations
  • The influence of social media showcasing exotic destinations and travel experiences, inspiring Indians to travel abroad
  • Emergence of affordable travel packages and discounts offered by travel agencies, attracting more Indian tourists to international destinations
  • Expansion of international hotel chains and accommodations catering to Indian tourists, enhancing the overall travel experience
  • Increasing awareness about health and wellness tourism, encouraging outbound travel for rejuvenation and relaxation purposes among Indians
Attributes Key Statistics
Expected Base Year Value (2024) USD 18817.72 million
Anticipated Forecast Value (2034) USD 55388.41 million
Estimated Growth (2024 to 2034) 11.40% CAGR

Key Trends Reshaping the India Outbound Tourism Market

  • Growing interest in culinary experiences, including food tours, cooking classes, and gastronomic adventures, to explore diverse cuisines globally
  • Travelers are increasingly relying on technology for trip planning, booking, and personalized experiences, with virtual reality tours and AI-driven recommendations gaining popularity
  • Solo travel is gaining acceptance and preference among Indian tourists, particularly millennials and Gen Z
  • Adventure tourism is on the rise, with activities such as trekking, camping, wildlife safaris, and water sports becoming more popular
  • Wellness tourism is also gaining momentum, with health-conscious travelers seeking out yoga retreats, meditation centers, and spa resorts for rejuvenation and relaxation

How Political Instability and Economic Factors May Impact Growth

The India outbound tourism market is anticipated to grow at a modest CAGR of 4.20% till 2034. This is attributed to several reasons:

  • During economic recessions or slowdowns, people tend to have less disposable income. This can lead to decreased spending on non-essential items such as travel.
  • Regions experiencing political instability, conflicts, or terrorism concerns also deter travelers from visiting those destinations.
  • Complex visa regulations and application processes for certain countries significantly discourage people from traveling abroad
  • Inadequate transportation infrastructure, including airports, roads, and public transportation, also hinders travel convenience and accessibility
  • The demand for international travel among certain segments of the population may reduce due to shifting consumer preferences towards alternative leisure activities or experiences

Category-wise Insights in the India Outbound Tourism Industry

Growing Penetration of Online Booking Channels to Boost India's Outbound Tourism Market

Attributes Details
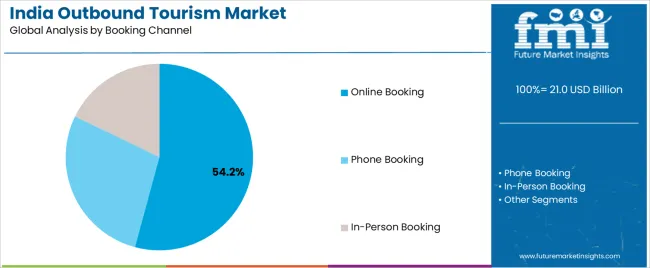
Booking Channel Online Booking
Market Share 45.70%

The online booking category is projected to hold the largest share of the Indian outbound tourism market in 2024. This segment holds the dominant market share, accounting for 45.70% of India's global outbound tourism market.

  • The increasing popularity of online booking channels is driving the market's growth as they offer a wide range of travel options, catering to the diverse preferences of Indian travelers.
  • The proliferation of smartphones and internet connectivity has democratized access to travel information and booking services. This has empowered more Indians to plan and book their trips independently.

Packaged Travelers to Generate Maximum Revenue in India's Outbound Tourism Market

Attributes Details
Tour Type Packaged Traveller
Market Share 39.20%

The India outbound tourism market is also categorized by tour type into independent and package travelers. The packaged traveler segment dominates the market with a share of 39.20% in 2024.

  • Packaged travelers choose pre-planned tour packages from travel agencies or online platforms. This contributes significantly to the market's revenue due to their bundled services and convenience.
  • The demand for customized travel experiences and convenience is on the rise. This is also expected to increase the popularity of packaged tours further and drive revenue growth in India's outbound tourism market.

Competitive Landscape of the India Outbound Tourism Market

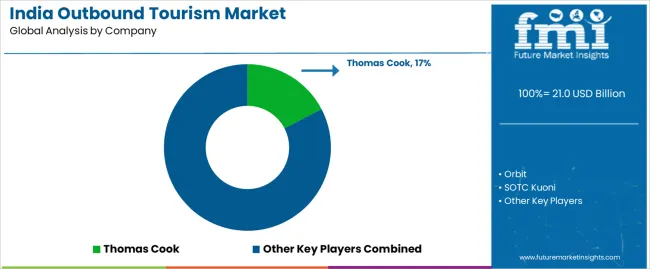
The market for outbound tourism in India is very competitive and consists of numerous players fighting for their place there. Some of the most prominent companies in the market are Orbit, Thomas Cook, SOTC Kuoni, Raj Travels, In Orbit Tours, and Kesari.

These companies are expanding their customer base with attractive packages, customized tour trips, and services. These companies are also introducing all-inclusive luxury packages, such as The Grand Voyage by Thomas Cook India Limited, to a luxurious vacation experience with all amenities across various cities in India, starting from Mumbai to Delhi.

Recent Developments

  • In November 2023, the Director of Tourism Jammu inaugurated India Travel Mart Jammu at KC Regalia, attended by tourism delegates, hoteliers, and travel agents. The event, meticulously planned by the Directorate of Tourism, aimed to promote tourism through networking and showcasing pavilions from various states and hotel participants.
  • In April 2023, Kesari Tours inaugurated a new office in Kashmir, expanding its operations in tourism and hospitality. Prominent figures from the industry attended the event. The company aimed to provide employment opportunities and enhance its regional presence.

Key Companies in the Indian Outbound Travel Industry

  • Orbit
  • Thomas Cook
  • SOTC Kuoni
  • Raj Travels
  • In Orbit Tours
  • Cox and Kings
  • TCI
  • Kesari
  • Travelmart India
  • Riya Travels
  • Akbar Travels
  • BTI Sita
  • BCD Travels
  • Mercury Travels
  • Gold Chip
  • Kesari
  • Amadeus

Scope and Coverage of the India Outbound Tourism Report

  • General Insights on the Outbound Tourism in India
  • Outbound Tourism Destinations in India
  • Key Outbound Travel Agencies in India
  • Indian Outbound Tourism Statistics
  • Outbound Travel and Tourism in India

Top Segments Studied in the India Outbound Tourism Market

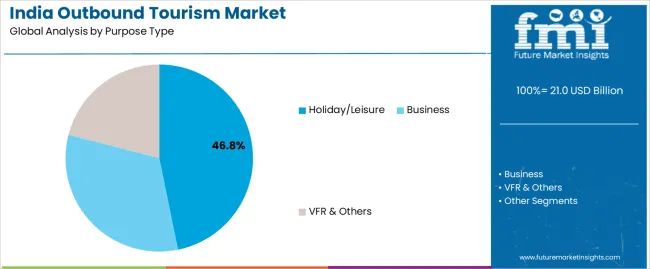
By Purpose Type:

  • Business
  • Holiday/Leisure
  • VFR & Others

By Booking Channel:

  • Phone Booking
  • Online Booking
  • In-person Booking

By Tourist Type:

  • Domestic
  • International

By Tourism Type:

  • Cultural and Heritage Tourism
  • Medical Tourism
  • Eco/Sustainable Tourism
  • Sports Tourism
  • Wellness Tourism and Others

By Tour Type:

  • Independent Traveller
  • Package Traveller
  • Tour Group

By Consumer Orientation:

  • Men
  • Women

By Age Group:

  • 15 to 25 Years
  • 26 to 35 Years
  • 36 to 45 Years
  • 46 to 65 Years
  • 66 to 75 Years

By Region:

  • North America
  • Latin America
  • Asia Pacific
  • Middle East and Africa (MEA)
  • Europe

Table of Content

  • 1. Executive Summary
  • 2. Market Overview
  • 3. Market Background
  • 4. Market Analysis 2019 to 2023 and Forecast, 2024 to 2034
  • 5. Market Analysis 2019 to 2023 and Forecast 2024 to 2034, By Purpose Type
    • 5.1. Business Tourism
    • 5.2. Holiday/Leisure Tourism
    • 5.3. VFR Tourism (Visiting Friends and Relatives)
  • 6. Market Analysis 2019 to 2023 and Forecast 2024 to 2034, By Booking Channel
    • 6.1. Phone Booking
    • 6.2. Online Booking
    • 6.3. In Person Booking
  • 7. Market Analysis 2019 to 2023 and Forecast 2024 to 2034, By Tourist Type
    • 7.1. Domestic Tourist
    • 7.2. International Tourist
  • 8. Market Analysis 2019 to 2023 and Forecast 2024 to 2034, By Tourism Type
    • 8.1. Cultural & Heritage Tourism
    • 8.2. Medical Tourism
    • 8.3. Eco/Sustainable Tourism
    • 8.4. Sports Tourism
    • 8.5. Wellness Tourism
    • 8.6. Others
  • 9. Market Analysis 2019 to 2023 and Forecast 2024 to 2034, By Tour Type
    • 9.1. Independent Traveller
    • 9.2. Package Traveller
    • 9.3. Tour Group
  • 10. Market Analysis 2019 to 2023 and Forecast 2024 to 2034, By Tourist Gender
    • 10.1. Men
    • 10.2. Women
  • 11. Market Analysis 2019 to 2023 and Forecast 2024 to 2034, By Age Group
    • 11.1. 15-25 Years
    • 11.2. 26-35 Years
    • 11.3. 36-45 Years
    • 11.4. 46-55 Years
    • 11.5. 56-65 Years
    • 11.6. 66-75 Years
    • 11.7. More Than 75 Years
  • 12. Market Analysis 2019 to 2023 and Forecast 2024 to 2034, By Region
    • 12.1. North (India)
    • 12.2. East (India)
    • 12.3. West (India)
    • 12.4. South (India)
  • 13. North Market Analysis 2019 to 2023 and Forecast 2024 to 2034
  • 14. East Market Analysis 2019 to 2023 and Forecast 2024 to 2034
  • 15. West Market Analysis 2019 to 2023 and Forecast 2024 to 2034
  • 16. South Market Analysis 2019 to 2023 and Forecast 2024 to 2034
  • 17. Market Structure Analysis
  • 18. Competition Analysis
    • 18.1. Akbar Travels
    • 18.2. Thomas Cook
    • 18.3. Mercury Travels
    • 18.4. Raj Travels
    • 18.5. In Orbit Tours
    • 18.6. Cox and Kings
    • 18.7. BCD Travels
    • 18.8. Kesari
    • 18.9. Travelmart India
    • 18.10. Riya Travels
  • 19. Assumptions & Acronyms Used
  • 20. Research Methodology

List of Tables

Table 1: Market Value (US$ Million) Forecast by Region, 2019 to 2034

Table 2: Market Value (US$ Million) Forecast by Purpose Type, 2019 to 2034

Table 3: Market Value (US$ Million) Forecast by Booking Channel, 2019 to 2034

Table 4: Market Value (US$ Million) Forecast by Tourist Type, 2019 to 2034

Table 5: Market Value (US$ Million) Forecast by Tourism Type, 2019 to 2034

Table 6: Market Value (US$ Million) Forecast by Tour Type, 2019 to 2034

Table 7: Market Value (US$ Million) Forecast by Consumer Orientation, 2019 to 2034

Table 8: Market Value (US$ Million) Forecast by Age Group, 2019 to 2034

Table 9: North Market Value (US$ Million) Forecast by Purpose Type, 2019 to 2034

Table 10: North Market Value (US$ Million) Forecast by Booking Channel, 2019 to 2034

Table 11: North Market Value (US$ Million) Forecast by Tourist Type, 2019 to 2034

Table 12: North Market Value (US$ Million) Forecast by Tourism Type, 2019 to 2034

Table 13: North Market Value (US$ Million) Forecast by Tour Type, 2019 to 2034

Table 14: North Market Value (US$ Million) Forecast by Consumer Orientation, 2019 to 2034

Table 15: North Market Value (US$ Million) Forecast by Age Group, 2019 to 2034

Table 16: East Market Value (US$ Million) Forecast by Purpose Type, 2019 to 2034

Table 17: East Market Value (US$ Million) Forecast by Booking Channel, 2019 to 2034

Table 18: East Market Value (US$ Million) Forecast by Tourist Type, 2019 to 2034

Table 19: East Market Value (US$ Million) Forecast by Tourism Type, 2019 to 2034

Table 20: East Market Value (US$ Million) Forecast by Tour Type, 2019 to 2034

Table 21: East Market Value (US$ Million) Forecast by Consumer Orientation, 2019 to 2034

Table 22: East Market Value (US$ Million) Forecast by Age Group, 2019 to 2034

Table 23: West Market Value (US$ Million) Forecast by Purpose Type, 2019 to 2034

Table 24: West Market Value (US$ Million) Forecast by Booking Channel, 2019 to 2034

Table 25: West Market Value (US$ Million) Forecast by Tourist Type, 2019 to 2034

Table 26: West Market Value (US$ Million) Forecast by Tourism Type, 2019 to 2034

Table 27: West Market Value (US$ Million) Forecast by Tour Type, 2019 to 2034

Table 28: West Market Value (US$ Million) Forecast by Consumer Orientation, 2019 to 2034

Table 29: West Market Value (US$ Million) Forecast by Age Group, 2019 to 2034

Table 30: South Market Value (US$ Million) Forecast by Purpose Type, 2019 to 2034

Table 31: South Market Value (US$ Million) Forecast by Booking Channel, 2019 to 2034

Table 32: South Market Value (US$ Million) Forecast by Tourist Type, 2019 to 2034

Table 33: South Market Value (US$ Million) Forecast by Tourism Type, 2019 to 2034

Table 34: South Market Value (US$ Million) Forecast by Tour Type, 2019 to 2034

Table 35: South Market Value (US$ Million) Forecast by Consumer Orientation, 2019 to 2034

Table 36: South Market Value (US$ Million) Forecast by Age Group, 2019 to 2034

List of Figures

Figure 1: Market Value (US$ Million) by Purpose Type, 2024 to 2034

Figure 2: Market Value (US$ Million) by Booking Channel, 2024 to 2034

Figure 3: Market Value (US$ Million) by Tourist Type, 2024 to 2034

Figure 4: Market Value (US$ Million) by Tourism Type, 2024 to 2034

Figure 5: Market Value (US$ Million) by Tour Type, 2024 to 2034

Figure 6: Market Value (US$ Million) by Consumer Orientation, 2024 to 2034

Figure 7: Market Value (US$ Million) by Age Group, 2024 to 2034

Figure 8: Market Value (US$ Million) by Region, 2024 to 2034

Figure 9: Market Value (US$ Million) Analysis by Region, 2019 to 2034

Figure 10: Market Value Share (%) and BPS Analysis by Region, 2024 to 2034

Figure 11: Market Y-o-Y Growth (%) Projections by Region, 2024 to 2034

Figure 12: Market Value (US$ Million) Analysis by Purpose Type, 2019 to 2034

Figure 13: Market Value Share (%) and BPS Analysis by Purpose Type, 2024 to 2034

Figure 14: Market Y-o-Y Growth (%) Projections by Purpose Type, 2024 to 2034

Figure 15: Market Value (US$ Million) Analysis by Booking Channel, 2019 to 2034

Figure 16: Market Value Share (%) and BPS Analysis by Booking Channel, 2024 to 2034

Figure 17: Market Y-o-Y Growth (%) Projections by Booking Channel, 2024 to 2034

Figure 18: Market Value (US$ Million) Analysis by Tourist Type, 2019 to 2034

Figure 19: Market Value Share (%) and BPS Analysis by Tourist Type, 2024 to 2034

Figure 20: Market Y-o-Y Growth (%) Projections by Tourist Type, 2024 to 2034

Figure 21: Market Value (US$ Million) Analysis by Tourism Type, 2019 to 2034

Figure 22: Market Value Share (%) and BPS Analysis by Tourism Type, 2024 to 2034

Figure 23: Market Y-o-Y Growth (%) Projections by Tourism Type, 2024 to 2034

Figure 24: Market Value (US$ Million) Analysis by Tour Type, 2019 to 2034

Figure 25: Market Value Share (%) and BPS Analysis by Tour Type, 2024 to 2034

Figure 26: Market Y-o-Y Growth (%) Projections by Tour Type, 2024 to 2034

Figure 27: Market Value (US$ Million) Analysis by Consumer Orientation, 2019 to 2034

Figure 28: Market Value Share (%) and BPS Analysis by Consumer Orientation, 2024 to 2034

Figure 29: Market Y-o-Y Growth (%) Projections by Consumer Orientation, 2024 to 2034

Figure 30: Market Value (US$ Million) Analysis by Age Group, 2019 to 2034

Figure 31: Market Value Share (%) and BPS Analysis by Age Group, 2024 to 2034

Figure 32: Market Y-o-Y Growth (%) Projections by Age Group, 2024 to 2034

Figure 33: Market Attractiveness by Purpose Type, 2024 to 2034

Figure 34: Market Attractiveness by Booking Channel, 2024 to 2034

Figure 35: Market Attractiveness by Tourist Type, 2024 to 2034

Figure 36: Market Attractiveness by Tourism Type, 2024 to 2034

Figure 37: Market Attractiveness by Tour Type, 2024 to 2034

Figure 38: Market Attractiveness by Consumer Orientation, 2024 to 2034

Figure 39: Market Attractiveness by Age Group, 2024 to 2034

Figure 40: Market Attractiveness by Region, 2024 to 2034

Figure 41: North Market Value (US$ Million) by Purpose Type, 2024 to 2034

Figure 42: North Market Value (US$ Million) by Booking Channel, 2024 to 2034

Figure 43: North Market Value (US$ Million) by Tourist Type, 2024 to 2034

Figure 44: North Market Value (US$ Million) by Tourism Type, 2024 to 2034

Figure 45: North Market Value (US$ Million) by Tour Type, 2024 to 2034

Figure 46: North Market Value (US$ Million) by Consumer Orientation, 2024 to 2034

Figure 47: North Market Value (US$ Million) Analysis by Purpose Type, 2019 to 2034

Figure 48: North Market Value Share (%) and BPS Analysis by Purpose Type, 2024 to 2034

Figure 49: North Market Y-o-Y Growth (%) Projections by Purpose Type, 2024 to 2034

Figure 50: North Market Value (US$ Million) Analysis by Booking Channel, 2019 to 2034

Figure 51: North Market Value Share (%) and BPS Analysis by Booking Channel, 2024 to 2034

Figure 52: North Market Y-o-Y Growth (%) Projections by Booking Channel, 2024 to 2034

Figure 53: North Market Value (US$ Million) Analysis by Tourist Type, 2019 to 2034

Figure 54: North Market Value Share (%) and BPS Analysis by Tourist Type, 2024 to 2034

Figure 55: North Market Y-o-Y Growth (%) Projections by Tourist Type, 2024 to 2034

Figure 56: North Market Value (US$ Million) Analysis by Tourism Type, 2019 to 2034

Figure 57: North Market Value Share (%) and BPS Analysis by Tourism Type, 2024 to 2034

Figure 58: North Market Y-o-Y Growth (%) Projections by Tourism Type, 2024 to 2034

Figure 59: North Market Value (US$ Million) Analysis by Tour Type, 2019 to 2034

Figure 60: North Market Value Share (%) and BPS Analysis by Tour Type, 2024 to 2034

Figure 61: North Market Y-o-Y Growth (%) Projections by Tour Type, 2024 to 2034

Figure 62: North Market Value (US$ Million) Analysis by Consumer Orientation, 2019 to 2034

Figure 63: North Market Value Share (%) and BPS Analysis by Consumer Orientation, 2024 to 2034

Figure 64: North Market Y-o-Y Growth (%) Projections by Consumer Orientation, 2024 to 2034

Figure 65: North Market Value (US$ Million) Analysis by Age Group, 2019 to 2034

Figure 66: North Market Value Share (%) and BPS Analysis by Age Group, 2024 to 2034

Figure 67: North Market Y-o-Y Growth (%) Projections by Age Group, 2024 to 2034

Figure 68: North Market Attractiveness by Purpose Type, 2024 to 2034

Figure 69: North Market Attractiveness by Booking Channel, 2024 to 2034

Figure 70: North Market Attractiveness by Tourist Type, 2024 to 2034

Figure 71: North Market Attractiveness by Tourism Type, 2024 to 2034

Figure 72: North Market Attractiveness by Tour Type, 2024 to 2034

Figure 73: North Market Attractiveness by Consumer Orientation, 2024 to 2034

Figure 74: North Market Attractiveness by Age Group, 2024 to 2034

Figure 75: East Market Value (US$ Million) by Purpose Type, 2024 to 2034

Figure 76: East Market Value (US$ Million) by Booking Channel, 2024 to 2034

Figure 77: East Market Value (US$ Million) by Tourist Type, 2024 to 2034

Figure 78: East Market Value (US$ Million) by Tourism Type, 2024 to 2034

Figure 79: East Market Value (US$ Million) by Tour Type, 2024 to 2034

Figure 80: East Market Value (US$ Million) by Consumer Orientation, 2024 to 2034

Figure 81: East Market Value (US$ Million) by Age Group, 2024 to 2034

Figure 82: East Market Value (US$ Million) Analysis by Purpose Type, 2019 to 2034

Figure 83: East Market Value Share (%) and BPS Analysis by Purpose Type, 2024 to 2034

Figure 84: East Market Y-o-Y Growth (%) Projections by Purpose Type, 2024 to 2034

Figure 85: East Market Value (US$ Million) Analysis by Booking Channel, 2019 to 2034

Figure 86: East Market Value Share (%) and BPS Analysis by Booking Channel, 2024 to 2034

Figure 87: East Market Y-o-Y Growth (%) Projections by Booking Channel, 2024 to 2034

Figure 88: East Market Value (US$ Million) Analysis by Tourist Type, 2019 to 2034

Figure 89: East Market Value Share (%) and BPS Analysis by Tourist Type, 2024 to 2034

Figure 90: East Market Y-o-Y Growth (%) Projections by Tourist Type, 2024 to 2034

Figure 91: East Market Value (US$ Million) Analysis by Tourism Type, 2019 to 2034

Figure 92: East Market Value Share (%) and BPS Analysis by Tourism Type, 2024 to 2034

Figure 93: East Market Y-o-Y Growth (%) Projections by Tourism Type, 2024 to 2034

Figure 94: East Market Value (US$ Million) Analysis by Tour Type, 2019 to 2034

Figure 95: East Market Value Share (%) and BPS Analysis by Tour Type, 2024 to 2034

Figure 96: East Market Y-o-Y Growth (%) Projections by Tour Type, 2024 to 2034

Figure 97: East Market Value (US$ Million) Analysis by Consumer Orientation, 2019 to 2034

Figure 98: East Market Value Share (%) and BPS Analysis by Consumer Orientation, 2024 to 2034

Figure 99: East Market Y-o-Y Growth (%) Projections by Consumer Orientation, 2024 to 2034

Figure 100: East Market Value (US$ Million) Analysis by Age Group, 2019 to 2034

Figure 101: East Market Value Share (%) and BPS Analysis by Age Group, 2024 to 2034

Figure 102: East Market Y-o-Y Growth (%) Projections by Age Group, 2024 to 2034

Figure 103: East Market Attractiveness by Purpose Type, 2024 to 2034

Figure 104: East Market Attractiveness by Booking Channel, 2024 to 2034

Figure 105: East Market Attractiveness by Tourist Type, 2024 to 2034

Figure 106: East Market Attractiveness by Tourism Type, 2024 to 2034

Figure 107: East Market Attractiveness by Tour Type, 2024 to 2034

Figure 108: East Market Attractiveness by Consumer Orientation, 2024 to 2034

Figure 109: East Market Attractiveness by Age Group, 2024 to 2034

Figure 110: West Market Value (US$ Million) by Purpose Type, 2024 to 2034

Figure 111: West Market Value (US$ Million) by Booking Channel, 2024 to 2034

Figure 112: West Market Value (US$ Million) by Tourist Type, 2024 to 2034

Figure 113: West Market Value (US$ Million) by Tourism Type, 2024 to 2034

Figure 114: West Market Value (US$ Million) by Tour Type, 2024 to 2034

Figure 115: West Market Value (US$ Million) by Consumer Orientation, 2024 to 2034

Figure 116: West Market Value (US$ Million) by Age Group, 2024 to 2034

Figure 117: West Market Value (US$ Million) Analysis by Purpose Type, 2019 to 2034

Figure 118: West Market Value Share (%) and BPS Analysis by Purpose Type, 2024 to 2034

Figure 119: West Market Y-o-Y Growth (%) Projections by Purpose Type, 2024 to 2034

Figure 120: West Market Value (US$ Million) Analysis by Booking Channel, 2019 to 2034

Figure 121: West Market Value Share (%) and BPS Analysis by Booking Channel, 2024 to 2034

Figure 122: West Market Y-o-Y Growth (%) Projections by Booking Channel, 2024 to 2034

Figure 123: West Market Value (US$ Million) Analysis by Tourist Type, 2019 to 2034

Figure 124: West Market Value Share (%) and BPS Analysis by Tourist Type, 2024 to 2034

Figure 125: West Market Y-o-Y Growth (%) Projections by Tourist Type, 2024 to 2034

Figure 126: West Market Value (US$ Million) Analysis by Tourism Type, 2019 to 2034

Figure 127: West Market Value Share (%) and BPS Analysis by Tourism Type, 2024 to 2034

Figure 128: West Market Y-o-Y Growth (%) Projections by Tourism Type, 2024 to 2034

Figure 129: West Market Value (US$ Million) Analysis by Tour Type, 2019 to 2034

Figure 130: West Market Value Share (%) and BPS Analysis by Tour Type, 2024 to 2034

Figure 131: West Market Y-o-Y Growth (%) Projections by Tour Type, 2024 to 2034

Figure 132: West Market Value (US$ Million) Analysis by Consumer Orientation, 2019 to 2034

Figure 133: West Market Value Share (%) and BPS Analysis by Consumer Orientation, 2024 to 2034

Figure 134: West Market Y-o-Y Growth (%) Projections by Consumer Orientation, 2024 to 2034

Figure 135: West Market Value (US$ Million) Analysis by Age Group, 2019 to 2034

Figure 136: West Market Value Share (%) and BPS Analysis by Age Group, 2024 to 2034

Figure 137: West Market Y-o-Y Growth (%) Projections by Age Group, 2024 to 2034

Figure 138: West Market Attractiveness by Purpose Type, 2024 to 2034

Figure 139: West Market Attractiveness by Booking Channel, 2024 to 2034

Figure 140: West Market Attractiveness by Tourist Type, 2024 to 2034

Figure 141: West Market Attractiveness by Tourism Type, 2024 to 2034

Figure 142: West Market Attractiveness by Tour Type, 2024 to 2034

Figure 143: West Market Attractiveness by Consumer Orientation, 2024 to 2034

Figure 144: West Market Attractiveness by Age Group, 2024 to 2034

Figure 145: South Market Value (US$ Million) by Purpose Type, 2024 to 2034

Figure 146: South Market Value (US$ Million) by Booking Channel, 2024 to 2034

Figure 147: South Market Value (US$ Million) by Tourist Type, 2024 to 2034

Figure 148: South Market Value (US$ Million) by Tourism Type, 2024 to 2034

Figure 149: South Market Value (US$ Million) by Tour Type, 2024 to 2034

Figure 150: South Market Value (US$ Million) by Consumer Orientation, 2024 to 2034

Figure 151: South Market Value (US$ Million) by Age Group, 2024 to 2034

Figure 152: South Market Value (US$ Million) Analysis by Purpose Type, 2019 to 2034

Figure 153: South Market Value Share (%) and BPS Analysis by Purpose Type, 2024 to 2034

Figure 154: South Market Y-o-Y Growth (%) Projections by Purpose Type, 2024 to 2034

Figure 155: South Market Value (US$ Million) Analysis by Booking Channel, 2019 to 2034

Figure 156: South Market Value Share (%) and BPS Analysis by Booking Channel, 2024 to 2034

Figure 157: South Market Y-o-Y Growth (%) Projections by Booking Channel, 2024 to 2034

Figure 158: South Market Value (US$ Million) Analysis by Tourist Type, 2019 to 2034

Figure 159: South Market Value Share (%) and BPS Analysis by Tourist Type, 2024 to 2034

Figure 160: South Market Y-o-Y Growth (%) Projections by Tourist Type, 2024 to 2034

Figure 161: South Market Value (US$ Million) Analysis by Tourism Type, 2019 to 2034

Figure 162: South Market Value Share (%) and BPS Analysis by Tourism Type, 2024 to 2034

Figure 163: South Market Y-o-Y Growth (%) Projections by Tourism Type, 2024 to 2034

Figure 164: South Market Value (US$ Million) Analysis by Tour Type, 2019 to 2034

Figure 165: South Market Value Share (%) and BPS Analysis by Tour Type, 2024 to 2034

Figure 166: South Market Y-o-Y Growth (%) Projections by Tour Type, 2024 to 2034

Figure 167: South Market Value (US$ Million) Analysis by Consumer Orientation, 2019 to 2034

Figure 168: South Market Value Share (%) and BPS Analysis by Consumer Orientation, 2024 to 2034

Figure 169: South Market Y-o-Y Growth (%) Projections by Consumer Orientation, 2024 to 2034

Figure 170: South Market Value (US$ Million) Analysis by Age Group, 2019 to 2034

Figure 171: South Market Value Share (%) and BPS Analysis by Age Group, 2024 to 2034

Figure 172: South Market Y-o-Y Growth (%) Projections by Age Group, 2024 to 2034

Figure 173: South Market Attractiveness by Purpose Type, 2024 to 2034

Figure 174: South Market Attractiveness by Booking Channel, 2024 to 2034

Figure 175: South Market Attractiveness by Tourist Type, 2024 to 2034

Figure 176: South Market Attractiveness by Tourism Type, 2024 to 2034

Figure 177: South Market Attractiveness by Tour Type, 2024 to 2034

Figure 178: South Market Attractiveness by Consumer Orientation, 2024 to 2034

Figure 179: South Market Attractiveness by Age Group, 2024 to 2034

Frequently Asked Questions

How much is the Indian outbound tourism Market Currently Worth?

The India outbound tourism market is expected to be worth USD 18817.72 million by 2024.

What is the Sales Forecast for India's outbound tourism through 2034?

India's outbound tourism market is expected to reach USD 55388.41 million by 2034.

At what rate is India's Outbound Tourism Market growing?

The India outbound tourism market is growing at a CAGR of 11.40% from 2024 to 2034.

Who are the key Companies in the Indian Outbound Tourism Market?

Orbit, Thomas Cook, SOTC Kuoni, Raj Travels, In Orbit Tours, Kesari, etc., are some of the major players in the market for India outbound tourism.

What was the overall Value of the India Outbound Tourism Market in 2023?

The India outbound tourism market valuation in 2023 was USD 16892.03 million.

Explore Similar Insights

Future Market Insights

India Outbound Tourism Market