India decorative veneer industry is projected to grow from USD 296.8 million in 2025 to approximately USD 474.3 million by 2035, recording an absolute increase of USD 177.5 million over the forecast period. This translates into total growth of 59.8%, with demand forecast to expand at a compound annual growth rate (CAGR) of 4.8% between 2025 and 2035. Overall sales are expected to grow by nearly 1.60X during the same period, supported by accelerating residential construction activity, expanding commercial real estate developments, and growing adoption of premium wood finishes across furniture manufacturing and interior design applications. India continues to demonstrate strong growth potential driven by rising disposable incomes, urbanization trends, and increasing preference for natural wood aesthetics in contemporary interior spaces.
Between 2025 and 2030, India Decorative Veneer Industry is projected to expand from USD 296.8 million to USD 368.4 million, resulting in a value increase of USD 71.6 million, which represents 40.3% of the total forecast growth for the decade. This phase of growth will be shaped by accelerating premium residential construction in metropolitan areas, expanding organized furniture retail establishing brand visibility and quality standards, and increasing specification of authentic wood veneers over printed laminates in commercial interior projects. Growing adoption of engineered and reconstituted veneers offering consistent grain patterns and cost advantages continues to drive material diversification. Manufacturers are expanding production capabilities to address designer preferences and architectural specifications, with particular emphasis on teak and walnut species serving premium residential segments.
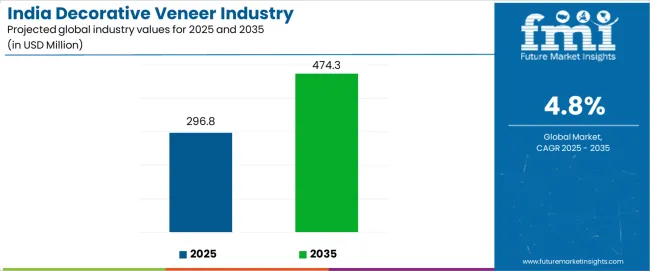
From 2030 to 2035, demand is forecast to grow from USD 368.4 million to USD 474.3 million, adding another USD 105.9 million, which constitutes 59.7% of the overall ten-year expansion. This period is expected to be characterized by maturation of sustainable sourcing certifications ensuring legal timber origins, integration of nano-technology protective finishes enhancing durability and maintenance characteristics, and expansion of automotive and marine applications requiring specialized veneer treatments. The growing emphasis on authenticity verification, particularly QR-code tracking and blockchain documentation of timber provenance, will drive demand for certified premium veneers across commercial and high-end residential applications.
Between 2020 and 2025, India Decorative Veneer Industry experienced moderate expansion, growing from USD 259.3 million to USD 296.8 million. This growth was driven by recovery from pandemic construction disruptions, acceleration of residential real estate projects in Tier-1 and Tier-2 cities, and increasing awareness of natural wood aesthetics among emerging affluent consumer segments. The sector developed as furniture manufacturers, interior designers, and construction contractors recognized the need for authentic wood finishes differentiating premium offerings while meeting evolving aesthetic preferences favoring natural materials over synthetic alternatives.
| Metric | Value |
|---|---|
| India Decorative Veneer Sales Value (2025) | USD 296.8 million |
| India Decorative Veneer Forecast Value (2035) | USD 474.3 million |
| India Decorative Veneer Forecast CAGR (2025-2035) | 4.8% |
Demand expansion is being supported by the rapid transformation of India's residential and commercial interior design preferences, driven by rising affluence among upper-middle-class households, increasing exposure to international design aesthetics through digital media and travel experiences, and growing appreciation for natural wood materials offering warmth, character, and perceived luxury compared to synthetic surface treatments. Modern residential projects, commercial office developments, and hospitality establishments increasingly specify decorative veneers for furniture, wall paneling, door finishes, and architectural millwork applications where authentic wood appearance creates premium positioning and aesthetic differentiation.
The accelerating pace of organized furniture retail expansion is fundamentally reshaping veneer consumption patterns by establishing brand recognition, quality standards, and consumer confidence in premium wood products. National furniture chains, modular kitchen specialists, and interior design firms are increasingly specifying authenticated wood veneers with traceable sourcing, consistent quality, and warranty provisions that contrast with unorganized sector offerings of uncertain provenance and variable quality. The professionalization of interior design and architecture practices, particularly in metropolitan areas, is driving specifications favoring natural veneers over printed laminates in commercial projects where clients value authentic materials and sustainable sourcing credentials.
The India decorative veneer sector stands at a transformative inflection point where rising affluence, design sophistication, and authenticity concerns converge to drive sustained demand growth. With demand projected to grow from USD 296.8 million in 2025 to USD 474.3 million by 2035-a robust 59.8% increase-the sector is being fundamentally reshaped by residential construction activity, commercial real estate development, and the pursuit of authentic wood aesthetics differentiating premium interior applications.
The confluence of urbanization trends concentrating purchasing power in metropolitan areas, organized retail expansion establishing quality benchmarks and consumer trust, and designer specifications favoring natural materials creates accelerated adoption of premium veneer solutions. Furniture manufacturers and interior contractors managing diverse project portfolios face simultaneous pressures to deliver authentic wood aesthetics, ensure legal timber sourcing, and optimize material costs through engineered veneer alternatives offering consistency advantages over natural wood variability.
Strategic pathways encompassing sustainable sourcing certifications, engineered veneer technologies, specialty finishes and treatments, and application-specific development offer substantial margin enhancement opportunities for manufacturers and distributors positioned at the quality and innovation frontier.
Pathway A - FSC/PEFC Certified Sustainable Sourcing. Regulatory scrutiny of illegal timber trade and corporate sustainability commitments drive demand for certified veneers with documented legal sourcing and forest management credentials. Premium positioning through sustainability certifications commands 15-25% price advantages in commercial projects and export applications. Expected revenue pool: USD 65-105 million.
Pathway B - Engineered & Reconstituted Veneer Innovation. Technology advances enabling creation of consistent grain patterns, exotic species replication, and optimized log utilization address natural wood scarcity and cost pressures. Engineered solutions offering aesthetic consistency and cost advantages capture growing share among furniture manufacturers and commercial applications. Potential: USD 85-140 million.
Pathway C - Nano-Technology Protective Finishes. Integration of advanced surface treatments providing scratch resistance, UV protection, and moisture barriers extends veneer durability and reduces maintenance requirements. Premium finishes commanding margin advantages address residential and commercial specifications emphasizing lifecycle performance. Revenue opportunity: USD 45-75 million.
Pathway D - Fumed & Specialty Color Treatments. Demand for contemporary dark-toned and customized color finishes drives adoption of fuming, dyeing, and thermal treatment processes creating unique aesthetic effects. Specialty treatments capture premium positioning in designer-specified applications and boutique hospitality projects. Addressable opportunity: USD 55-90 million.
Pathway E - Automotive & Marine Interior Applications. Luxury automotive manufacturers and yacht builders require specialized veneers with enhanced dimensional stability, moisture resistance, and precise thickness tolerances. Technical veneers serving transportation segments command substantial premiums through specialized processing and quality requirements. Expected uplift: USD 35-60 million.
Pathway F - QR-Code Authentication & Blockchain Tracking. Authenticity concerns and counterfeit prevention drive adoption of digital tracking technologies enabling species verification, sourcing documentation, and brand protection. Authentication solutions create differentiation while addressing commercial customer compliance requirements. Potential: USD 25-45 million.
Pathway G - Modular Furniture & Kitchen Cabinet Integration. Organized modular furniture segment growth creates concentrated veneer demand through standardized designs, factory-fabricated components, and consistent material specifications. Strategic partnerships with modular manufacturers capture high-volume segment with predictable procurement patterns. Revenue opportunity: USD 75-125 million.
Pathway H - Hospitality & Tourism Segment Development. Hotel construction, restaurant design, and resort development create project-based veneer demand with specifications emphasizing aesthetic impact, durability, and design flexibility. Hospitality-focused solutions with comprehensive technical support capture premium segment. Addressable opportunity: USD 40-70 million.
Pathway I - Export-Oriented Furniture Manufacturing. India's growing furniture export industry serving Middle East, United States, and European markets creates demand for internationally certified veneers meeting destination-country regulations and quality standards. Export-compliant veneer solutions enable furniture manufacturers to access premium international markets. Market potential: USD 50-85 million.
Pathway J - Tier-2 & Tier-3 City Market Penetration. Urbanization and income growth in emerging cities create untapped veneer demand from local furniture manufacturers, contractors, and retail outlets. Targeted distribution and technical support strategies unlock volume growth in underserved markets beyond metropolitan concentrations. Revenue opportunity: USD 60-100 million.
Demand is segmented by wood species, end use, veneer type/finish, thickness, and region. By wood species, sales are divided into teak, walnut, oak, maple, and mahogany and other species. Based on end use, demand is categorized into residential, commercial, hospitality and tourism, and automotive and marine applications. In terms of veneer type/finish, sales are segmented into natural sliced veneers, engineered/reconstituted veneers, and dyed/fumed specialty treatments. By thickness, demand is divided into 0.4-0.6 mm, ≤0.3 mm, 0.7-1.0 mm, and >1.0 mm categories. Regionally, demand is divided into South India, West India, North India, and East India.
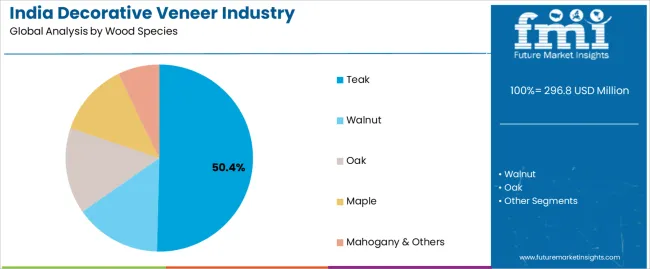
Teak is projected to account for 50.4% of India Decorative Veneer Industry in 2025, making this wood species the overwhelming dominant segment across residential, commercial, and hospitality applications. This dominance reflects teak's cultural significance in Indian furniture traditions, superior dimensional stability and natural durability characteristics, and aesthetic preferences favoring golden-brown to dark-brown color tones associated with premium quality and timeless design.
The segment encompasses natural teak (35.0% subsegment share) sourced from mature forest plantations and legal harvesting operations offering authentic grain patterns and color variation, plantation/engineered teak (9.7%) utilizing faster-growing cultivated timber with consistent characteristics suited to contemporary furniture manufacturing, and fumed/dark-toned teak (5.7%) incorporating specialized treatments creating contemporary darker finishes meeting modern interior design preferences.
Natural teak maintains dominant position through combination of aesthetic superiority with distinctive grain figuring and color depth, cultural associations with quality and luxury established through generational furniture traditions, and performance characteristics including natural oil content providing inherent moisture and insect resistance. The premium positioning of natural teak creates price stratification within veneer markets, with highest-grade book-matched panels commanding substantial premiums for featured applications where grain patterns become focal design elements. Natural teak scarcity from restricted harvesting regulations and depleted natural forest stocks creates supply constraints supporting price levels while driving development of plantation alternatives.
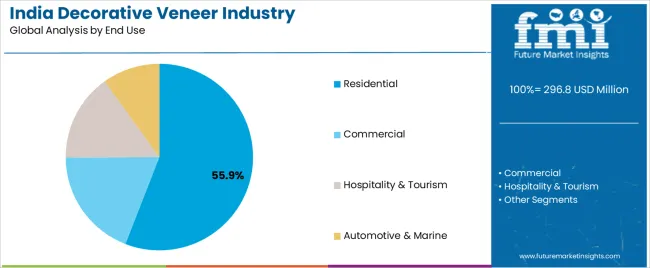
Residential applications are projected to account for 55.9% of India Decorative Veneer Industry in 2025, making this end use category the dominant segment driven by housing construction activity, interior renovation projects, and consumer preferences for premium wood finishes in living spaces. The segment encompasses furniture (22.6% subsegment share) including bedroom sets, dining tables, living room cabinetry, and entertainment units where veneer provides authentic wood appearance at accessible price points compared to solid timber, wall/ceiling panels (17.4%) creating featured architectural elements and establishing cohesive interior design themes, and doors/kitchen fronts (15.9%) where veneer finish quality directly impacts perceived home value and aesthetic appeal.
Furniture represents the largest residential subsegment, with organized and unorganized manufacturers utilizing veneers for visible surfaces while employing engineered substrates for structural components. The modular furniture segment demonstrates particularly strong veneer consumption as factory-fabricated kitchen cabinets, wardrobes, and entertainment units incorporate consistent veneer finishes across component ranges. Premium residential projects increasingly specify authentic wood veneers for custom millwork and built-in cabinetry where clients value natural materials and design flexibility enabling personalized aesthetic expressions.
Natural sliced veneers are projected to account for 62.0% of India Decorative Veneer Industry in 2025, making this veneer type the dominant segment across residential, commercial, and hospitality applications. The segment encompasses quarter/flat cut methods (38.5% subsegment share) producing straight grain patterns through perpendicular or parallel slicing relative to growth rings, and rift/rotary techniques (23.5%) creating distinct visual effects including dramatic cathedral patterns from rotary peeling and subtle grain from rift-cutting. Natural sliced veneers maintain market dominance through authentic wood character including natural grain variation, color depth, and figuring that cannot be precisely replicated through engineered alternatives.
Quarter-cut and flat-cut slicing methods represent standard production techniques yielding commercially viable veneer volumes with aesthetically desirable straight-grain patterns suited to contemporary furniture and millwork applications. Quarter-cutting produces particularly stable veneers with minimal seasonal movement and distinctive ray fleck figure in certain species including oak, making this cutting method preferred for applications requiring dimensional stability. Flat-cutting provides efficient log utilization and characteristic cathedral grain patterns created by tangential cuts through growth rings, offering aesthetic variety within individual flitch sequences.
India Decorative Veneer Industry is advancing steadily due to accelerating residential construction and interior renovation activity, expanding organized furniture retail establishing quality standards, and growing designer specifications favoring authentic wood materials over synthetic alternatives. However, the sector faces challenges including illegal timber trade undermining market confidence, skilled labor shortages affecting production quality and finishing operations, and raw material supply constraints from forest regulations and export restrictions. Sustainable sourcing certifications and digital authentication technologies continue to influence product specifications and create differentiation opportunities.
The expansion of organized furniture retail chains including Urban Ladder, Pepperfry, IKEA, and national brands is fundamentally reshaping veneer consumption patterns by establishing quality benchmarks, brand recognition, and consumer confidence in premium wood products. Organized retailers specify authenticated veneers with documented species identification, legal sourcing credentials, and consistent quality standards differentiating offerings from unorganized sector alternatives of uncertain provenance. These retailers operate quality control processes, warranty programs, and customer service infrastructure creating consumer trust enabling premium pricing and repeat purchase behavior. The organized segment's growth creates concentrated veneer demand from furniture manufacturers supplying retail chains, with procurement decisions emphasizing material consistency, supply reliability, and compliance documentation. Modular furniture specialists including Godrej Interio, Sleek Kitchens, and Hafele demonstrate particularly strong veneer consumption through standardized product ranges incorporating consistent finishes across component systems.
India's decorative veneer sector confronts persistent challenges from illegal timber trade undermining market confidence, creating unfair competition, and exposing buyers to legal and reputational risks. International certifications including FSC (Forest Stewardship Council) and PEFC (Programme for the Endorsement of Forest Certification) provide verification of legal sourcing and sustainable forest management, with certified veneers commanding premium positioning in commercial projects and export applications where customers demand documentation of timber origins and chain-of-custody tracking. Corporate sustainability policies, particularly among multinational companies operating in India, establish procurement requirements favoring certified materials demonstrating environmental and social responsibility. Green building certifications including LEED (Leadership in Energy and Environmental Design) award points for sustainably sourced wood products, driving specifications of certified veneers in commercial construction projects pursuing certification recognition.
| State | CAGR (2025-2035) |
|---|---|
| Maharashtra | 5.9% |
| Delhi (NCT) | 5.7% |
| Karnataka | 5.5% |
| Telangana | 5.3% |
| Kerala | 5.2% |
| Gujarat | 5.1% |
| West Bengal | 5.0% |
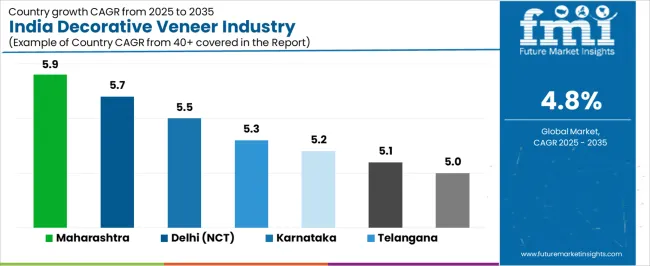
India Decorative Veneer Industry demonstrates significant state-level variation in growth patterns, driven by diverse factors including real estate construction activity, commercial development concentrations, furniture manufacturing clusters, and regional aesthetic preferences. Maharashtra leads growth at 5.9% CAGR through 2035, reflecting high-end residential and commercial fit-outs in Mumbai-Pune corridor and rising premium furniture manufacturing hubs. Delhi follows at 5.7% CAGR, driven by Grade-A office and retail refurbishments incorporating sustainability and authenticity tracking in material specifications. Karnataka exhibits 5.5% growth supported by Bengaluru modular furniture sector expansion and design-build adoption in technology campus developments.
Demand for decorative veneers in Maharashtra is projected to grow at 5.9% CAGR through 2035, the highest growth rate nationally, driven by high-end residential construction and interior fit-outs in Mumbai metropolitan region and Pune, rising premium furniture manufacturing clusters serving domestic and export markets, and commercial real estate development incorporating contemporary interior specifications. Mumbai's position as India's financial capital creates concentrated affluent consumer population pursuing premium residential interiors with authentic wood finishes, custom millwork, and designer-specified materials differentiating properties in competitive luxury real estate markets.
The state's furniture manufacturing sector, particularly clustered in and around Mumbai and Pune regions, demonstrates increasing sophistication through adoption of advanced woodworking machinery, quality management systems, and export-oriented production serving Middle East and other international markets. These manufacturers increasingly utilize authenticated veneers meeting international quality standards and sustainability certifications required for export compliance and premium domestic positioning.
Demand for decorative veneers in Delhi is expanding at 5.7% CAGR, driven by Grade-A office building refurbishments and new construction incorporating contemporary workplace design principles, retail space modernization in premium shopping districts and malls, and sustainability and authenticity tracking in material specifications responding to corporate environmental policies. Delhi's concentration of multinational corporation offices, government institutions, and corporate headquarters creates substantial commercial interior demand with specifications emphasizing sustainability credentials, authenticated sourcing, and compliance documentation.
The city's retail sector including Connaught Place, Saket, and Aerocity districts demonstrates continuous upgrading cycles as brands refresh store designs, shopping centers modernize interiors, and luxury retail outlets establish flagship locations. These commercial applications favor authenticated wood veneers providing premium positioning and brand alignment with sustainability values. Delhi's residential sector, particularly in South Delhi neighborhoods and Gurgaon satellite city, demonstrates strong adoption of contemporary interior design incorporating feature veneer walls, premium cabinetry, and custom millwork establishing sophisticated residential environments.
Demand for decorative veneers in Karnataka is growing at 5.5% CAGR, supported by Bengaluru modular furniture sector expansion serving technology industry professionals and affluent residential developments, design-build adoption in technology campus developments incorporating biophilic design and contemporary workspace aesthetics, and organized retail penetration establishing branded furniture outlets throughout the state. Bengaluru's technology industry concentration creates affluent consumer base pursuing contemporary residential interiors, with modular kitchen and wardrobe specialists demonstrating strong growth through organized retail expansion.
The state's technology campus developments including corporate offices for IT companies and startup incubators incorporate extensive interior design specifications emphasizing employee wellness, collaborative work environments, and contemporary aesthetics. These projects specify authentic wood finishes for collaborative spaces, conference rooms, and common areas creating perceived quality and environmental connection.
Demand for decorative veneers in Telangana is expanding at 5.3% CAGR, driven by Hyderabad upscale housing construction serving pharmaceutical and technology industry professionals, hotel pipeline development supporting business tourism and leisure travel growth, and organized retail expansion bringing national furniture brands to the state. Hyderabad's pharmaceutical and biotechnology industry concentration creates affluent consumer population pursuing premium residential interiors, with gated community developments incorporating contemporary design and quality finishes.
The city's hospitality sector demonstrates strong growth through business hotel construction serving pharmaceutical conferences and technology industry travel, plus resort development in periphery areas targeting leisure tourism. These hospitality projects specify distinctive interior designs incorporating regional aesthetic influences and natural materials including authentic wood veneers establishing property character and brand positioning.
Demand for decorative veneers in Kerala is growing at 5.2% CAGR, supported by local hardwood sourcing traditions and established timber processing infrastructure, hospitality sector serving domestic and international tourism with resorts and boutique properties, and premium home interiors reflecting the state's relatively high income levels and education standards. Kerala's long-established timber industry provides supply chain infrastructure and technical capabilities supporting veneer production from local plantation teak and other species.
The state's tourism sector including Ayurvedic resorts, beach properties, and backwater houseboats creates specialized veneer demand with specifications emphasizing natural materials and regional aesthetic character. Kerala's residential construction demonstrates strong preference for wood finishes reflecting cultural traditions and material familiarity, with custom millwork and furniture specifications incorporating teak and other hardwood veneers.
Demand for decorative veneers in Gujarat is expanding at 5.1% CAGR, driven by contractor clusters and furniture manufacturing supporting export cabinetry production, industrial township development requiring residential and commercial infrastructure, and commercial construction in Ahmedabad, Surat, and other urban centers. Gujarat's furniture manufacturing sector, particularly concentrated in Morbi and other industrial areas, demonstrates export orientation serving Middle East, Africa, and other international markets requiring quality materials and sustainable sourcing documentation.
The state's industrial development creates township construction with residential quarters, administrative buildings, and recreational facilities incorporating interior fit-outs and furniture specifications. Gujarat's commercial real estate including office buildings, retail centers, and hospitality properties demonstrates steady growth supporting state's industrial and business activity.
Demand for decorative veneers in West Bengal is projected to expand at 5.0% CAGR, driven by Kolkata renovation cycles in colonial-era buildings and aging residential properties, boutique hospitality development including heritage hotel conversions and contemporary properties, and heritage restoration projects preserving architectural character while incorporating modern amenities. Kolkata's substantial aging building stock creates continuous renovation and interior upgrade activity as property owners modernize interiors while maintaining architectural character.
The city's hospitality sector demonstrates growth through heritage property conversions establishing boutique hotels in restored colonial buildings, plus contemporary hotel development serving business and leisure travel. These projects specify authentic materials including wood veneers establishing period character or contemporary luxury positioning. West Bengal's furniture manufacturing, while less prominent than other states, serves regional markets with traditional designs and emerging contemporary offerings incorporating premium veneers for differentiated products.
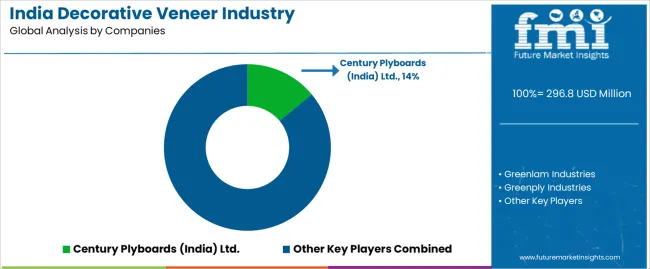
India Decorative Veneer Industry is defined by competition among integrated plywood and panel manufacturers incorporating veneer production, specialized veneer suppliers focusing on premium species and finishes, and import distributors serving high-end residential and commercial segments.
Manufacturers are investing in sustainable sourcing certifications demonstrating legal timber origins, nano-technology protective finishes enhancing durability and maintenance characteristics, QR-code authentication systems enabling species verification and counterfeit prevention, and comprehensive distribution networks reaching furniture manufacturers, contractors, and retail outlets across regional markets. Strategic partnerships between veneer producers and furniture manufacturers, technology development in engineered veneer processes and specialty treatments, and vertical integration connecting timber sourcing through finished panel production are central to strengthening competitive positioning across diverse residential, commercial, and hospitality applications.
Century Plyboards (India) Ltd., based in Kolkata and listed on NSE/BSE, leads with approximately 14.0% share through comprehensive product portfolio including decorative veneers, plywood, and laminates, extensive distribution network reaching pan-India markets, and recent investments in QR-code authentication systems and nano-technology finishes enhancing product differentiation. Greenlam Industries, headquartered in Haryana, provides premium laminates and veneers emphasizing design innovation, international aesthetic influences, and commercial segment presence serving architects and interior designers.
Greenply Industries offers comprehensive wood panel solutions including decorative veneers with focus on sustainability certifications, quality consistency, and organized retail partnerships. Merino Group delivers premium laminates and veneers emphasizing high-end residential and commercial applications with design-forward aesthetics. Durian Industries provides integrated furniture and veneer solutions targeting residential segment with branded retail presence and comprehensive product ranges.
| Item | Value |
|---|---|
| Quantitative Units | USD 474.3 million |
| Wood Species | Teak (natural teak, plantation/engineered teak, fumed/dark-toned teak), walnut, oak, maple, mahogany and others |
| End Use | Residential (furniture, wall/ceiling panels, doors/kitchen fronts), commercial, hospitality and tourism, automotive and marine |
| Veneer Type/Finish | Natural sliced veneers (quarter/flat cut, rift/rotary), engineered/reconstituted, dyed/fumed specialty |
| Thickness | 0.4-0.6 mm (0.5 mm nominal, 0.6 mm nominal), ≤0.3 mm, 0.7-1.0 mm, >1.0 mm |
| Region (India) | South India (Karnataka, Tamil Nadu, Kerala), West India, North India, East India |
| States Covered | Maharashtra, Delhi (NCT), Karnataka, Telangana, Kerala, Gujarat, West Bengal |
| Key Companies Profiled | Century Plyboards (India) Ltd., Greenlam Industries, Greenply Industries, Merino Group, Durian Industries, Archidply Décor, Duroply Industries, Euro Décor, Natural Veneers, Globe Panel Industries (I) Pvt. Ltd. |
| Additional Attributes | Dollar sales by wood species, end use segment, veneer type/finish, thickness category, and regional distribution across India, state-level demand trends across Maharashtra, Delhi, Karnataka, and other key states, competitive landscape with integrated panel manufacturers and specialized veneer suppliers, sustainable sourcing certification dynamics including FSC and PEFC adoption, integration with QR-code authentication and blockchain tracking systems, innovations in engineered and reconstituted veneer technologies, and adoption of nano-technology protective finishes, fumed and dyed specialty treatments, and application-specific development for enhanced aesthetic differentiation and performance characteristics across residential, commercial, and hospitality applications |
The India Decorative Veneer Industry is estimated to be valued at USD 296.8 million in 2025.
The market size for the India Decorative Veneer Industry is projected to reach USD 474.3 million by 2035.
The India Decorative Veneer Industry is expected to grow at a 4.8% CAGR between 2025 and 2035.
The key product types in India Decorative Veneer Industry are teak , walnut, oak, maple and mahogany & others.
In terms of end use, residential segment to command 55.9% share in the India Decorative Veneer Industry in 2025.


Full Research Suite comprises of:
Market outlook & trends analysis
Interviews & case studies
Strategic recommendations
Vendor profiles & capabilities analysis
5-year forecasts
8 regions and 60+ country-level data splits
Market segment data splits
12 months of continuous data updates
DELIVERED AS:
PDF EXCEL ONLINE
India Outbound Tourism Market Size and Share Forecast Outlook 2025 to 2035
India Casino Tourism Market Forecast and Outlook 2025 to 2035
India Online Grocery Market Size and Share Forecast Outlook 2025 to 2035
India Electrical Testing Services Market Size and Share Forecast Outlook 2025 to 2035
India Ready-to-mix Food Market Size and Share Forecast Outlook 2025 to 2035
India Steel Drum & IBC Market Size and Share Forecast Outlook 2025 to 2035
India Lab Grown Diamond Jewelry Market Size and Share Forecast Outlook 2025 to 2035
India Colored Gemstones Market Size and Share Forecast Outlook 2025 to 2035
India Thyroid Function Test Market Insights - Trends, Demand & Growth 2025-2035
India Kaolin Market Analysis - Size, Share, and Forecast 2025 to 2035
India Outbound Meetings, Incentives to Europe Market Size and Share Forecast Outlook 2025 to 2035
India Hydrological and Meterological Equipment Market Size and Share Forecast Outlook 2025 to 2035
India Loyalty Program Market Analysis - Size, Share, and Forecast 2025 to 2035
India Injection Moulders Market – Demand and Growth Forecast 2025 to 2035
India Solar Panel Mounting Structure Market Analysis and Forecast for 2025 to 2035
India Residential Solar Inverter Market Growth – Trends & Forecast 2025 to 2035
India Power Metering Market Insights – Trends & Forecast 2025 to 2035
India Shape Memory Alloy Market Analysis by Material Type, Component Type, Application, End Use Industry, and Region Forecast Through 2025 to 2035
India Centrifugal Pumps Market Report – Trends, Demand & Outlook 2025-2035
Analyzing India Loyalty Program Market Share & Industry Leaders

Thank you!
You will receive an email from our Business Development Manager. Please be sure to check your SPAM/JUNK folder too.
Chat With
MaRIA